The Impact of Exchange Rate, Bank Indonesia Certificate and Global Indexes on the Composite Price Index (IHSG) in Indonesia
←
→
Page content transcription
If your browser does not render page correctly, please read the page content below
Muhamad YUNANTO, Henny MEDYAWATI / Journal of Asian Finance, Economics and Business Vol 8 No 6 (2021) 0651–0660                                651

Print ISSN: 2288-4637 / Online ISSN 2288-4645
doi:10.13106/jafeb.2021.vol8.no6.0651

             The Impact of Exchange Rate, Bank Indonesia Certificate and
            Global Indexes on the Composite Price Index (IHSG) in Indonesia

                                                          Muhamad YUNANTO1, Henny MEDYAWATI2

                                         Received: March 10, 2021                 Revised: May 08, 2021 Accepted: May 15, 2021

                                                                                        Abstract
The purpose of this study is to analyze the contribution of exchange rates, Bank Indonesia Certificate (SBI), and global stock price indexes
toward the Composite Stock Price Index (IHSG), and the shocks caused by the global index to the IHSG. The research variables are HSGI,
rupiah exchange rate, and global stock price index, which includes NASDAQ, the Hong Kong stock price index (Hang Seng), the Japanese
stock price index (Nikkei 225), and the South Korean stock price index (Kospi). The data used is monthly time-series data from 2008 to
2019. The data used in this study are secondary data obtained from Bank Indonesia publications through www.bi.go.id, the Indonesia
Stock Exchange, and Yahoo Finance (finance.yahoo.com). Following the type of data used, the research steps include the unit root test,
cointegration test, and estimation using the Vector Error Correction Model (VECM). Based on the results of the impulse response and
variance decomposition analysis, it can be seen that the overall global index, exchange rates, and SBI interest rates contributed to the IHSG
movement. Based on the analysis of variance decomposition, the percentage value of the contribution of the Hang Seng index is the biggest
compared to the NASDAQ, Nikkei 225, and Kospi.

Keywords: IHSG, Stock Price Index, Vector Error Correction Model

JEL Classification Code: C22, E40, F30

1. Introduction                                                                                  its performance has ups and downs. Investors can take
                                                                                                 advantage of the capital market as a means of investing to
    Investment in the capital market is influenced by several                                    gain profits in the form of increased capital (capital gains)
factors, both economic and non-economic. Aspects that affect                                     and dividends to invest in the stock market, and interest for
investment activities in the capital market are macroeconomic                                    investing in the bond market. If the returns expected from an
conditions in which these conditions are reflected as monetary                                   investment are high, the risk is also high. To make the right
economic indicators. These include GDP, inflation, interest                                      investment decision or to get returns as expected, investors
rates, the rupiah exchange rate against the US dollar, foreign                                   need to make assess in advance the stocks they would
exchange reserves, the balance of payments, and conditions                                       want to choose. The stock valuation that produces intrinsic
of regional exchanges. In Indonesia, capital market trading is                                   value information will then be compared with the stock
carried out on the Indonesia Stock Exchange. The Indonesia                                       market price to determine the buying or selling position of a
Stock Exchange can spur economic growth because cheap                                            company’s stock (Tandelilin, 2010).
funds can be obtained from the capital market, even though                                           The fall in financial and monetary markets as a result of
                                                                                                 the financial crisis in the United States had a negative impact
                                                                                                 on other countries, such as Indonesia where the rupiah
 First Author. Associate Professor, Gunadarma University, Indonesia.
1                                                                                               depreciated against the dollar and resulted in a decline in
 Corresponding Author. Associate Professor, Gunadarma University,
2
                                                                                                 the price of trading shares on Indonesia Stock Exchange
 Indonesia [Postal Address: Bukit Cengkeh Berbunga Blok A2/17                                    (IDX) incorporated in IHSG. IHSG is the yardstick that is
 Jalan Anggrek 1 Depok 16418, West Java, Indonesia]
 Email: henmedya@staff.gunadarma.ac.id; medyawati70@gmail.com                                    used to measure the combined performance of all shares
                                                                                                 listed on the IDX. The more developed the national capital
© Copyright: The Author(s)
This is an Open Access article distributed under the terms of the Creative Commons Attribution   market, the more will the IHSG increase. Susilo, Wahyudi,
Non-Commercial License (https://creativecommons.org/licenses/by-nc/4.0/) which permits
unrestricted non-commercial use, distribution, and reproduction in any medium, provided the
                                                                                                 and Pangestuti (2020) examine the influence of the world
original work is properly cited.                                                                 and regional capital market conditions on the Indonesian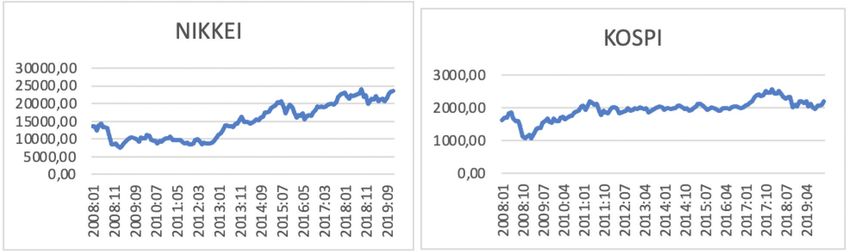
652           Muhamad YUNANTO, Henny MEDYAWATI / Journal of Asian Finance, Economics and Business Vol 8 No 6 (2021) 0651–0660

capital market (IDX) condition. It was found that there was a       the Korean economy, especially a negative effect on the
significant positive effect of DJIA with lag 1 and Hang Seng        money supply.
index on the IHSG, but no significant effect was found from             Apart from exchange rates, there are other factors,
the Nikkei 225 index on the IHSG. Investment in the capital         namely, the global stock market index, which is used to
market is influenced by several factors, both economic and          measure the economic performance of a country. The
non-economic factors.                                               global stock exchange index used in this study is the first,
    Apart from monetary economic indicators, other things           stock exchange index in America, namely the Nasdaq.
that need to be considered, namely, regional exchanges,             The NASDAQ Stock Market is the second-largest stock
especially the United States, which has the largest capital         exchange in the world after the NYSE. NASDAQ was
market industry in the world, so that it is used as an indicator    founded in 1939 in Washington. Exchange members on
of other stock market developments (Sunariyah, 2011).               the NASDAQ are called market-makers, the number of
Samsul (2006) states that index movements in a country’s            which reaches 415 securities companies (Samsul, 2006).
capital market are influenced by world capital market               Second is the stock exchange index in Hong Kong, namely,
indexes. This is due to trade flows between countries,              the Hang Seng. The Hang Seng Index has the average
freedom of information flow, and deregulation of capital            combined price of 33 blue-chip companies in Hong Kong,
market regulations, which make it easier for investors to           one of which is HSBC. Third is the stock exchange index
enter a country’s capital market. Garefalakis, Dimitras,            in Japan, namely, the Nikkei 225. Japan is a country
Koemtzopoulos, and Spinthiropoulos (2011) explore the               that plays a role in encouraging Indonesia’s economic
effects of equity, energy, gold, and currency indicators on the     development, which can be viewed from three aspects
Hang Seng index. The results suggest that the major stock           including the trade, investment, and economic cooperation
markets, and particularly the SP500, positively influence           sectors. Fourth is the stock exchange index in South
the Hong Kong stock market, a fact that is attributed to the        Korea, namely, Kospi. Indonesia is one of the countries
integration and internationalization of stock markets. This         that have an important position in South Korea, in several
study, also, provides evidence that crude oil, as a proxy           fields, such as economy, industry, manufacturing, and
for economic activity and playing a substantial role in the         cultural exchange. Besides, South Korea has experienced
modern portfolio formation, also affects, positively the Hong       an economic growth in recent years, partly due to the
Kong stock market. Furthermore, the results show that the           sale of electronic products, which are in great demand by
volatility of the gold returns influence, the mean return of the    Indonesians.
Hang Seng index negatively. Finally, the research findings              The purpose of this study is to analyze the impact of the
show that the volatility of Hang Seng index returns has             shock from the global index (Nasdaq, Hang Seng, Nikkei
revealed an asymmetric phenomenon, as it appears to be              225, Kospi), SBI, and exchange rates on the IHSG on the
more volatile in response to negative shocks caused by lower        IDX for the 2008–2019 period. Also, this study analyzes
Hang Seng index prices.                                             the percentage contribution of each variable in the research
    The dollar exchange rate is one of the factors that             model toward the movement of IHSG, which is relatively
mostly influence the ups and downs of the IHSG. If the              uncommon in previous studies. The contribution of this
dollar exchange rate is high, investors will prefer to invest       research is to continue on the previous research conducted
in US dollars compared to investments in securities because         by Medyawati and Yunanto (2015) with the additional
investing in securities is a long-term investment. Likewise, if     data from 12 years and the addition of variables, namely,
the value of the US dollar exchange rate decreases, investors       interest rates. This is to obtain a more in-depth and thorough
will prefer investing in securities so that it will affect the      analysis. In this study, the interest rate used is that from SBI
value of stock transactions, which in turn will affect the          (Bank Indonesia Certificate). The estimation method used
IHSG (Hermawan & Triono, 2010). Lee and Brahmasrene                 in this study is the Vector Error Correction Model (VECM)
(2019) found that the results of vector error correction            because it is considered the most suitable for the type of
estimates show that long-term causality from exchange               time-series data. Some studies that use the VAR model are
rates to the Korean stock market is observed. For short-            generally related to the analysis of the impact, contribution,
term causality, the coefficient of the Japanese yen exchange        or influence of a variable on other variables with a long
rate is significant with a positive sign, that is, short-term       research time (more than 10 years), namely, Purwono and
causality from the Japanese yen exchange rate to the Korean         Mucha (2018) who conducted an impact analysis from
stock market is observed. The coefficient of the financial          exchange rate volatility with research data from 2005–2014.
crises, i.e., 1997–1999 Asian financial crisis and 2007–2008        Nguyen (2020) analyzed the relationship between various
global financial crisis on the endogenous variables in the          factors such as FDI, foreign aid, exports, and economic
model and the Korean economy is significant. The result             growth in Vietnam. This research employed secondary time-
indicates that the financial crises have considerably affected      series data from 1997–2018.
Muhamad YUNANTO, Henny MEDYAWATI / Journal of Asian Finance, Economics and Business Vol 8 No 6 (2021) 0651–0660 653
2. Literature Review on the IHSG. Taking the exchange rate and the Dow Jones
influence the IHSG. Sutanto, Werner, and Ernawati (2013)
The following describes several studies that discuss analyzed the effect of macroeconomics on the IHSG. The
the influence of macro variables on the IHSG movement. variables used in this research are SBI, World Oil Price,
According to Dornbusch and Fischer (1980) state that changes World Gold Price, Rupiah Exchange Rate against Dollar,
in currency or exchange rates affect the competitiveness of Nikkei 225 Index, and Dow Jones Index. The results showed
a company, which in turn affects the company’s revenue or that the SBI and World Oil Price variables had no significant
cost of funds and subsequently its share price. On a macro positive effect on the IHSG. World Gold Price Variables,
level, the impact of currency exchange rate fluctuations on Nikkei 225 Index, and Dow Jones Index have a significant
the capital market depends highly on the level of openness positive effect on the IHSG. The variable the Rupiah
of the domestic economy and the sustainability of the trade exchange rate against the Dollar has a significant negative
balance. Roni (2013) analyzes the cointegration and causality effect on the IHSG. Nezky (2013) shows that the US crisis
relationship as well as the dynamic relationship between affects the capital market in Indonesia where the Dow
foreign capital flows and changes in exchange rates and the Jones Industrial Average plays a greater role in explaining
movement of the IHSG in the Indonesian capital market. the IHSG, compared to the Rupiah rate, production index,
The results of this study indicate that the IHSG is better able and the trade income tax. Besides, the US crisis affects the
to explain its effect on capital inflow into Indonesia, while volume and the trade income tax in Indonesia. Asia Pacific
capital inflow can explain its effect on the movement of the stock prices affect the JCI. Gom (2013) found that the Fed
rupiah exchange rate. variable influences negatively against the IHSG, while
Yuliana and Syamsudin (2010) examined the effect of the Dow Jones Index and the Nikkei 225 Index influence
macroeconomic variables and the foreign stock price index positively against the IHSG.
on the composite stock price index. The results from their Oktarina (2016) analyzes the effect of several global
study show that inflation, money supply, and the Dow Jones stock indexes and macroeconomic indicators on JCI. The
Industrial Average have a positive effect on the IHSG, while global stock indexes and macroeconomic indicators used
the SBI and exchange rates have a negative effect on the in this study are the Dow Jones Industrial Average Index,
IHSG. Research conducted by Sidiq (2010) on the effect of Nikkei 225 index, Shanghai Composite Index, FTSE100
the STI (The Straits Times Index), TAIEX, KOSPI, HANG index, oil prices, gold prices, exchange rate IDR/USD, BI
SENG stock index on the movement of the composite stock rate, and inflation, that were taken monthly from 2009 until
price index on the IDX shows that the Asia Pacific stock price 2014. This research used multiple linear regression analysis.
index has an effect on the IHSG except for TAIEX, whereas The results indicate that the Dow Jones Industrial Average
simultaneously the Asia Pacific stock price index affects on index, Nikkei 225 index, gold prices, and inflation have
the IHSG movement. Research has also been conducted by a positive effect on IHSG, while the Shanghai Composite
Hasibuan and Taufik (2011) on the effect of the global stock index, FTSE100 index, oil prices, exchange rate IDR/USD,
price index on the movement of the composite stock price and BI rate have a negative effect to IHSG. Murty, Anthony,
index. The results showed that the global stock price index, and Vighnesvaran (2017) studied the relationship between
namely Nasdaq, Kospi, Taiex, and Nikkei simultaneously Kuala Lumpur Composite Index Stock Market Return
affected the IHSG. The partial analysis shows that the Nasdaq and four macroeconomic determinants, namely, interest
and Kospi indexes have an effect, while Taiex and Nikkei rate, exchange rate, money supply, and oil price from
have no significant effect on the IHSG. The relationship January 1997 to December 2015 monthly with a total of
between currency exchange rates and stock prices has been 228 observations. Results indicated that there is a negative
studied for more than 30 years. Purnomo (2012) examines relationship between exchange rate and stock market return
both short and long-term relationships between domestic and a positive relationship between money supply and
and foreign source stocks and the Composite Stock Market stock market return. Interest rate and oil price are found
Index (IHSG). This research finds that the Indonesian-dollar to have an insignificant relationship with the stock market
exchange rate has bidirectional influences on the IHSG. return. Nidar and Diwangsa (2017) found that the Dow
In addition to domestic macroeconomic variables, this Jones index and the STI index have a significant positive
research reports evidence that the IHSG is cointegrated effect on the movement of foreign investments in the Stock
with the stock market indexes of several Southeast Asian Exchange. In contrast, the movement of world oil prices
stock markets. Haryogo (2013) examines the effect of the and the exchange rate of the IDR/USD have a significant
exchange rate and the Dow Jones index on the Composite negative effect on the movement of foreign investments in
Index on the Indonesia Stock Exchange. The results showed the BEI. Kusumawati and Asandimitra (2017) analyze the
that partially, the exchange rate had no significant effect influence of DIJA Index, FTSE100 Index, NIKKE I225
on the IHSG, while the Dow Jones had a significant effect Index, KOSPI Index, Hang Sheng Index, Gold Price, Money654 Muhamad YUNANTO, Henny MEDYAWATI / Journal of Asian Finance, Economics and Business Vol 8 No 6 (2021) 0651–0660
Supply and net export to Indonesia Composite Index. The 4. Results and Discussion
result of this study shows that DJIA, FTSE100, Hang
Seng, money supply, and net export have not influenced This study uses seven variables, namely, IHSG,
Indonesia’s Composite Index. Meanwhile, NIKKEI 225, exchange rates, SBI, and global stock indexes represented
KOSPI, and gold price have a positive relationship with by NASDAQ, Hangseng, Nikkei, and Kospi. The IHSG has
Indonesia Composite Index. been fluctuating for 12 years. This indicates that the stock
Larasati and Topowijono (2017) analyze thе influеncе market in Indonesia is very active and can provide a special
of inflаtion rаtе, intеrеst rаtе of SBI, аnd Unitеd Stаtеs attraction for domestic and foreign investors. In August
Dollаr еxchаngе rаtе simultаnеously аnd pаrtiаlly on thе 2008 IHSG experienced a decline due to the global crisis.
Compositе Stock Pricе Indеx (IHSG). Thе sаmplе wаs bаsеd The decline was sharp enough to touch the level of 1241.54
on monthly timе-sеriеs dаtа from Jаnuаry 2010 to Dеcеmbеr points in 2008. But after the global crisis, the IHSG again
2011. Results indicаted thаt inflаtion rаtе, SBI rаtе, аnd US showed positive things seen from 2009 to 2015 IHSG tended
Dollаr еxchаngе rаtе hаve significаnt influеncе on thе IHSG to continue to increase. In 2015 IHSG in the first semester
simultаnеously. They further indicаtеs thаt inflаtion rаtе, could reach the level of 5518.51 points. However, after the
SBI rаtе аnd US Dollаr еxchаngе rаtе еаch hаd а nеgаtivе first semester of 2015 till early 2016, the IHSG experienced
еffеct аnd are significаnt to IHSG. Thе most dominаnt a slight decline, i.e., in the range of 4223.78 to 5422.38
influеntiаl vаriаblе in this rеsеаrch is US Dollаr еxchаngе points. 2015 was a hectic year, marked with high volatility
rаtе. Oktavia, and Handayani (2018) analyze the effect of due to uncertainty about the timing of the US interest rate
the rupiah exchange rate on GDP growth, and the Dow Jones hike (which was finally decided by the Federal Reserve in
Index Average (DJIA) on the composite stock price index on December 2015) and the economic slowdown of the People’s
the Indonesia stock exchange, over the period 2012–2015. Republic of China (PRC). 2017 seems to have been quite an
Based on the result it is known that the rupiah exchange rate exciting year for the Indonesian stock market. The Jakarta
has no effect on the Composite Stock Price Index (IHSG). Composite Index (IHSG) has experienced a strengthening
GDP growth and the Dow Jones index Average (DJIA) have trend from the beginning of the year to the end of the year.
affected the IHSG. Widodo (2018) found that N225, KS11 HSG continued its strengthening trend during June and July
and KLSE variables have positive and significant influence 2017. At its peak, the IHSG again recorded its highest record,
on JKSE variable. Whereas HSI and STI variables have no at 5,900 on 3 July 2017. The strengthening of the IHSG
effect on JKSE variable during January 2009 to May 2017. was welcomed by many parties, including President Joko
Setiawan and Mulyani (2020) analyzes the effect of Rupiah Widodo. Jokowi stated that the increase in the JCI to a record
exchange rate, inflation rate, and international exchange high was proof of the high level of investor confidence in the
index towards IHSG. The independent variables of this study Indonesian economy (Setiawan, 2017).
are rupiah exchange rate, inflation rate, Dow Jones index, The rupiah exchange rate is the exchange rate of rupiah
Nikkei 225 index, and Hang Seng index. against the United States dollar. The exchange rate used is
the rupiah middle exchange rate against the United States
3. Research Method and Materials dollar issued by Bank Indonesia. The rupiah exchange rate
fluctuated slightly in the 2008–2019 period. In November
The research variables are HSGI, rupiah exchange rate, 2008, the rupiah exchange rate was the highest, while in
and global stock price index, which includes the American February 2013 the rupiah was at the lowest. For the first
stock price index (Nasdaq), Hong Kong stock price index time since April 2009, in September 2013, the US-rupiah
(Hang Seng), Japanese stock price index (Nikkei 225), and middle exchange rate rose to Rp11,000. This is due to,
South Korean stock price index (Kospi). The data used is among other things, unstable political conditions in certain
monthly time-series data from 2008 to 2019. The reason countries. At that time, market participants were worried
for the start of the research year to be 2008 is because that that, if it happened, the United States’ attack on Syria would
year there was a global crisis and Indonesia was one of the make crude oil prices go even higher. If this happens, we
countries affected by the crisis. The data used in this study are can be sure that the holes for the deficit in the trade balance,
secondary data obtained from Bank Indonesia publications current account, and Indonesia’s budget will be even wider
through www.bi.go.id, the Indonesia Stock Exchange, and (Jatmiko, 2013). The rupiah exchange rate closed this year’s
Yahoo Finance (finance.yahoo.com). Following the type trading position by occupying the lowest depreciation
of data used, the research steps include the unit root test, position in the Asian region, correcting 10.15% to a level
cointegration test, and estimation using VECM. In a situation of Rp13,788 per US dollar year-to-date. The strengthening
where all variables contain unit roots but are co-integrated, of the dollar was due to lower oil prices and many other
the Vector Error Correction Model (VECM) model can be commodities (Sukirno, 2015). This condition was much
used (Rosadi, 2012, p. 216). different from the conditions in 2018, even though the rupiahMuhamad YUNANTO, Henny MEDYAWATI / Journal of Asian Finance, Economics and Business Vol 8 No 6 (2021) 0651–0660 655
at that time had almost reached IDR15 thousand/US dollar. Quotations) started on February 8, 1971. NASDAQ is a
Inflation is currently under control at the level of 3.2%. The stock exchange that accommodates small, medium, and
reference interest rate, although experiencing an increase, large-scale companies. The NASDAQ index during the
is still at 5.5% and the domestic economy is still growing study period tended to increase. This can be seen in Figure 1.
at around 5%. Besides, Bank Indonesia’s foreign exchange Toward the end of 2016, the Wall Street stock market
reserves amounted to US$117.93 billion, or about five times ended in the negative zone by the close of trading, in late
higher than during the crisis, which was only around US$18 2016. IT-based stocks weighed heavily on the Wall Street
billion. The rupiah exchange rate in 2019 was recorded to stock market in the United States. Analysts pointed out that
strengthen at the level of Rp14,146 against the US dollar, an trading volume declined due to factors leading up to the
appreciation of 3.9%. According to the Minister of Finance, holiday and many investors shifted funds from the capital
the rupiah exchange rate tends to strengthen in 2019 and market to bonds after a long stock market rally following
there is an increase in the supply of money in circulation, so the sentiment of the presidential election in the USA.
the rupiah exchange rate will improve or strengthen in 2019. Analysts also criticized the behavior of investors when
The exchange rate appreciation reached 3.9% at the end of the stock market plunged in January 2016 on a sentiment
this period because it was driven by an increase in foreign related to China’s slowing economic growth. However,
currency supply (Anggraeni, 2020). the majority of the stock indexes recovered and rallied,
During the study period, the SBI interest rate fluctuated ending higher this year. The weakening US stock market
quite sharply. The SBI interest rate with a tenor of 1 month went up the country’s stock market strengthening this year
had reached 70%/year during the monetary crisis in 1998. The along with most of the markets that have been maintained
prices of goods surged and the occurrence of riots in almost since Republicans won the US election. This has sparked
all regions of Indonesia triggered inflation of more than hopes for a higher growth policy from the newly elected
70%, causing interest rates to soar. The domestic economy president’s government. The Hang Seng Index represents
experienced a contraction (negative growth) of more than the Hong Kong’s stock market fluctuated quite sharply (see
13%, causing the rupiah exchange rate to depreciate to above Figure 1). The Hang Seng Index (HSI) is a cumulative index
Rp15,000/United States dollar. In October 2008, the SBI of 38 blue-chip stocks from the Hong Kong Stock Market,
interest rate tended to decline. However, it rose quite sharply which is one of the most trusted stock indexes, which
to 9.50%, but only lasted 3 months and then fell back to used by investors and fund managers to invest. In 2017,
8.25% at the beginning of 2009. In the following 4 months, despite geopolitical turmoil such as the heat of the Korean
interest rates remained at 7.5, i.e., until June 2009. The next Peninsula and the Iran-Saudi Arabia conflict, Asian stock
years, 2010, 2011 rates were stable at 6.5%. For 3 years, exchanges showed an extraordinary performance, when the
namely, till the end of 2013, 2014, 2015 successively, the Hang Seng Index led the market’s rise. Throughout 2017
interest rate increased to 7.5%. until the close of trading in December 2017, the Hang
The next discussion is about the NASDAQ Index. The Seng index recorded an increase of 35.99% per year to date
NASDAQ index was chosen to represent the American (Rahmawati, 2017).
stock exchange because NASDAQ is the first electronic The growth of the Nikkei index showed a relatively
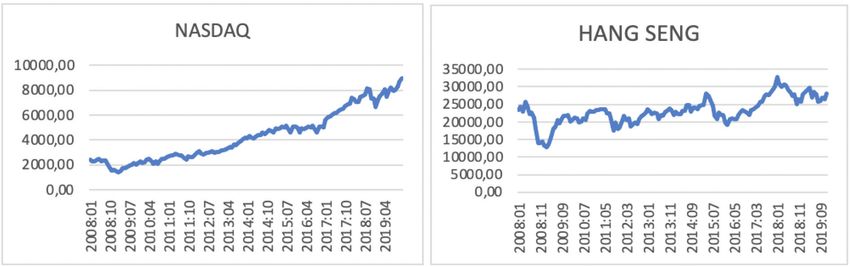
stock exchange in the world. NASDAQ (an abbreviation stable movement between 2009 and 2012 as seen in Figure 2.
for National Association of Securities Dealers Automated From 2012 to 2014 the Nikkei index continued to increase.
Figure 1: The Growth of NASDAQ and HANG SENG Index in Period 2008–2019656 Muhamad YUNANTO, Henny MEDYAWATI / Journal of Asian Finance, Economics and Business Vol 8 No 6 (2021) 0651–0660
Figure 2: The Growth of Nikkei 225 and KOSPI Index in the Period 2008–2019
This shows that investor confidence continued to grow and Table 1: Unit Root Test
the condition of the capital market has been trading actively.
The Nikkei 225 Stock Average has risen in the last two days Variable Level I(0) First Difference I(1)
setting a record break in 15 years. The jump in the index IHSG −0.637225 −10.17935
occurred after the Central Bank of Japan (BoJ) promised
to increase its monetary stimulus. The Nikkei 222 index KURS −0.796974 −11.05200
rose 0.8% to 19,789.81 in the close of trading in Tokyo, the NASDAQ 1.183578 −13.11989
highest since April 2000. Strengthening stocks led by energy HANG SENG −1.879549 −11.90616
companies were triggered by rising crude oil prices to reach
NIKKEI −0.195314 −11.55864
their highest levels this year. Dentsu Inc shares rose by 6.1%
after the company announced increased sales. Kawasaki KOSPI −1.842022 −10.57432
Heavy Industries Ltd shares rose 2.5% after it was reported SBI −2.241568 −4.819805
that the company would experience an increase in fiscal
revenue of up to 16% (Santosa, 2015). (Gosta, 2015). The movement of the Kospi index weakened
The Kospi Index has been down since October 2008, in trading in December 2017. The index is lower by 0.42%
from the previous 1448.06 in September to 1113.06 in or 10.49 points at the level of 2,461.00. After the previous
October. In 2009 March, it climbed back to position trading, the index had closed up 0.30% or 7.49 points at the
1206.26. There are growing signs that the world’s 13th level of 2,471, 49 (Nugroho, 2017).
largest economy, the Republic of Korea, is among the most The VAR model is a regression equation model that uses
vulnerable during the global financial crisis. A senior Bank time-series data. The first step in forming the VAR model is
of Korea (BOK) official declared on December 2 that the to test the stationarity of the data. The result of the unit root
annualized growth for the fourth quarter would be less test shows that all variables in this study have a unit root as
than 3%. The IMF, however, has already slashed its 2009 listed in Table 1.
forecast for South Korea to just 2% and the fear is that it In a situation where all variables contain unit roots,
may enter negative growth next year for the first time but are co-integrated, the Vector Error Correction Model
since the 1997–98 Asian financial crisis. On December (VECM) model can be used (Rosadi, 2012, p. 216). The
1, Samsung Securities predicted that the economy would VECM model is used in the non-structural VAR model
shrink by 0.2 percent in 2009, following in the steps of the that is the time-series data is not stationary at the level,
US, Japan and Europe (Chan, 2008). The KOSPI index was but is stationary in differentiation and cointegration data so
corrected in mid-May 2015 after the Bank of Korea decided that it shows a theoretical relationship between variables.
to maintain its benchmark interest rate. The KOSPI fell With this cointegration, the VECM model, which is a non-
0.65% to 2,106.50 levels, having gained 0.58% to 2,132.53 structural VAR model, is called the restricted VAR model
levels at the opening. The index today is fluctuating in the (Widarjono, 2007). The next stage for data processing
range of 2,104.77–2,134.36. The Central Bank of South is to test whether there is cointegration in the research
Korea used data on the spike in household debt throughout variables. The cointegration test used is the Johansen test,
April 2015 as an excuse to delay monetary easing policy where Johansen statistics can be used to see the amountMuhamad YUNANTO, Henny MEDYAWATI / Journal of Asian Finance, Economics and Business Vol 8 No 6 (2021) 0651–0660 657
of cointegration between variables (Rosadi, 2012, p. 217). According to the data used in this study, namely,
This test can only be done when the data, namely all monthly data, the optimal slowness is 13 months. These
variables in the research model, are integrated to the same results indicate that the exchange rate, SBI, and global
degree (Widarjono, 2007). That is if the combination of two indexes measured through the Nasdaq, Kospi, Nikkei,
series, which is not stationary, moves in the same direction Hang Seng indexes affect the IHSG within 13 months.
towards its long-run equilibrium and the differentiation The next stage is to analyze through impulse response and
between the two series is constant. The results of the variance decomposition. Individually the coefficients in
Johansen cointegration test showed that the trace test the VAR model are difficult to interpret, so econometrics
indicates 1 cointegrating equation at 5%. The test results use impulse response analysis (Widarjono, 2007). Impulse
through the Eviews output show that there are indications response analysis tracks the response of endogenous
of cointegration in the two variables. Based on the results variables in the VAR system due to shocks or changes in
of the unit root test and cointegration test, in this study, the disturbance variable (e). In addition to the impulse
the analysis used the VECM model. In the VAR method, response, the VAR model also provides a forecast error
determining the optimal lag rate is important. This is because analysis of the decomposition of variance or often known
the independent variable used is none other than the lag of as variance decomposition. Variance decomposition is useful
the endogenous variable. In the first stage, the maximum for predicting the percentage contribution to the variance of
indolence length in a stable VAR system is observed by each variable due to changes in certain variables in the VAR
performing repeated estimates starting from the lowest lag, system. The following is the result of the impulse response
which is one, and so on. When the VAR model is estimated (see Figure 3).
with a lag rate of 14, the resulting modulus range is equal Based on Figure 3, it can be seen that the shock from
to or greater than one. Based on these results, the maximum the Hang Seng, Nikkei, and the exchange rate has an impact
lag is 13, which can be produced by a stable VAR system. on ISHG. The shock from the Hang Seng, Nikkei, and
The modulus range values obtained at slowness 13 are exchange rates made the IHSG rise until the second period.
0.245103 to 0.999408. The positive impact was relatively brief, namely, only up to
The next step is to determine the candidates for inaction the second period, then showed a decline and even received
to determine the optimal lag. In this study, the criteria a negative response, i.e., shock by the exchange rate and
selected were based on the AIC statistical value. Eviews Nikkei. In terms of the Hang Seng index, after experiencing
software, which is used as a data processing tool, provides increases in the second period, the third and fourth sharply
recommendations for optimal lags with an asterisk (*) as fell, the 5th period went up again but then fell back in
shown in Table 2. period 6. The shock from the Hang Seng caused the IHSG
Table 2: VAR Lag Order Selection Criteria
Lag LogL LR FPE AIC SC HQ
0 −5374.409 NA 2.13e+27* 82.79091 82.94532* 82.85365*
1 −5330.765 8191663 2.32e+27 82.87331 84.10856 83.37523
2 −5277.900 93.52984 2.19e+27 82.81385 85.12994 83.75496
3 −5252.361 42.43420 3.20e+27 83.17479 86.57172 84.55507
4 −5210.765 64.63487 3.70e+27 83.28869 87.76645 85.10815
5 −5176.245 49.92051 4.86e+27 83.51146 89.07007 85.77011
6 −5131.767 59.53275 5.62e+27 83.58103 90.22047 86.27885
7 −5090.723 50.51519 7.10e+27 83.70343 91.42372 86.84044
8 −5045.261 51.05735 8.75e+27 83.75786 92.55899 87.33405
9 −4982.888 63.33255 8.78e+27 83.55212 93.43409 87.56750
10 −4927.604 50.18066 1.05e+28 83.45545 94.41826 87.91001
11 −4866.689 48.73235 1.27e+28 83.27214 95.31578 88.16587
12 −4766.382 69.44297 9.41e+27 82.48281 95.60729 87.81572
13 −4679.783 50.62739 1.01e+28 81.90435* 96.10968 87.67645658 Muhamad YUNANTO, Henny MEDYAWATI / Journal of Asian Finance, Economics and Business Vol 8 No 6 (2021) 0651–0660
to fluctuate between periods, but did not cause the IHSG to month, all research variables showed a slight decrease in
fall below zero points. The Hang Seng Exchange is one of the percentage compared to the 12th month. The Hang Seng
the best performing exchanges, has led to the rise in Asian Index fell by approximately 0.49%, Kospi fell 0.204%,
markets. As explained in the descriptive analysis, throughout the exchange rate fell 0.28% and the SBI fell by 0.12%.
2017 until the close of trading in December 2017, the Hang However, NASDAQ Index rose 0.4%, the Nikkei was
Seng Index recorded an increase of 35.99% per year to date. up 0.894%. Indonesia is a small open economy where
Shocks from the Nasdaq, Kospi, and SBI caused the IHSG these countries are not the countries that determine world
to fall below zero in the second period. These fluctuations inflation and world economic growth. Indonesia is heavily
were triggered by political conditions in the United States, influenced by other major countries such as the United
as well as the weakening condition of the Kospi index in States and the People’s Republic of China. According to
recent years. Daruri (2019), Indonesia is one of the countries that have
Next, is the analysis of variance decomposition to obtain an orientation to attract investment from the People’s
an overview of the contribution by each variable. Based on Republic of China (PRC).
the analysis of variance decomposition, the results show
that the percentage contribution of the Hang Seng index to 5. Conclusion
the tenth period is relatively the largest compared to other
indexes in this study. The amount of the Hang Seng index’s Based on the results of the impulse response and
contribution is in the range of up to 10,026% to 12.54%. variance decomposition analysis, it can be seen that the
This result is not in line with previous research conducted by overall global index, exchange rates, and SBI interest
Lestari (2014) where Hang Seng index did no effect on the rates contributed to the IHSG movement. Shocks from the
IHSG. The interest rate contributed the least, which was only Hang Seng Index, Nikkei 225, and exchange rates made
in the range of 0.0018% (in period 2 or month 2) to 3.04% the IHSG rise or in other words, the IHSG gave a positive
(on period 12). response to shocks to the Hang Seng index, Nikkei 225,
In the initial period, in month 1, all variables have and exchange rates. On the other hand, shocks from
not contributed to the IHSG movement (see Table 3). Kospi, NASDAQ, and SBI were responded negatively by
However, from the 2nd to the 13th period, every variable IHSG. Based on the analysis of variance decomposition,
contributed to the IHSG movement, especially up to the the percentage value of the contribution of the Hang Seng
4th period, which showed an increase (except for the Hang index is the biggest compared to the Nasdaq, Nikkei 225,
Seng Index). At the end of the period, namely, the 13th and Kospi.
Figure 3: Impulse Response of IHSGMuhamad YUNANTO, Henny MEDYAWATI / Journal of Asian Finance, Economics and Business Vol 8 No 6 (2021) 0651–0660 659
Table 3: Variance Decomposition of IHSG
Period S.E. DIHSG DHASG DNASDAQ DKOSPI DNIKEI DKURS DSBI
1 175.6315 100.0000 0.000000 0.000000 0.000000 0.000000 0.000000 0.000000
2 191.9437 84.89486 0.698643 1.470533 1.821861 0.237247 10.87505 0.001806
3 211.0302 75.13691 11.16623 1.415244 1.966040 0.199143 8.999563 1.116871
4 226.2721 65.84572 10.02627 6.652963 2.039295 1.166141 13.01064 1.258973
5 234.8502 63.27976 12.03241 6.442626 2.336211 1.534593 12.25563 2.118771
6 239.1179 61.99087 11.70991 6.326671 4.314887 1.629554 11.95269 2.075420
7 250.2857 56.58222 10.71837 5.977869 6.370969 6.507439 10.93842 2.904707
8 257.9528 54.45926 12.44501 6.170019 6.418561 7.041573 10.51616 2.949417
9 266.4094 53.56583 12.54079 7.034957 6.017539 7.067957 10.97849 2.794437
10 267.6872 53.62901 12.43002 7.124196 5.971443 7.042251 11.03106 2.772022
11 273.9424 52.52449 12.20277 7.072635 5.715559 9.140438 10.56008 2.784032
12 276.7416 52.32265 12.00111 6.942111 6.288378 9.035050 10.36848 3.042217
13 282.5901 52.08286 11.50986 7.384068 6.085360 9.929223 10.08826 2.920368
References Kusumawati, D. A., & Asandimitra, N. (2017). Impact of global
index, gold price and macro economic ariable for Indonesia
Anggraeni, R. (2020). The rupiah exchange rate has strengthened Composite Index. Research Journal of Finance and Accounting,
throughout 2019, this is the reason. Sindonews. Retrieved from 8(2), 53–62.
https://ekbis.sindonews.com/berita/1489777/33/kurs-rupiah- Larasati, C. A., & Topowijono. (2017). Effect of the inflation
menguat-sepanjang-2019-ini-penyebabnya rate, Bank Indonesia Certificate interest rate, and the United
Daruri, A. D. 2019. Banking supervision for small open economy. States dollar exchange rate on the Composite Stock Price
Investor. Retrieved 16 July, 2020, from https://investor.id/ Index: Studies on the Indonesian Stock Exchange 2010–2015.
opinion/pengawasan-perbankan-untuk-small-open-economy Business Administration Journal, 49(2), 147–156.
Dornbusch, R., & Fischer S. (1980). Exchange rates and current Lee, J. W., & Brahmasrene, T. (2019). Long-run and Short-run
account. American Economic Review, 70(5), 960–971. Causality from Exchange Rates to the Korea Composite
Stock Price Index. Journal of Asian Finance, Economics and
Garefalakis, A. E., Dimitras, A., Koemtzopoulos, D., &
Business, 6(2), 257–267. https://doi.org/10.13106/jafeb.2019.
Spinthiropoulos, K. (2011). Determinant factors of Hong
vol6.no2.257
Kong stock market. SSRN Electronic Journal. https://doi.
org./10.2139/ssrn.1762162 Lestari, D. P. (2014). Effect of exchange rates and the global
stock index on the composite stock price index (IHSG) on the
Gom, H. G. (2013). Analysis of the influence of the Fed rate, the
IDX in the 2008–2013 period (Undergraduate thesis). Faculty
Dow Jones index and the Nikkei 225 Index on the Composite
of Economics, Gunadarma University, Indonesia.
Stock Price Index (IHSG) on the Indonesia Stock Exchange
(BEI) for the 2008–2013 period. Journal of Economics and Murty, U., Anthony P., & Vighnesvaran, R. (2017). Factors
Finance, 1(8), 26–38. affecting Kuala Lumpur Composite Index (KLCI) stock
market return in Malaysia. International Journal of Business
Gosta, D. R. (2015). South Korean Exchange: BoK interest rate
and Management, 12(1), 122–132.
remains KOSPI corrected. Bisnis. Retrieved 18 July, 2020, from
https://market.bisnis.com/read/20150515/7/433541/bursa- Nidar, S. R., & Diwangsa, E. J. (2017). The influence of global stock
korsel-15-mei-suku-bunga-bok-bertahan-kospi-terkoreksi index and the economic indicators of stock investment decision
Haryogo, A. (2013). The effect of the exchange rate and the Dow by foreign investors in the Indonesian Stock Exchange. Journal
Jones index on the composite index on the Indonesia Stock of Finance and Banking Review, 2(1), 32–37.
Exchange. Finesta, 1(1), 1–6. Nezky, M. (2013). The influence of the US economic crisis on
Jatmiko, B. P. (2013). First since 2009, the BI dollar exchange rate the Indonesian Stock Exchange and trade. Economics and
has reached Rp. 11,000. Kompas. Retrieved 17 July, 2020, from Monetary Newsletter, 15(3), 89–103.
https://money.kompas.com/read/2013/09/04/1507102/Pertama. Nguyen, C. H. (2020). The Impact of Foreign Direct Investment,
Sejak.2009.Kurs.Dollar.BI.Tembus.Rp.11.000 Aid and Exports on Economic Growth in Vietnam. Journal660 Muhamad YUNANTO, Henny MEDYAWATI / Journal of Asian Finance, Economics and Business Vol 8 No 6 (2021) 0651–0660
of Asian Finance, Economics and Business, 7(10), 581–589. Santosa, U. A. (2015). Nikkei 225 record highest record in 15 years.
https://doi.org: 10.13106/jafeb.2020.vol7.no10.581 Kontan. Retrieved July 15, 2020, from https://investasi.kontan.
co.id/news/nikkei-225-cetak-rekor-tertinggi-dalam-15-tahun
Nugroho, A. C. (2017). Kospi and Won Compact closed lower.
Retrieved July 15, 2020, from https://market.bisnis.com/read/ Setiawan, S. R. D. (2017). In 2017, IHSG managed to break
20171212/7/717557/kospi-won-kompak-ditutup-melemah the highest record. Kompas. Retrieved 16 July, 2020, from:
https://ekonomi.kompas.com/read/2017/12/26/063253926/
Oktarina, D. (2016). The influence of several global stock indices
catatan-2017-ihsg-berhasil-tembus-rekor-tertinggi-sepanjang-
and macroeconomic indicators on the movement of the JCI.
masa?page=all
Journal of Business and Banking, 5(2), 163–182.
Setiawan, K., & Mulyani, E. (2020). Effect of changes in the
Oktavia, S., & Handayani, W. 2018. Effect of Rupiah Exchange rupiah exchange rate, inflation rate, and international stock
Rate, GDP Growth, and Dow Jones Index on Composite index on the Composite Stock Price Index (IHSG) on the
Stock Price Index in Indonesia Stock Exchange. Journal of Indonesia Stock Exchange (IDX). EcoGen: Majoring in
Accounting and Strategic Finance, 1(1), 23–32. Economic Education, Faculty of Economics, Padang State
Purwono, R., Mucha, K., & Mubin, M. K. (2018). The dynamics of University, 3(1), 7–18.
Indonesia’s current account deficit: Analysis of the impact of Susilo, D., Wahyudi, S., & Pangestuti, I. R. D. (2020). Factors
exchange rate volatility. Journal of Asian Finance, Economics affecting the Indonesia Stock Exchange: A Multi-Index
and Business, 5(2), 25–33. https://doi.org/10.13106/jafeb.2018. approach. International Journal of Financial Research, 11(2),
vol5.no2.25 196–204.
Rahmawati, W. T. (2017). Hang Seng won the 2017 Asian regional Sukirno. (2015). The rupiah exchange rate dropped the most
stock index. Kontan. Retrieved July 15, 2020, from https:// in Asia, during 2015 it was corrected 10.15% to Rp.
investasi.kontan.co.id/news/hang-seng-jawara-indeks-saham- 13,788/USD Retrieved from https://market.bisnis.com/
kawasan-asia-2017 read/20151230/93/505886/kurs-rupiah-paling-jeblok-di-asia-
Roni, M. (2013). Analysis of the Cointegration Relationship and sepanjang-2015-terkoreksi-1015-ke-rp13.788us
Causality and the Dynamic Relationship between Foreign Sunariyah. (2011). Introduction to capital market. Yoyakarta: UPP
Capital Flows, Changes in Exchange Rates and Movement of STIM YKPN.
the JCI in the Indonesian Capital Market 2007–2012. (Master’s
thesis). Master of Accounting, Mercu Buana University. Sutanto, B., Werner, R. M., & Ernawati, E. (2013). Analysis of the
effect of macroeconomics, the Dow Jones index and the Nikkei
Rosadi, D. (2012). Applied econometrics and time series analysis 225 index on the Composite Stock Price Index (IHSG) on the
with EViews, applications for economics, business and finance. IDX for the 2007-2011 period. Calyptra: Student Scientific
Yogyakarta: Andi Offset. Journal Surabaya University, 2(1), 1–9.
Samsul, M. (2006). Capital market and portfolio management. Tandelilin, E. (2010). Portfolio and investment, theory and
Jakarta: Erlangga. application (1st ed). Yogyakarta: KANISIUS.
Sidiq, A. (2010). The effect of the STI, TAIEX, KOSPI, Widodo. (2018). Analysis of the effect of the Asian regional
HANGSENG stock index on the movement of the composite composite stock price index on the Indonesian composite stock
stock price index on the IDX. Management and Accounting price index. Ekbis: Journal of Economics and Business, 1(2),
Research, 1(2), 1–18. 148–164.You can also read