Income and Growth Strategy - Allianz Global Investors | Hong ...
←
→
Page content transcription
If your browser does not render page correctly, please read the page content below

Income and
Growth Strategy
Active is: Positioning the scene for
brilliant opportunities
Adopting a three-sleeve approach with asset classes of high yield
bonds, convertible bonds and equities. Setting in place the dual
opportunities with potential income and growth.
Content
4    Coronavirus and the Economic Outlook

5    A Three-sleeve Approach for Income and Growth

6    High Yield Bonds: A Highly Sought-after Investment Vehicle

8    Why Invest in High Yield Bonds?

11   Risks of High Yield Bonds

12   Convertible Bonds: Combining the Advantages of Bonds and Stocks

13   Why Invest in Convertible Bonds?

16   Risks of Convertible Bonds

17   US Equities: Valuation May Look Compelling

18   Use of Covered Call Options: An Opportunistic Approach to Dampen
     Volatility

20   Allianz Income and Growth (“the Fund”) Q&A

25   About Allianz Global Investors
Income and Growth Strategy
Coronavirus and
the Economic Outlook
The US economy entered unveiled other measures Improved Risk/Reward:
2020 on a solid footing to address liquidity in Given the extreme volatility
only to be disrupted by the the market. Additionally, levels that have recently
outbreak of coronavirus the US government been present in the
(COVID-19). The spread has increased its fiscal markets, the short-term
of the virus and its response substantially. The forecast is challenging.
exponential growth were strong monetary and fiscal However, valuations in
unpredictable, which led policy response under many asset classes are
to a sudden cessation of way should help to revive approaching attractive
global economic activities. global growth in H2 2020. levels. It is difficult to time
The short-term trajectory the market, but investors
of global economies and Extreme Volatility: US with a long-term horizon
corporate profitability markets witnessed one of are now presented with
are highly uncertain the strongest and most potentially attractive risk/
and evolving due to the extreme sell-offs since reward opportunities.
headwinds associated with the global financial crisis
the spread of COVID-19 amidst the outbreak of Hence, it is important
globally. COVID-19. The oil price
for investors to build
war among Russia, Saudi
Strong Policy Response: Arabia and US shale a resilient portfolio
Global central banks added to virus-related by balancing risk and
and governments have volatility. With the Chicago reward. A strategy
announced new and Board Options Exchange with consistent
aggressive stimulus (CBOE) Volatility Index
potential income
measures to help cushion (VIX) approaching a high
the economic fallout. In since 2008, and more distribution, capital
the US, the US Federal uncertainty surrounding growth potential
Reserve (US Fed) has the virus and oil, many and downside risk
taken dramatic steps asset markets have management could
to slash interest rates to experienced dislocations
improve contributions
near-zero, returned to and oversold conditions.
quantitative easing, and to the resilience of a
portfolio.
4Income and Growth Strategy
A Three-sleeve Approach
for Income and Growth
Under the current environment, 1. A steady flow of potential
investors can consider a three- income, including coupons from
sleeve approach investing in high high yield bonds and convertible
yield bonds, convertible bonds bonds, and dividends from
and equities. equities.
Investors could enjoy three 2. Upside potential when the
potential benefits: markets go up
3. Downside risk management
against a declining market
environment.
“Three-sleeve” approach for optimal performance
Equities
Convertible bonds
Potential
Income &
Growth
High yield bonds
There is no guarantee that these investment strategies and processes will be effective under all market conditions and
investors should evaluate their ability to invest for a long-term based on their individual risk profile especially during periods
of downturn in the market.
5Income and Growth Strategy
High Yield Bonds: A Highly
Sought-after Investment Vehicle
What are high yield high yield market, and this asset
class has now become a popular
bonds? investment instrument globally.
As the name implies, high yield
US high yield gross issuance was
bonds are bonds with higher
only USD 220 billion in 1990, but
yields.
by the end of December 2019 it
Credit ratings of high yield bonds was around USD 1.60 trillion1.
are lower than or equivalent to
The US dollar high yield bond
BBB-. For this reason interest
market is the largest. According
rates offered by such bonds are
to the ICE Bank of America (BofA)
usually more attractive than bonds
US High Yield Index, the US
with higher ratings such as US
dollar high yield market makes
Treasuries and investment-grade
up almost 70% of the global high
corporate bonds. The last few
yield market2.
decades have seen much growth
in the breadth and depth of the
Growth of the high yield bond market1
2.0
1.60
Market Size (USD Trillion)
1.5 1.23
1.0
0.65
0.5
0.22
0
1990 2000 2010 2019
Source
1
JP Morgan, as at 31 December 2019.
2
ICE BofA Merrill Lynch, JP Morgan, Bloomberg and Allianz Global Investors; as at 31 December 2019.
6Income and Growth Strategy
The US high yield bond universe
is well diversified. It covers a
wide range of sectors, allowing
investors to allocate across
diversified bond holdings.
Industry diversification by ICE BofA US High Yield Index3
Energy Media Telecom Healthcare Basic Industry
12.5% 10.8% 10.5% 10.4% 10.4%
Capital Services Technology & Leisure Retail Financial
Goods 5.8% Electronics 5.0% 4.7% Services
6.6% 5.1% 4.4%
Consumer Utilities Automotive Real Estate Banks Insurance Transportation
Goods 2.6% 2.0% 1.7% 1.7% 1.1% 1.0%
3.5%
Info Corner: What is bond rating?
Bonds can be divided into two segments, namely, investment grade and non-
investment grade. Investment grade bonds have stronger creditworthiness but
lower yields while non-investment grade bonds are more risky due to weaker
creditworthiness of issuers. Issuers of non-investment grade bonds are more willing
to offer higher interest rates to attract investors and thus they are also known as
high yield bonds. It is worth mentioning that the creditworthiness of high yield
bonds has improved greatly in recent years.
3
ICE Data Services. Weights are based on ICE BofA US High Yield Index. This is for guidance only and
not indicative of future allocation. Diversification does not assure a profit or protect against loss. Data
as at December 2019.
7Income and Growth Strategy
Why Invest in High Yield
Bonds?
1. Potential yields whereas US high yield market
offered a yield of 9.02%1, making
Under current market it a compelling opportunity for
environment, the relative value both international and domestic
proposition of high yield bonds investors. Many investors have
is clear. As of 31 March 2020, the now included high yield bonds
US 10-year Treasury bonds and in their portfolios in order to
US investment grade corporates enhance potential returns and
offered a yield of 0.67% and 3.66% hedge against inflation (inflation
respectively1. US stocks have rate in Hong Kong is running at
delivered dividend yields with the 1.40%2).
S&P 500 Index yielding 2.34%1;
-0.47%1
Potential attractive yields from US high yield bonds
US 10-Year German 10-Year
Treasury Bond
-0.47%1 0.01%1
0.67%1
9.02%1
Japan 10-Year
Bond
US High Yield
2.34%1 Bond
S&P 500
Index
No rt h America
Source
1
Bloomberg, US investment grade corporates represented by ICE BofA US Corporate Index and high yield bond
represented by ICE BofA US High Yield Index, yield represented yield to maturity of the index, data as at 31 March 2020.
2
Bloomberg, data as of 31 January 2020.
8Income and Growth Strategy
2. Proven track record In addition, the US high yield
market has recorded negative
US high yield bonds recorded
returns in only 7 years between
outstanding past performance,
1989 and 2019. With 24 years of
with an average annual return of
positive returns4, it is undoubtedly
7.15%3 and 5.16%3 over the past
the front-runner in the sector,
10 and 5 years respectively.
which should explain why it is
attractive to investors.
Performance of US high yield market in the past 30 years4
Performance (%)
3
Morningstar, high yield bond represented by ICE BofA US High Yield Index, data as of 29 February 2020.
4
Morningstar, ICE BofA Merrill Lynch, Bloomberg, Allianz Global Investors, as at 31 December 2019. High yield bond
performance is measured by ICE BofA US High Yield Index.
9Income and Growth Strategy
3. Fixed income fixed income. US Treasury bonds
are very sensitive to changes in
diversification benefits interest rates. US Treasury bond
Based on the research, high yield prices will normally decline as
bond historically delivered equity- interest rates rise. In contrast, high
like returns, with less volatility yield bonds in general are driven
than stocks. It also provides fixed by fundamentals of the issuers,
income diversification benefits so their correlation with 10-year
given its relatively low correlations US Treasuries is relatively low,
with US Treasuries and other core currently only -0.041.
Correlations between US high yield and other asset classes2
0.62 0.62
0.7 US Small Stocks US Large Stocks
0.58
Non-US Stocks
0.6
0.5
0.23
0.4
Barclays Govt./
0.3 Credit Bond
0.2
0.1
0
-0.1
-0.04
-0.2 10-Year US
Treasuries
Source
1
Barclays, ICE Index, FactSet, Allianz Global Investors, as at 31 December 2019. 10-year Treasuries: ICE BofA US Treasury
Current 10-Year Index.
2
Barclays, ICE Index, FactSet, Allianz Global Investors, as at 31 December 2019. US Small Stocks: Russell 2000 Index;
US Large Stocks: Russell 1000 Index; Non-US Stocks: MSCI EAFE Index; Barclays Government/Credit Bond: Barclays US
Aggregate Bond Index; 10-year US Treasuries: ICE BofA US Treasury Current 10-Year Index.
10Income and Growth Strategy
Risks of High Yield Bonds
1. Default rates remain at 2. Beware of market
low levels fluctuations
The main risk associated with The high yield market could be
high yield bonds is corporate volatile, and investors need to
default, also known as default beware of market fluctuations.
risk. High yield defaults in 2020 The path toward achieving
are expected to remain below positive results is hardly linear,
their long-term historical average. and periods of heightened
Spreads continue to be well volatility should be expected. The
supported by the improved annualized volatility of US high
fundamental backdrop for most yield bonds between 1988 and the
issuers. The current default rate of end of February 2020 amounted
US high yield bonds is 3.35%3 and to 7.93%4, lower than the S&P 500
default rate is even lower for BB Index (14.12%)4 during the same
and B rated bonds. period.
Default rates at low level3
BB B CCC All Speculative Grade Issuers (past 12 months)
BB, B, CCC (%)
All issuers (%)
3
ICE BofA Merrill Lynch, JP Morgan, Allianz Global Investors, as at 31 March 2020. US high yield bonds are represented by
the ICE BofA US High-Yield Index.
4
Morningstar, data from 1 January 1988 to 29 February 2020.
11Income and Growth Strategy
Convertible Bonds: Combining
the Advantages of Bonds and
Stocks
What are convertible may convert the bonds into stocks
bonds? when share price goes up to
capture the upside potential of the
Convertible bonds combine the underlying stock.
features of stocks and bonds,
and they are typically issued by a The coupon rates of convertible
company. bonds are usually lower than
traditional corporate bonds
Similar to other bonds, convertible but are higher than the typical
bonds provide coupon income at dividend yields of stocks.
a fixed rate. Moreover, investors
Info Corner: How do convertible bondholders react to change in
share price?
For example, in December 2014, company ABC issued five-year convertible
bonds with a coupon rate of 3% p.a. and an exercise price of USD 5. Investors may
exercise their right to convert the bonds into shares before December 2019.
Scenario 1: Share price rises Scenario 2: Share price declines
Assuming the share price of company Assuming the share price of company
ABC rises to USD 6, holders of the ABC falls to USD 4, which is lower than
convertible bonds may purchase the the exercise price, the holder may
shares through conversion at a lower continue to hold onto the bonds and
price and make a profit. receive coupon income.
Note: The above examples are for illustration only and does not represent actual results.
Hypothetical example – not representative of any specific convertible. Convertibles involve the risk factors of both stocks and
bonds. They fluctuate in value with the price changes of the underlying stock. If interest rates on the bonds rise, the value
of the corresponding convertible will fall. Investing in convertibles may have to convert the securities before they would
otherwise, which may have an adverse effect on the ability to achieve the investment objective.
12Income and Growth Strategy
Why Invest in Convertible
Bonds?
1. Offensive yet defensive Combining the advantages of
Convertible bonds enjoy the bonds and stocks
advantages of both bonds and
stocks. Most importantly, they offer
Upside
flexibility to investors to cope with potential of
CONVERTIBLES
market volatility. underlying
equity
For instance, when the stock
market is doing well, investors
can convert the bonds into shares
Lower
in order to capture the potential downside
upside. When the stock market is risk from
the bond
doing poorly, investors may hold
the convertible bonds and enjoy a
stream of potential income.
2. Market and investment Issuance of convertible bonds
has been on the rise since 2017.
opportunities continue to Meanwhile, moderate redemption
widen pressure reflects that market
Similar to the US high yield market, development remains healthy.
the size of the US convertible
bond market is also the largest
in the world, offering a variety of
investment opportunities.
13Income and Growth Strategy
The market size of US convertible bonds is projected to grow1
3. Less volatile than As convertible bonds share
stocks; lower interest rate the characteristics of stocks,
they behave more like stocks
risk than US Treasuries irrespective of the interest rates
Historically, convertible bonds cycle.
have exhibited a high correlation Between January 1988 and March
to equities, meaning their price 2020, US government/credit
movements are quite similar to bonds rose in 96 quarters and fell
the stock market. In contrast, the in 33 quarters (by an average of
correlation between convertible 1.2% in each quarter). Convertible
bonds and US Treasuries is bonds managed to go up by an
relatively low, meaning their prices average of 3.0% in each quarter
rarely move in tandem with each when US government / credit
other. bonds fell2.
Source
1
ICE Data Services, BofA. Data as of 31 December 2019. US convertible bonds are represented by the ICE BofA All US
Convertibles Index. Projections are based on assumptions with respect to future events. The actual future events may differ
from the assumptions.
2
FactSet, ICE Data Services, Morningstar. Data as of January 1988 to March 2020. US convertible bonds are represented
by the ICE BofA All US Convertibles Index. US government credit bonds are represented by the Bloomberg Barclays US
Government/Credit Bond Index. Past performance is not a reliable indicator of future results.
14Income and Growth Strategy
Performance of convertible bonds between January 1988 and
March 20202
Participated in much
of the upside of ICE BofA All US Convertibles Index
government / credit Bloomberg Barclays US Government Credit
6 bond market Bond Index
Average Quarterly Return %
4
3.0
2.5
2.2
2
0
-1.2
-2
96 Up Quarters 33 Down Quarters
15Income and Growth Strategy
Risks of Convertible Bonds
Convertible bonds are subject to own. A more practicable way of
risks associated with both stocks investing in convertible bonds is to
and bonds. These bonds can entrust the task to a professional
fluctuate in value when interest management team.
rates rise and/or the price of the
In general, a fund management
underlying stock changes.
team analyses different aspects of
If interest rates rise, values of the investment, such as:
convertible bonds may decline.
• Financial condition
Some of the companies that issue • Valuation
convertible bonds are below • Credit rating
investment grade, which means • Bond spread
these bonds can be more risky
The team decides whether to
than investment-grade issues.
buy a convertible bond only
Convertible bonds are often issued after reviewing the above
by smaller companies and may fundamentals. As market
be more volatile than securities conditions change, holdings are
issued by larger companies. It is adjusted by selling, holding or
worth noting that the convertible converting the bonds into shares.
bonds market is relatively
complicated as it is difficult for
retail investors to access on their
Info Corner: Are convertible bonds subject to limitations?
Many companies issue convertible bonds with a call option that gives them the
right to repurchase the convertible bond from the holder at a specified price
(usually the par value of the bond). This call option can limit the opportunity for
capturing the potential for appreciation of the underlying common stock. On the
other hand, if the bond is structured with a put option, the holder has the right to
sell the bond to the issuer on a specified date. This type of feature can limit risk
should the underlying stock price drop sharply.
16Income and Growth Strategy
US Equities: Valuations May
Look Compelling
1. Earnings growth will 2. Valuations have
be back loaded contracted below the
Short-term corporate profitability long-term average
will be highly uncertain and With the S&P 500 down over 25%
evolving due to the headwinds from the high, the valuations of US
associated with the spread of equities have contracted to a level
the virus globally. Despite near- below their long-term average.
term headwinds, the health The forward 12-month P/E ratio
of the US economy will not for the S&P 500 is 14.0 which is
be fundamentally derailed, below the 5-year (16.7), 10-year
and society will move forward. (15.0), 15-year (14.6) and 20-year
Earnings will rebound once the (15.5) average.1
virus has peaked and this rebound
will most likely happen in the
latter part of the year.
Source
1
FactSet, as at 12 March 2020.
17Income and Growth Strategy
Use of Covered Call Options:
An Opportunistic Approach to
Dampen Volatility
What are covered call how covered calls actually work.
options? • An investor buys 100 shares of
ABC Co. for USD 30 a share,
It is an option strategy that pairs
the total cost being USD
a long position with a short-call
3,000.
option on the same stock in
• The investor at the same time
exchange for an upfront premium
sells a call option of ABC Co.
paid by the buyer.
Exercise price at USD 35.
An option is the right to buy or sell • Option premium: USD 4 per
a stock at a specified price on or contract (one contract per
before a specified date. There are share).
two types of options: call option
and put option. Scenario 1: The investor benefits
from additional cash flow
If investors expect the stock
and appreciation but did not
market remains flat, they may
participate in additional profits*.
sell an option on a stock and use
the premium to cover part of the Scenario 2: The investor benefits
potential volatility. from additional cash flow from
premium and appreciation.
If investors expect the overall
market to be increasingly volatile, Scenario 3: The investor benefits
they may sell an index option to from additional cash flow from
obtain a premium to cover part of premium.
the market drop.
Scenario 4: The investor benefits
from additional cash flow,
Understanding how premium earned is enough to
covered calls actually offset downside.
work Scenario 5: The additional cash
Let's look at a hypothetical flow from premium can only offset
example in order to understand part of the stock depreciation.
Note: The example above and on the next page is for illustration only and does not represent actual results.
* Additional profits = market price - exercise price.
18Income and Growth Strategy
How covered calls work
Scenario 1 Market price of ABC Co.: USD 37 per share; Stock up 23.3%
Strike price less • Gain = USD 400 (premium)
than stock price
• Realized gain of common stock = USD 500
In-the- [(USD 35 - USD 30) x 100 shares]
Money • Net portfolio effect = USD 900
Scenario 2 Market price of ABC Co.: USD 35 per share; Stock up 16.7%
Strike price same • Gain = USD 400 (premium)
as stock price • Realized gain of common stock = USD 500
At-the-
[(USD 35 - USD 30) x 100 shares]
Money • Net portfolio effect = USD 900
Scenario 3
Market price of ABC Co.: USD 30 per share; Stock flat
Strike price greater
than stock price; • Gain = USD 400 (premium)
and stock price
Out- same as • Net portfolio effect = USD 400
of-the- purchase price
Money
Scenario 4 Market price of ABC Co.: USD 27 per share; Stock down 10%
Strike price greater • Gain = USD 400 (premium)
than stock price; • Unrealized depreciation of common stock = USD 300
and stock price
Out- less than [(USD 27 - USD 30) x 100 shares]
of-the- purchase price • Net portfolio effect = USD 100
Money
Scenario 5 Market price of ABC Co.: USD 25 per share; Stock down 16.6%
Strike price greater • Gain = USD 400 (premium)
than stock price;
and stock price
• Unrealized depreciation of common stock = USD 500
Out- less than [(USD 25 - USD 30) x 100 shares]
of-the- purchase price
Money • Net portfolio effect = -USD 100
19Income and Growth Strategy
Allianz Income and Growth
(“the Fund”) Q&A
• The Fund aims at long-term capital growth and income by investing in US and/or Canadian corporate
debt securities and equities.
• The Fund is exposed to significant risks of investment/general market, company-specific,
creditworthiness/credit rating/downgrading, default, currency, valuation, asset allocation, country
and region, emerging market, interest rate, and the adverse impact on RMB share classes due
to currency depreciation. The Fund’s investments focus on US and Canada which may increase
concentration risk.
• The Fund is also exposed to risks relating to securities lending transactions, repurchase agreements
and reverse repurchase agreements.
• The Fund may invest in high-yield (non-investment grade and unrated) investments and
convertible bonds which may subject to higher risks, such as volatility, loss of principal and interest,
creditworthiness and downgrading, default, interest rate, general market and liquidity risks and
therefore may adversely impact the net asset value of the Fund. Convertibles will be exposed to
prepayment risk, equity movement and greater volatility than straight bond investments.
• The Fund may invest in financial derivative instruments ("FDI") which may expose to higher leverage,
counterparty, liquidity, valuation, volatility, market and over the counter transaction risks. The Fund’s
net derivative exposure may be up to 50% of the Fund’s net asset value.
• This investment may involve risks that could result in loss of part or entire amount of investors’
investment.
• In making investment decisions, investors should not rely solely on this material.
Note: Dividend payments may, at the sole discretion of the Investment Manager, be made out of the
Fund’s capital or effectively out of the Fund’s capital which represents a return or withdrawal of part
of the amount investors originally invested and/or capital gains attributable to the original investment.
This may result in an immediate decrease in the NAV per share and the capital of the Fund available for
investment in the future and capital growth may be reduced, in particular for hedged share classes for
which the distribution amount and NAV of any hedged share classes (HSC) may be adversely affected
by differences in the interests rates of the reference currency of the HSC and the base currency of
the Fund. Monthly dividend payments are applicable for Class AM Dis (monthly distribution) and for
reference only but not guaranteed. Positive distribution yield does not imply positive return. For details,
please refer to the Fund’s distribution policy disclosed in the offering documents.
20Income and Growth Strategy
What is the impact of COVID-19 to the
US economy/markets and how has the
outlook for 2020 changed as a result?
Is this affecting the Fund?
The short-term trajectories of global economies and corporate
profitability are highly uncertain and evolving due to the
headwinds associated with the spread of COVID-19 globally.
In response to this uncertainty, global central banks have
announced new and aggressive stimulus measures. The US
Federal Reserve (US Fed) has taken dramatic steps to slash
interest rates to near-zero, returned to quantitative easing,
and unveiled other measures to insulate the economy against
coronavirus fallout. Additionally, governments worldwide are
considering emergency fiscal stimulus action to help cushion
the economic fallout and prevent the spread of the virus.
The situation continues to move very rapidly and requires
close monitoring. Despite the near-term headwinds, we
remain constructive on the intermediate-term outlook. US
equity valuations have come in dramatically with the market
correction. The forward 12-month P/E ratio for the S&P 500
Index now resides around the 5-year average. In addition, the
convertible market has seen continued strong new issuance.
This could provide balanced convertible opportunities and
also improve sector diversification. High-yield spreads have
widened near the upper end of the trailing 3-year range while
default rate expectations remain unchanged.
During this period of volatility, the Fund performed as expected,
mitigating downside risks due to its exposure to US high-yield
1
bonds and convertibles, which have defensive characteristics
that help buffer downside participation when US equities come
under pressure.
21Income and Growth Strategy
Is this the first time the Fund has
experienced challenging market
environments?
No, the Fund has experienced multiple periods of volatility since
inception. The most recent drawdown of the Fund happened
in Q4 2018 when equity markets corrected, and the previous
drawdown happened in 2014-2016 when the convertible and
high yield markets experienced volatility.
In Q4 2018, US stocks turned in their worst fourth-quarter
performance since 2008. Investors lost confidence in the staying
power of earnings and the stability of the economy, fearing
that trade wars and the US Fed might be making a monetary
policy mistake. The S&P 500 Index lost 13.52%1 for the quarter,
of which 9.03%1 came in December alone, its biggest monthly
loss since February 2009. That being said, there was no change
in overall fundamentals to substantiate the sharp sell-off.
The other drawdown happened in mid-2014, when high-yield
bonds entered a bear market which lasted into February 2016.
In 2015, convertible bonds declined 3%2 with the underlying
equity falling 7%2. Equities were range-bound from Q4 2014
to Q3 2016 (between 1,800 and 2,100 on the S&P 500)2. In
addition, option income was limited because equity implied
volatility was depressed and stayed in a narrow range for
extended periods of time, spiking only briefly.
For each of the drawdown periods, the volatility of the Fund,
which adopts a “three-sleeve” approach, was much smaller
than that of the broad market as measured by the S&P 500
and the downside capture ranged from 54% to 96% of the S&P
500.
2
Despite these headwinds, there were opportunities for the
Fund to take advantage of better prices/valuations, potential
attractive yields and wider spreads.
Source
1
Morningstar, as of 31 December 2018.
2
Bloomberg. Convertible bond refers to ICE BofA US Convertible Index;
Underlying equity refers the constituents in the convertible bond index.
22Income and Growth Strategy
Why may investors consider the Fund?
The Fund complements both core fixed income and equity
allocations. Income generation remains a top priority for
investors. However, low interest rates and low-yielding
investment opportunities may not provide enough income to
meet their long-term objectives. Furthermore, most investors
understand that an allocation to equities is crucial to pursuing
their financial goals. Yet, concerns about stock market volatility
have left them uncomfortable with equity-only strategies,
which may present more downside risk than they are willing to
accept.
US high yield bonds, convertible bonds and US large-cap
equities offer compelling investment opportunities. The Fund
adopts a “three-sleeve” approach, aiming to provide potential
income while participating in the upside potential.
In light of the market sell-off, high yield bond spreads ended
the quarter at 877 basis points and the average price of the
market fell to 85.8 cents on the dollar.1 The backdrop offers an
attractive opportunity for long-term investors. Meanwhile, US
equity valuations have come in sharply and reside below their
long-term average. More convertible bonds are approaching
their bond floors. Today the downside risk is much more
contained because of this dynamic and balance sheet strength.
Almost any portfolio could benefit from the many advantages
that income can provide, from lowering volatility to contributing
to potential total return. The bottom line for investors is that
they must not allow short-term market uncertainty to derail
their long-term goals. Investors would be wise to “re-risk”
3
their portfolios and consider a range of income-generating
strategies that have historically held up well during down
markets, offering both stock-like potential returns and helping
to moderate volatility.
Source
1
Bloomberg, as of 31 March 2020.
23Income and Growth Strategy
How does the Fund meet its potential
monthly distribution?
The distribution share classes of the Fund aim to generate
income potential through steady monthly distributions (aims for
regular distribution, yields are not guaranteed, dividends may
be paid out from capital)Note. These distributions predominantly
4
come from the several potential sources of income in the Fund,
namely, high yield coupons, convertible bond coupons, equity
dividends and potential capital gains from the three sleeves.
Distribution may comprise both income and/or realized gains
and will vary depending on market conditions.
What are the difference between total
return and distribution (yield)?
The Fund aims to earn a potential regular income for investors.
However, investors who focus exclusively on distribution yield
must also consider total return, which is the combination of
yield and the return provided by the underlying asset classes.
A typical bond fund generally distributes its earned coupon
income; while the Fund generates its payout from multiple
sources of potential income, including coupons, dividends,
and capital gains. When a fund distributes income, the fund’s
NAV will drop by the equivalent amount in price but the total
5
return remained unchanged. The difference in distributions
also made up the total return. Besides income distribution, the
fluctuations in underlying asset class can have varying degrees
of impact on return. Hence, investors should not confuse yield
with total return.
24Income and Growth Strategy
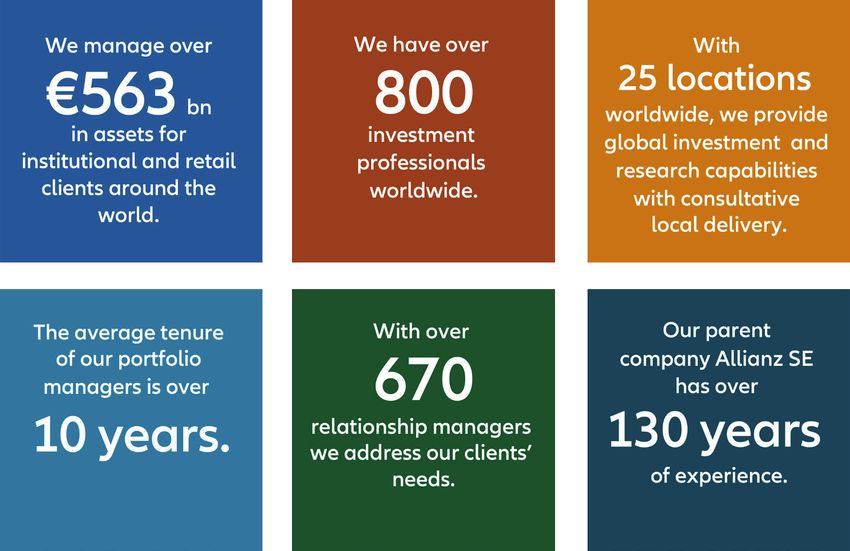
About Allianz Global Investors
Allianz Global Investors is a Active is how we create and share
leading active asset manager with value with clients. We believe in
over 800 investment professionals solving, not selling, and in adding
in 25 offices worldwide and value beyond pure economic
managing more than EUR 563 gain. We invest for the long
billion in assets for individuals, term, employing our innovative
families and institutions. investment expertise and global
resources. Our goal is to ensure a
Active is the most important word
superior experience for our clients,
in our vocabulary.
wherever they are based and
whatever their investment needs.
Source
Allianz Global Investors, as at 31 December 2019.
251151219/2020 HK
Active
Activeisis::Allianz
AllianzGlobal
GlobalInvestors
Investors
Connect with Us hk.allianzgi.com +852 2238 8000 Search more Allianz Global Investors
Like us on Facebook 安聯投資 –香港 Connect on Linkedln Allianz Global Investors
Subscribe to YouTube channel 安聯投資
All data are sourced from Allianz Global Investors dated 31 March 2020 unless otherwise stated.
Information herein is based on sources we believe to be accurate and reliable as at the date it was made. We reserve
the right to revise any information herein at any time without notice. No offer or solicitation to buy or sell securities, nor
investment advice or recommendation is made herein. In making investment decisions, investors should not rely solely on this
material but should seek independent professional advice.
There is no guarantee that these investment strategies and processes will be effective under all market conditions and
investors should evaluate their ability to invest for a long-term based on their individual risk profile especially during periods
of downturn in the market.
Investing in fixed income instruments (if applicable) may expose investors to various risks, including but not limited to
creditworthiness, interest rate, liquidity and restricted flexibility risks. Changes to the economic environment and market
conditions may affect these risks, resulting in an adverse effect to the value of the investment. During periods of rising
nominal interest rates, the values of fixed income instruments (including short positions with respect to fixed income
instruments) are generally expected to decline. Conversely, during periods of declining interest rates, the values are
generally expected to rise. Liquidity risk may possibly delay or prevent account withdrawals or redemptions.
Investment involves risks, in particular, risks associated with investment in emerging and less developed markets. Past
performance is not indicative of future performance. Investors should read the offering documents for further details,
including the risk factors, before investing. This material has not been reviewed by the Securities and Futures Commission of
Hong Kong. Issued by Allianz Global Investors Asia Pacific Limited.
Allianz Global Investors Asia Pacific Limited (27/F, ICBC Tower, 3 Garden Road, Central, Hong Kong) is the Hong Kong
Representative and is regulated by the Securities and Futures Commission of Hong Kong (35/F, Cheung Kong Center, 2
Queen’s Road Central, Hong Kong).You can also read