ECONOMIC AND STEEL MARKET OUTLOOK 2018-2019 - FIRST QUARTER, 2018
←
→
Page content transcription
If your browser does not render page correctly, please read the page content below

ECONOMIC AND STEEL MARKET
OUTLOOK 2018-2019
FIRST QUARTER, 2018
6 FEBRUARY 2018

                  EUROFER AISBL • Avenue de Cortenbergh, 172 • B-1000 Brussels • Belgium
                  +32 3 738 79 20 • mail@eurofer.be • www.eurofer.eu • EU Transparency Register: ID 93038071152-83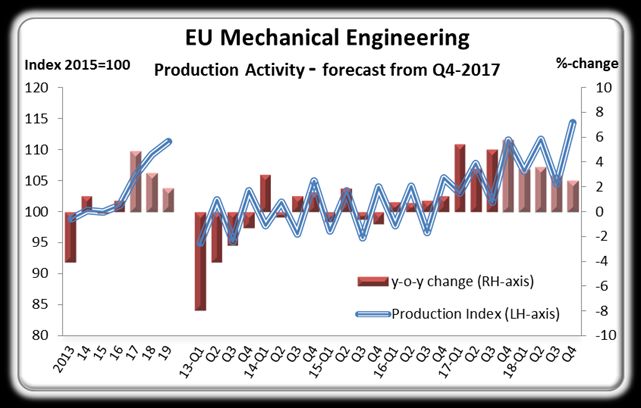
ECONOMIC AND STEEL MARKET OUTLOOK 2018-2019

    ECONOMIC AND STEEL MARKET OUTLOOK 2018-2019
    INTRODUCTION
    In 2017 the EU manufacturing industry and construction sector benefited from an investment-led
    domestic upturn and improving exports. A healthy outlook for these steel users bodes well for EU
    steel demand in 2018 and 2019. The supply side situation could, however, continue to be
    negatively affected by import distortions.

    EU steel market overview
    EU28 apparent steel consumption grew by 1.1% year-on-year in the third quarter of 2017. Domestic
    deliveries rose by 4.4% year-on-year. By contrast, the second quarter had been characterised by a
    contraction in domestic deliveries from EU suppliers due to a sharp increase in third country
    imports.
    Imports grew by around 8% year-on-year over the first half of 2017, but the trend turned negative
    in the third quarter. Total steel imports fell by almost 14% year-on-year.
    This decline has occurred in the context of improving in global steel prices – largely driven by the
    Chinese market – which narrowed the gap between EU domestic prices and imports. Other
    restraining factors include the tempering of imports, particularly from China, but also other
    countries affected by the imposition of anti-dumping and anti-subsidy measures by the European
    Commission. However, other third country suppliers have increased exports to the EU,
    substituting for this drop.
    Similar market conditions are expected to have shaped the supply-demand situation in the fourth
    quarter of 2017.
    Overall, apparent steel demand in the EU28 is estimated to have risen by 1.9% in 2017.
    Prospects for the continued recovery of EU steel demand are positive. The expected strength of
    most steel-using sectors bodes well for the demand side of the EU steel market. The supply side
    situation could, however, continue to be negatively affected by import distortions.

    EU steel-using sectors
    2017 has been a strongly expansionary year for steel-using sectors in the EU. The performance
    across countries and steel-using sectors became increasingly synchronised over 2017. In
    particular, growth dynamics in Central Europe improved significantly compared with the overall
    rather weak momentum of 2016.
    Individual sectoral performances are varied. The steel tube sector posted the strongest year-on-
    year jump in production activity, followed by the mechanical engineering sector, electrical
    domestic appliances and construction. As had been anticipated, growth in automotive output
    moderated somewhat.
    The outlook for 2018 and 2019 is positive, although activity in steel-using sectors will settle back
    into a more restrained pace of expansion owing to waning momentum in the tube sector and
    automotive industry. Underlying economic conditions remain conducive to a steady pace of
    expansion in other sectors.
    Output in the EU’s steel-using sectors is forecast to grow by 2.2% in 2018 and by 1.8% in 2019.

2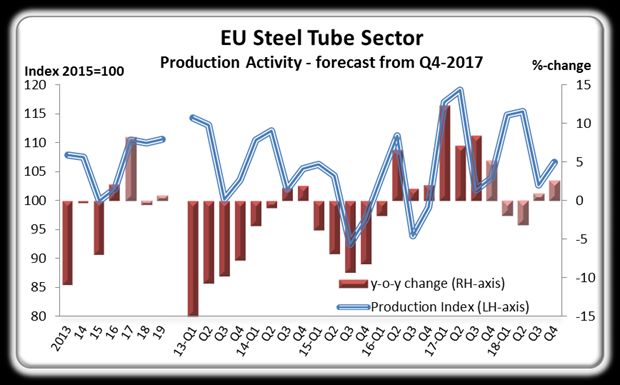
ECONOMIC AND STEEL MARKET OUTLOOK 2018-2019

EU economic context
EU economy remained on a favourable growth track in the second half of last year. GDP growth
was driven by robust investment, solid private consumption and strong exports.
Conditions look right for the EU economy, and it is expected to maintain an above-trend growth
rate in 2018. Economic sentiment in the euro area and EU28 went going from strength to strength
over the course of 2017 and January this year saw continued strength in confidence. Investment is
expected to remain a key driver of growth, reflecting robust domestic and external demand.
Private consumption will also continue to perform well. However, exports may be impacted by
the enduring relative strength of the euro and an expected – though mild – softening in global
trade growth.
The EU economy is forecast to return to a more sustainable growth rate in 2019 as EU monetary
policy tightening may begin to dampen investment growth.
EUROFER forecasts EU GDP growth of 2.2% in 2018 and of 1.9% in 2019.

Table of Contents
Economic and Steel Market Outlook 2018-2019 ................................................................................... 2
  Introduction ........................................................................................................................................ 2
EU Economic Outlook 2018-2019 ........................................................................................................... 4
  GDP growth ........................................................................................................................................ 4
  Confidence indicators ........................................................................................................................ 4
  Investment.......................................................................................................................................... 5
  Growth outlook for 2018 .................................................................................................................... 5
  Growth outlook for 2019 .................................................................................................................... 5
The EU steel market: final use ............................................................................................................... 6
  Outlook for steel-using sectors ......................................................................................................... 6
  Construction industry......................................................................................................................... 6
  Automotive industry .......................................................................................................................... 7
  Mechanical engineering ..................................................................................................................... 8
  Steel tube industry ............................................................................................................................. 9
  Electrical domestic appliances industry ........................................................................................... 10
  Total steel-using sectors output ....................................................................................................... 11
  Real steel consumption..................................................................................................................... 12
The EU steel market: supply ................................................................................................................. 14
  Apparent steel consumption ............................................................................................................ 14
  Imports............................................................................................................................................... 15
  Exports ...............................................................................................................................................16
Glossary of terms................................................................................................................................... 18
  Sector definitions according to NACE Rev.2 .................................................................................... 18
  EU steel market definitions .............................................................................................................. 18
About the European Steel Association (EUROFER) ........................................................................... 20
About the European steel industry ..................................................................................................... 20

                                                                                                                                                              3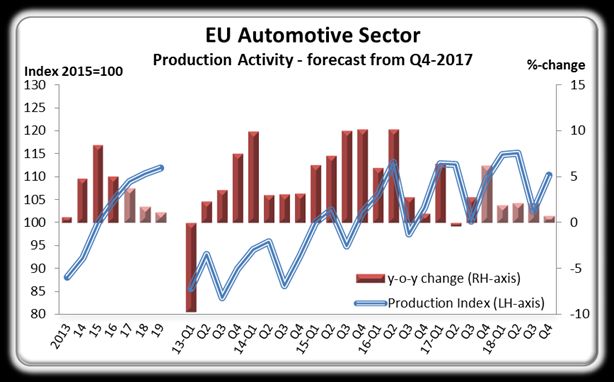
EU ECONOMIC OUTLOOK 2018-2019

    EU ECONOMIC OUTLOOK 2018-2019
    GDP GROWTH
    As suggested by very positive survey data, the EU economy remained on a favourable growth
    track in the second half of last year. Economic performance was boosted by strong sentiment
    levels across all economic sectors, tailwinds from faster global growth, improving labour market
    conditions, sustained low interest rates and easy access to finance.
    As a consequence, GDP growth was driven by robust investment, solid private consumption and
    strong exports. The GDP breakdown by country shows that the growth pattern across EU
    member states has become even more synchronised over the past few quarters.
    The current estimate for EU28 GDP growth in 2017 is 2.4%.

    CONFIDENCE INDICATORS
    Economic sentiment in the euro area and EU28 has been going from strength to strength over the
    course of 2017. The monthly business and consumer survey conducted by the European
    Commission revealed new record levels in December. Industrial confidence continued the rally
    that began in late 2016. January 2018 data show most indicators remaining very close to the
    December peak level.

    In January 2018 the IHS Markit surveys on the assessment of activity in manufacturing and the
    services sector registered their highest readings for nearly twelve years.

    While earlier in 2017 hard data on industrial production had been lagging the more positive trend
    in surveys, that gap had been closing steadily over the later months of 2017. Production growth in
    the EU28 manufacturing industry was 3.1% year-on-year over the first eleven months of 2017 and
    even rose to an average monthly growth rate of almost 4% year-on-year in the second half.

    IHS Markit surveys signal record output growth in several EU manufacturing sectors, such as
    general machinery and equipment, technology equipment and in motor vehicles and automotive
    parts.

4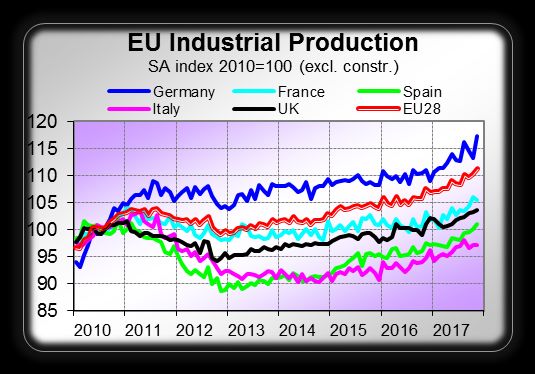
EU ECONOMIC OUTLOOK 2018-2019

INVESTMENT
The fact that industrial activity has been has
been enjoying a healthy growth spell in 2017
                                                               Economic indicators
reflects the welcome boost from an
                                                               Year-on-year change in %
investment-led upturn in the advanced
economies and a recovery in the emerging          EUROFER         2016    2017     2018   2019
economies in general, and in the commodity        Forecast                (e)      (f)    (f)
exporting countries in particular.
EU investment is estimated to have                GDP             1.9     2.4      2.2    1.9
increased by almost 4% in 2017, in spite of
widely-held fears that political uncertainty in   Private         2.3     21       1.8    1.6
the EU might impact the propensity to invest      consumption
in the business sector.                           Government      1.7     1.0      1.2    1.1
Globally, investment is also increasingly         consumption
taking the baton of economic growth,
thereby bolstering international demand for       Investment      1.7     3.9      3.8    3.0
capital goods.                                    Investment      2.9     3.6      4.0    2.9
                                                  in mach.
                                                  equip.
GROWTH OUTLOOK FOR 2018                         Investment in 0.7    3.7      3.0      2.7
Conditions look right for the EU economy, construction
maintaining an above-trend growth rate in
2018. Investment is expected to remain a key Exports          3.3    5.2      5.0      4.5
driver of growth, reflecting robust domestic Imports          4.3    5.2      5.2      4.5
and external demand. The supply-demand
balance is forecast to shift into the favour of Unemployme 9.3       8.4      7.9      7.4
producers and will have a positive impact on    nt rate
selling prices and margins. Full order books Inflation        0.3    1.7      1.7      1.8
and increasing capacity utilisation rates
across most corporate sectors, and a Industrial               2.2    3.1      2.8      2.0
positive outlook for business conditions set production
the stage for a continuation of the (e) = estimate (f) = forecast
investment wave. Private consumption will
also continue to perform well. Exports however, may be impacted by the ongoing strength of the
euro and an expected mild weakening in global trade growth.

GROWTH OUTLOOK FOR 2019
The EU economy is foreseen to return to a more sustainable growth rate in 2019 as EU monetary
policy tightening may start to dampen investment growth and the boost of pent-up demand for
capital goods may lose some strength. Private consumption growth is also expected to moderate
following a prolonged period of relatively strong growth.
On balance, EUROFER’s Q1-2018 outlook forecasts EU GDP growth at 2.2% in 2018 and at 1.9% in
2019.

                                                                                                 5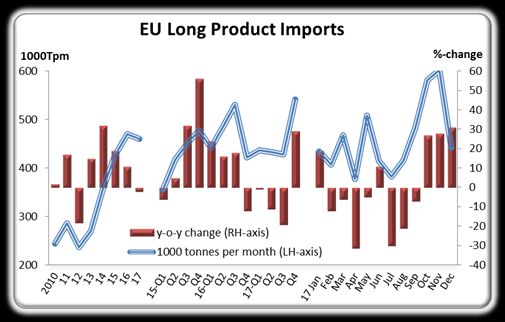
THE EU STEEL MARKET: FINAL USE

     THE EU STEEL MARKET: FINAL USE
     OUTLOOK FOR STEEL-USING SECTORS
     2017 has been a strongly expansionary year for steel-using sectors in the EU. The performance
     across countries and steel-using sectors became increasingly synchronised over 2017.

     CONSTRUCTION INDUSTRY
     EU construction output is estimated to have grown by 4.3% in 2017, the best performance by the
     sector since 2007.

     Construction industry output
     EU construction activity was strong in the third quarter of 2017. Output growth amounted to 4.6%
     year-on-year, more or less the same pace of expansion registered in the first half of the year.
     Business conditions in the EU construction sector have improved markedly in 2017 owing to high
     levels of consumer and business sentiment, easy access to finance and improved budget deficits
     in EU member states have allowed governments to raise investment in public construction works.

     Construction industry growth in 2017
     The recovery of the construction sector has become more evenly distributed across EU countries
     and construction sectors over the course of 2017. Italy remained the weakest construction market
     in the EU and failed to see an
     acceleration in activity growth.
     While in Western Europe the
     residential housing sector remained
     the key driver of construction
     activity     growth,     evidence    is
     becoming stronger that non-
     residential and infrastructure activity
     is also picking up speed.
     Economic growth in most EU
     member states has become more
     investment-led. After the global
     financial crisis, the EU construction
     sector entered a prolonged cyclical
     downturn as investment and confidence collapsed. The Eurozone crisis worsened business
     conditions in the construction sector even further.
     With the EU economy regaining momentum, prospects for construction are brightening. Demand
     for construction that had been unfulfilled during the recession is now being unleashed.
     Construction activity in Central Europe is still largely dominated by infrastructure works,
     supported by EU funds for infrastructure projects and national public investment programmes.
     Activity in the EU construction sector is estimated to have grown by another 3.4% year-on-year in
     the fourth quarter of 2017. On balance, EU construction output is estimated to have grown by
     4.3% in 2017, the best performance of the sector since 2007.

6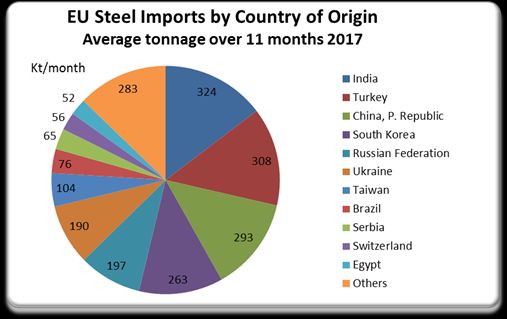
THE EU STEEL MARKET: FINAL USE

Construction industry
forecast 2018-2019
Construction     demand       will
increase further in 2018 and
2019. Housing demand will be
driven by robust levels of
consumer confidence, as well as
the low cost of, and easy access
to, finance. Migrant inflows will
also drive demand for new
housing and services. Pent-up
demand for commercial and
industrial construction dating
back to the financial and
Eurozone crises will support non-residential activity growth.
The improving financial situation of most EU member states will allow for stronger public
investment in construction. However, supply-side bottlenecks in the construction sector such as
capacity restraints and labour shortages may dampen potential output growth in several
countries.
Total EU output is forecast to rise by 2.6% in 2018 and by 2.2% in 2019. Brexit uncertainty is
expected to heavily impact activity in the UK.

AUTOMOTIVE INDUSTRY
The EU automotive sector posted stronger-than-expected growth in 2017.

EU passenger car and commercial vehicle demand
Total EU passenger car registrations grew by 3.4% over the whole year 2017. December sales
showed a negative result, which was basically the result of one working day less in 2017 than in
the preceding year. Car sales grew in all large markets; only the UK registered a negative trend.
Growth was particularly vigorous in the Central European countries.
The growth dynamics of the EU commercial vehicle market slowed further in the fourth quarter
of 2017. Total registrations rose by 3.4% year-on-year over the whole year. Demand in Spain,
France and Germany grew sharply over this period, whereas demand in the UK fell by 4.4% and in
Italy by 2.3%.
EU car exports increased by 2.3% year-on-year in value terms over the first three quarters of 2017;
EU manufacturers exported some 4.2 million passenger cars. The value of EU commercial vehicle
and bus exports increased by 4.3% year-on-year over this period; this growth was largely driven by
the truck segment.

Automotive sector growth in 2017
Activity in the automotive sector grew by 2.8% in the third quarter of 2017, basically the same
average quarterly growth as registered over the first half of the year.

                                                                                                      7
THE EU STEEL MARKET: FINAL USE
Production growth is estimated to have accelerated in the fourth quarter of last year, to 6.2%
year-on-year, reflecting a strong expansion in France, the Netherlands and most Central European
production hubs. As a consequence, growth of total EU production activity - including automotive
parts and components - in 2017 is revised upwards to 3.7%.
Automotive industry forecast 2018-2019
Saturation effects will lead to slowing growth of domestic sales in the EU, in particular in
Germany and France. The UK market is expected to remain stuck in low gear. This is a particular
concern for German OEMS, which together supply around 30% of the UK’s new cars. On balance,
economic fundamentals in the EU market will remain supportive to a further but more moderate
growth of car demand, reflecting strong consumer sentiment, low cost of credit and positive
income effects.
EU commercial vehicle demand growth is also expected to soften further due to saturation
effects
Lower demand from key overseas market will limit exports of vehicles and components. The
current strength of the euro and the continued capacity build-up in third countries is not
supportive to fulfilling export potentials.
Total EU automotive output is forecast to rise by 1.7% in 2018 and by 1.1% in 2019. The UK and
European automotive OEMs are highly integrated and interdependent; Thus, Brexit remains a key
risk to the outlook both in the UK and in the EU.
MECHANICAL ENGINEERING
In 2017 the mechanical engineering sector benefited from a boom in capital expenditure. The
sector posted its best performance since 2011.
Mechanical engineering output
Activity in the EU mechanical engineering industry grew 5% year-on-year in the third quarter of
2017. EU domestic and export demand for machinery and equipment continued to expand
robustly. Production activity improved across all reporting EU member states.
Mechanical engineering growth
in 2017
In 2017 the output of the mechanical
engineering sector benefitted from a
boom in capital expenditure. EU
investment in machinery and
equipment is estimated to have
grown by 3.6%, a clear acceleration
compared with 2016.
Globally, the capex cycle is also
showing improvement, both in the
advanced world as well as in
8THE EU STEEL MARKET: FINAL USE
emerging regions. As a consequence, there is clear evidence of renewed spending on
construction and real estate, as well as of increased investments in extraction, commodity
processing and intermediate goods industries, such as energy and petrochemicals.
Strong order books and a continued positive assessment of production over the short term
underpin the estimate for production growth in the fourth quarter which is currently pencilled in
at 5.8% year-on-year.
All in all, production activity is forecast to have increased by 4.9% over the whole year 2017, the
best performance by this sector since 2011.
Mechanical engineering forecast 2018-2019
Prospects for 2018 remain healthy. EU investment in machinery and equipment is expected to
again post solid growth. Business conditions in the corporate sector have improved significantly,
with rising profits and capacity utilisation providing solid support to demand for this sector's
goods and services. 2017 ended with new, multi-year record levels of sentiment in industry.
Tailwinds from faster global economic growth and low interest rates look set to remain in place in
2018. However, the strength of the euro may start to have a more visible impact on the
Eurozone’s export performance.
EU mechanical engineering activity is forecast to grow by 3.1% in 2018.
Output growth is expected to slacken in 2019 as the boost from pent-up demand in the EU
domestic market loses momentum. Brexit represents a significant risk to both the UK and
continental EU. Another uncertainty is the risk of increasing global protectionism hurting trade
and related investments.
EU mechanical engineering activity is forecast to rise by 1.9% in 2019.
STEEL TUBE INDUSTRY
The steel tube industry saw positive results in the quarters for 2017 for which data is available.
However, this upswing is flattered by low production levels in the corresponding 2016 period.
Steel tube industry output
EU steel tube production activity grew by
8.4% year-on-year in the third quarter of
2017. While this growth was flattered by
relatively low production levels in the
corresponding period of 2016, steel tube
producers benefited from solid order
books. Output growth was particularly
vigorous in Germany and Spain.
Steel tube industry growth in 2017
A key factor contributing to the continued healthy performance of the EU’s steel tube sector is
robust project activity in the international pipeline market and the related order backlog at the
EU’s main large welded tube producers. Another factor has been the improvement in business
9THE EU STEEL MARKET: FINAL USE
conditions in the downstream client sectors of small and medium-sized welded tubes, such as the
construction, mechanical engineering, automotive and other transport equipment, and metal
goods industry. OCTG demand improved incrementally, boosted by growth in the global rig
count.
With favourable business conditions expected to have continued in the fourth quarter of 2017,
production activity in the EU steel tube sector is estimated to have increased by another 5.2%
year-on-year in this period.
On balance, total EU tube output is expected to have risen by 8.3% in 2017, which resulted in the
best annual production volume of total steel tubes in the EU since 2012.
Steel tube industry forecast 2018-2019
In 2018, steel tube production in the EU is forecast to decline moderately as order books for
pipeline construction projects at EU large welded tubes mill dry up. So far there is little evidence
that significant volumes will be opened for tender in 2018. Moreover, legal uncertainty related to
the European Commission’s proposal for new EU anti-monopoly legislation also applies to
offshore pipeline segments on EU territory. This could complicate Russia's plans for gas pipelines
from Russia to Western Europe. As a consequence, the boost from this market is expected to
disappear in 2018 and 2019. Meanwhile, demand for small welded tubes is forecast to continue to
increase, supported by the overall positive business situation in the main downstream client
industries.
Total EU steel tube output is expected to contract by 0.5% in 2018, followed by a 0.7% increase in
production activity in 2019.
ELECTRICAL DOMESTIC APPLIANCES INDUSTRY
The electrical domestic appliances industry’s output grew sharply in the third quarter of 2017.
Electrical domestic appliances output
Production activity in the EU’s electrical domestic appliances sector picked up strength in the
third quarter of 2017. Output grew by 5% year-on-year following rather modest growth in the
second quarter. Output growth was positive in almost all reporting countries in the EU, though it
was disappointing in Italy. Production activity grew rather strongly in the UK.
Electrical domestic appliances
industry growth in 2017
The electrical domestic appliances
market in the EU performed
satisfactorily in the third quarter of
2017. This reflects continued high
levels of consumer confidence, as
well as easing access to, and the
low cost of, finance. This is in
combination with the ongoing
10THE EU STEEL MARKET: FINAL USE
recovery of new housing and residential modernisation activity and the strength of residential
property markets in general. Production activity in the fourth quarter of 2017 is estimated to have
grown by 3.9% year-on-year.
This implies that total production growth over the whole year 2017 amounted to 3.7% and as such
showed a better performance than previously expected.
Electrical domestic appliances industry forecast 2018-2019
Prospects for the European electrical domestic appliances market are relatively healthy. Although
private consumption growth is expected to temper somewhat over the forecast horizon, the
strength of the residential property markets looks set to be maintained.
Both new residential building activity and renovation and maintenance work are expected to
remain on track for solid growth. Nevertheless, the EU appliances market in general, and the
Western European market in particular, is characterised as mature due to the high penetration
and long replacement cycles of electrical domestic appliances. Market dynamics will be positively
affected by rising demand for smart features in household appliances as interest in connectivity-
enabled smart devices that can be connected to the end-user's smartphone and monitored
remotely is increasing.
At the same time, competition remains fierce, with market players from Asia and Eastern Europe
increasingly gaining market share as consumers become more familiar with brands such as Haier,
Hisense, and Gorenje. The level of competition is expected to intensify during the forecast period
with the entry of several new players, possibly resulting in price wars, and mergers and
acquisitions.
Production activity in the EU is forecast to rise by 2.7% in 2018 and by 2.6% in 2019.
TOTAL STEEL-USING SECTORS OUTPUT
Production activity in EU steel-using sectors again grew fairly strongly in the third quarter of 2017.
Total output rose by 4.6% year-on-year, the same quarterly pace of expansion as registered on
average over the first two quarters of 2017.
Year-on-year %-change EU Steel Weighted Industrial Production (SWIP) index
% share Q117 Q217 Q317 Q417 Year Q118 Q218 Q318 Q418 Year Year
in total 2017 2018 2019
Consumption
Construction 35 5.0 4.1 4.6 3.4 4.3 2.3 2.3 2.8 3.0 2.6 2.2
Mechanical 14 5.4 3.5 5.0 5.8 4.9 3.4 3.6 2.9 2.5 3.1 1.9
engineering
Automotive 18 6.4 -0.4 2.8 6.2 3.7 1.9 2.1 2.1 0.7 1.7 1.1
Domestic 3 4.6 1.4 5.0 3.9 3.7 2.9 3.4 1.4 2.9 2.7 2.6
appliances
Other Transport 2 6.4 0.0 -0.8 3.3 2.3 1.6 3.5 3.3 3.1 2.8 2.9
Tubes 13 12.3 7.1 8.4 5.2 8.3 -1.9 -3.1 0.9 2.6 -0.5 0.7
Metal goods 14 6.1 3.0 5.0 6.2 5.0 3.0 3.5 2.9 2.2 2.9 2.3
Miscellaneous 2 4.4 0.8 3.8 2.6 2.9 1.2 2.8 2.5 1.4 2.0 3.0
TOTAL 100 6.4 3.0 4.6 4.9 4.7 1.9 2.1 2.5 2.3 2.2 1.8
11THE EU STEEL MARKET: FINAL USE
Total steel-using sector growth in 2017
The performance across countries and
steel using sectors had already become
more synchronised over the first half of
2017. This tendency strengthened even
further in the third quarter. Growth
dynamics in Central Europe have
particularly improved compared with
overall rather weak momentum in 2016.
As far as individual sectoral
performances are concerned, the steel
tube sector again posted strongest year-
on-year jump in production activity,
followed by the mechanical engineering, electrical domestic appliances and construction sectors.
As expected, growth in automotive output soothed somewhat.
Fairly similar trends are expected to have shaped the fourth quarter performance of steel-using
sectors in the EU.
Total output in 2017 is forecast to have risen by 4.7%, the strongest annual growth since 2011.
Total steel-using sector forecast 2018-2019
The outlook for 2018 and 2019 is positive, although activity in steel using sectors will settle back
into a more moderate pace of expansion owing to waning momentum in the tube sector and
automotive industry. Underlying economic conditions remain supportive to a steady pace of
expansion in the other sectors.
Output in EU steel-using sectors is forecast to grow by 2.2% in 2018 and by 1.8% in 2019.
REAL STEEL CONSUMPTION
Real steel consumption growth dynamics in the third quarter of 2017 were solid.
EU real steel consumption grew by 3.5% year-on-year in the third quarter of 2017, on a par with the
robust growth of production activity of the main steel using sectors in the EU.
Over the first three quarters of last year, end-user consumption of steel products grew by
approximately 4% year-on-year, a rate of expansion which is well aligned with the increase in
activity in the downstream steel using industries over this period.
Real steel consumption growth in 2017
With surveys and incoming figures for the fourth quarter of 2017 pointing to another period of
above-trend growth in the EU economy and no signs of any slowdown of industrial dynamics, it is
estimated that real steel consumption in the final quarter of 2017 increased again by some 4%
year-on-year. This implies that for 2017 total growth in real steel consumption of 4.2% can be
estimated, the best annual growth rate since 2012. This is partially the result of the temporary
growth spurt in the production of steel tubes in the EU.
12THE EU STEEL MARKET: FINAL USE
Real steel consumption forecast 2018-2019
Although economic factors will remain supportive to further growth in real steel consumption in
the EU, the pace of expansion will slow to a more sustainable rate in 2018 and 2019. This is
basically the result of production growth momentum in the tube sector coming to a stand-still
and a further moderation in activity growth of the automotive industry.
EU real steel consumption is forecast to grow by 1.8% in 2018 and by 1.6% in 2019 and as such
continue its gradual, return to higher end-user consumption levels.
Steel intensity will continue to exert a slightly negative influence on real consumption growth.
Forecast for real consumption - % change year-on-year
Period Q1-17 Q2-17 Q3-17 Q4-17 Year Q1-18 Q2-18 Q3-18 Q4-18 Year Year
2017 2018 2019
% change 6.6 2.5 3.5 4.4 4.2 1.6 1.8 2.2 1.5 1.8 1.6
13THE EU STEEL MARKET: SUPPLY
THE EU STEEL MARKET: SUPPLY
The supply-side of the EU steel market analysis factors in stock effects and the impact of
domestic and foreign supply.
APPARENT STEEL CONSUMPTION
Apparent steel consumption concerns the supply of all steel products delivered to the EU28
market by domestic producers in the EU or third country exporters.
Apparent steel consumption in 2017
EU28 apparent steel consumption grew
by 1.1% year-on-year in the third quarter
of 2017. In contrast to the second quarter
which was characterised by a contraction
in domestic deliveries from EU suppliers
due to a sharp increase in third imports,
domestic deliveries rose by 4.4% year-on-
year.
EU domestic and foreign supply
Having grown by around 8% year-on-year
over the first half of 2017, the trend in third country imports turned negative in the third quarter
of last year. Total steel imports fell by almost 14% year-on-year. This has to be seen in a context of
an improvement in global steel prices – largely driven by the Chinese market – which narrowed
the gap with EU domestic prices over imports. Another factor was the weakening of imports from
China and some other countries that had anti-dumping and anti-subsidy measures placed on them
by the European Commission after investigations. However, this also triggered other third
country suppliers to increase exports to the EU.
Fairly similar market conditions are expected to have shaped the supply-demand situation in the
fourth quarter. EU28 apparent steel demand is estimated to have risen by 1.9% in 2017.
Apparent steel consumption forecast 2018-2019
Prospects for a continued recovery in EU steel demand are positive. The expected strength of
most steel using sectors bodes well for the demand side of the EU steel market. The supply side
situation could be negatively affected by import distortions.
EU apparent steel consumption - in million tonnes per year
Year 2009 2010 2011 2012 2013 2014 2015 2016 2017 (f) 2018 (f) 2019 (f)
Million 121 148 158 141 141 146 152 157 160 163 165
tonnes
14THE EU STEEL MARKET: SUPPLY
Forecast for EU apparent steel consumption - % change year-on-year
Period Q117 Q217 Q317 Q417 Year Q118 Q218 Q318 Q418 Year Year
2017 2018 2019
% change 3.8 -0.4 1.1 3.0 1.9 1.0 4.3 1.9 0.5 1.9 1.4
IMPORTS
Following the peak in monthly steel imports –
including semi-finished steel products or
‘semis’ – in May third country imports into the
EU softened somewhat over the June-August
period but resumed a growing trend from
September.
As a consequence total imports over the first
eleven months of 2017 fell by just 1% year-on-
year and remained very close to the 2016
record level. Based on SURV2 data for
December finished steel imports decreased by
the same rate over the whole year 2017.
Imports by country
As far as the main countries of origin are concerned, India and Turkey were, in terms of volume,
the largest steel exporters to the EU in 2017, followed by China, South Korea and Russia. These
five countries represent almost 80% of total finished steel imports into the EU.
Finished product imports from India almost doubled in 2017 and imports from Turkey rose by 65%,
thereby replacing impeded imports from China. Russia. Ukraine and Brazil’s imports into the EU
decreased as these countries faced anti-dumping duties imposed by the EU Commission on
certain products found to have been dumped. Smaller exporters, such as Serbia, Egypt and
Taiwan benefitted from the gap left by the partial withdrawal of the countries that had measures
imposed on them from the EU market, reflecting the continued existence of global excess
capacity looking for outlets.
15THE EU STEEL MARKET: SUPPLY
Imports by product category
The split of total finished imports into flat and long product imports shows that in 2017 flat
product imports stabilised at the 2016 level, whereas long product imports fell by 2% compared
with 2016.
Both flat and long product imports were on a negative year-on-year trend in the second half of
2017. The anti-dumping and anti-subsidy measures imposed by the EU Commission in 2017 had a
positive impact on the overall reduction in imports from third countries. Global steel market
supply and demand also gradually became better balanced owing to improving demand
conditions and production cuts in China.
At the individual product level, imports of hot-rolled coil, quarto plate and tin mill products fell by
16%, 18% and 10% in 2017, respectively. Imports of all other major flat products rose sharply: cold-
rolled sheet imports grew by 21% and hot-dipped galvanised sheet imports increased by 27% over
the whole year 2017. Most long product imports showed a downward tendency. This was
particularly the case with heavy sections and rebar, while wire rod imports rose by 5%.
EXPORTS
Total EU exports of steel products to
third countries rose by 1% year-on-year
over the first eleven months of 2017.
While semis exports more or less
doubled compared with the same
period of 2016, total finished product
exports decreased by 3% year-on-year.
This reflected a 4% rise in flat product
exports and a 15% contraction in long
product exports.
Exports by country
Turkey and North America were the main export destinations for EU flat and long product
exports.
EU rebar producers have been able to book some tonnage from the volume opened up to
exporters by Algeria’s Ministry of Commerce in the final months of 2017. This helped to soften the
overall reduction in EU long product exports, but could not prevent rebar exports from falling by
almost 50% year-on-year over the first eleven months of last year.
16THE EU STEEL MARKET: SUPPLY
The main destination countries for EU flat exports over the first eleven months of 2017 were
Turkey and North America. The main destinations for long product exports were North America,
Algeria and Turkey.
Exports by product category
Finished steel product exports accounted for 92% of total EU exports over the first eleven months
of 2017; the remaining 8% was semis. Flat product exports made up for 65% of total finished
exports and long product exports for the remaining 35%.
Trade balance
The slight reduction in imports and increase in exports resulted in a relative improvement in the
EU’s net trade deficit to an average of 870 kilotonnes per month over the first eleven months of
2017 compared with the 2016 monthly average of 913 kilotonnes.
The trade deficit in semis fell from on average 691 kilotonnes per month in 2016 to 560 KT over
the January-November 2017 period. There was a sharp rise in the deficit in finished products, from
on average 222 kilotonnes per month in 2016 to 310 kilotonnes per month over the first eleven
months of this year.
The deficit for flat products decreased modestly, from on average 550 kilotonnes per month in
2016 to 528 kilotonnes per month, while the trade surplus in long products decreased from an
average of 328 kilotonnes per month in 2016 to 218 kilotonnes over the first eleven months of
2017.
17GLOSSARY OF TERMS
GLOSSARY OF TERMS
SECTOR DEFINITIONS ACCORDING TO NACE REV.2
Building & Civil Engineering
41 Construction of buildings
42 Civil engineering
43 Specialised construction activities
25.1 Manufacture of metal structures and part of structures
25.2 Manufacture of tanks. generators. radiators. boilers
Mechanical Engineering
28 Manufacture of machinery and equipment
27.1 Manufacture of electric motors. generators. transformers
25.3 Manufacture of steam generators. except central heating hot water boilers
Automotive
29 Manufacture of motor vehicles and trailers
Domestic Appliances
27.51 Manufacture of electric domestic appliances
Other Transport Equipment
30 Manufacture of other transport equipment
30.1 Building and repair of ships
30.2 Manufacture of railway locomotives and rolling stock
30.91 Manufacture of motorcycles
Steel Tubes
24.2 Manufacture of steel tubes
Metal Goods
25 Manufacture of fabricated metal products excluding 25.1-25.2-25.3
Other sectors
26 Manufacture of computer. electronic and optical products
27 Manufacture of electric motors. generators. transformers and electricity distribution and
control apparatus excluding 27.1 and 27.5
EU STEEL MARKET DEFINITIONS
SWIP: abbreviation for Steel Weighted Industrial Production index. used as a proxy for real steel
consumption. Activity in the steel using sectors is weighted with the relative share of each sector
in total steel consumed by all sectors.
Real steel consumption: consumption of all steel products used by steel-using sectors in their
production processes, also referred to as “final use” of steel products.
Apparent steel consumption: also referred to as “steel demand”. It concerns the supply of all
steel products delivered to the EU28 market by domestic producers in the EU or third country
exporters. If apparent consumption exceeds real steel consumption, the surplus is stocked in the
distribution chain. If apparent consumption is less than real steel consumption, inventories are
18GLOSSARY OF TERMS
being withdrawn. In formula: total deliveries + imports from third countries – exports to third
countries – steel industry receipts
Steel industry receipts: deliveries for further processing from within the steel industry itself –
subtracted to avoid double-counting of steel consumption
Narrow definition: EUROFER applies the so-called “narrow definition” which excludes steel tubes
and first transformation products from the product scope used for calculating steel consumption.
Hence, the steel tube sector is a steel using sector under this definition
Steel intensity: the ratio of real steel consumption to steel weighted production in the steel using
sectors. This reflects the usually slightly negative impact on consumption of innovation in steel
products, inter-material substitution, improvements in process efficiency and design, etc.
19ABOUT THE EUROPEAN STEEL ASSOCIATION (EUROFER)
ABOUT THE EUROPEAN STEEL ASSOCIATION (EUROFER)
The European Steel Association (EUROFER) AISBL is an international not-for-profit organisation
under Belgian law, based in Brussels.
EUROFER was founded in 1976 and represents the entirety of steel production in the European
Union. EUROFER members are steel companies and national steel federations throughout the EU.
The major steel companies and national steel federations in Switzerland and Turkey are associate
members.
EUROFER is recorded in the EU transparency register: 93038071152-83
ABOUT THE EUROPEAN STEEL INDUSTRY
The European steel industry is a world leader in innovation and environmental sustainability. It
has a turnover of around €170 billion and directly employs 320,000 highly-skilled people,
producing on average 170 million tonnes of steel per year.
More than 500 steel production sites across 22 EU Member States provide direct and indirect
employment to millions more European citizens. Closely integrated with Europe’s manufacturing
and construction industries, steel is the backbone for development, growth and employment in
Europe.
Steel is the most versatile industrial material in the world. The thousands of different grades and
types of steel developed by the industry make the modern world possible. Steel is 100% recyclable
and therefore is a fundamental part of the circular economy. As a basic engineering material, steel
is also an essential factor in the development and deployment of innovative, CO2-mitigating
technologies, improving resource efficiency and fostering sustainable development in Europe.
20You can also read


