HALF YEAR RESULTS PRESENTATION - HALF YEAR ENDED 31 DECEMBER 2018 - Open Briefing

Page created by Christopher Gill
 
CONTINUE READING
HALF YEAR RESULTS PRESENTATION - HALF YEAR ENDED 31 DECEMBER 2018 - Open Briefing
HALF YEAR
RESULTS
PRESENTATION
HALF YEAR ENDED 31 DECEMBER 2018
HALF YEAR RESULTS PRESENTATION - HALF YEAR ENDED 31 DECEMBER 2018 - Open Briefing
DISCLAIMER AND NON-IFRS INFORMATION

  Disclaimer                                                                                      Non-IFRS Financial Information
  The material in this presentation has been       preparation of such statements, actual         carsales' results are reported under
  prepared by carsales.com Limited (ASX:           results may vary in a material manner.         International Financial Reporting
  CAR) ABN 91 074 444 018 (“carsales") and         Information in this presentation, including    Standards (IFRS). This presentation also
  is general background information about          forecast financial information, should not     includes certain non-IFRS measures
  carsales’ activities current as at the date of   be considered advice or a                      including “adjusted”, “underlying”
  this presentation. The information is given      recommendation to investors or potential       “proforma” and “look through”. These
  in summary form and does not purport to          investors in relation to holding, purchasing   measures are used internally by
  be complete. In particular you are               or selling securities. Before acting on any    management to assess the performance
  cautioned not to place undue reliance on         information you should consider the            of our business and our associates, make
  any forward looking statements regarding         appropriateness of the information having      decisions on the allocation of resources
  our belief, intent or expectations with          regard to these matters, any relevant offer    and assess operational management.
  respect to carsales’ businesses, market          document and in particular, you should         Non-IFRS measures have not been subject
  conditions and/or results of operations, as      seek independent financial advice.             to audit or review. All numbers listed as
  although due care has been used in the                                                          reported comply with IFRS.

                                                                                                                                              2
HALF YEAR RESULTS PRESENTATION - HALF YEAR ENDED 31 DECEMBER 2018 - Open Briefing
CONTENTS

           Key Highlights                           4–6

           Reported Group Financial Performance    7 – 12

           carsales Domestic                      13 – 20

           carsales International                 21 – 30

           Outlook                                31 – 32

           Appendix                               33 - 38

                                                            3
HALF YEAR RESULTS PRESENTATION - HALF YEAR ENDED 31 DECEMBER 2018 - Open Briefing
KEY
HIGHLIGHTS
TO 31 DECEMBER 2018

                      4
HALF YEAR RESULTS PRESENTATION - HALF YEAR ENDED 31 DECEMBER 2018 - Open Briefing
H1 FY19 HIGHLIGHTS

                                                                                                            Financial summary
        Reported revenue
                                                                                                            Revenue up 17%, EBITDA up 8% and Adjusted NPAT* down 2% when compared with pcp.
                                                                                                            Excluding the impact of the SK Encar acquisition, revenue was up 3% and EBITDA was

                      Up 17% to $235.0m                                                                     down 7%. Reported NPAT** down 82% on pcp primarily due to impairment of the Group’s
                                                                                                            investment in Stratton.

                                                                                                            Domestic highlights                                                                International highlights
                                                                                                            • Solid revenue growth in Dealer and                                               • Delivering on the international
                                                                                                                 Private advertising segments up 8%                                                 strategy with look through revenue
        Reported EBITDA                                                                                          and 12% respectively.                                                              growth of 79% and EBITDA growth of
                                                                                                                                                                                                    83% on pcp.
                                                                                                            • Ongoing investment in key product
                                                                                                                 initiatives for dealer generating solid                                       • In Korea, good performance from
                      Up 8% to $98.0m                                                                            revenue growth across core leads,                                                   Encar with local currency revenue
                                                                                                                 listing and promote products.                                                       and EBITDA up 20% and 22% on pcp
                                                                                                                                                                                                     respectively.
                                                                                                            • Delivering great outcomes for our
                                                                                                                 private customers with time to sell                                           • In Brazil, the Webmotors business
                                                                                                                 down considerably on pcp and solid                                                  continued its strong recent
                                                                                                                 growth in advertising yield.                                                        trajectory, delivering underlying
                                                                                                                                                                                                     revenue growth of 31% and EBITDA
        Adjusted NPAT*                                                                                      • The adjacent market strategy
                                                                                                                                                                                                     growth of 54% on pcp.
                                                                                                                 continues to be a key driver of
                                                                                                                 growth, with tyresales in particular                                          • Acquired the remaining 16.7% of
                      Down 2% to $60.2m                                                                          displaying good revenue growth.                                                    Chileautos and saw local currency
                                                                                                                                                                                                    revenue growth of 28% on pcp.

* Adjusted NPAT stated above is post non-controlling interests and excludes certain non-recurring or non-cash items relating to financing, investments and acquired intangible amortization. See slide 34 regarding the
disclosure of non-IFRS Information and slide 35-36 for a reconciliation of Adjusted NPAT to Reported NPAT. ** Reported net profit after tax stated above is post non controlling interest.                                               5
HALF YEAR RESULTS PRESENTATION - HALF YEAR ENDED 31 DECEMBER 2018 - Open Briefing
STRONG TRACK RECORD OF FINANCIAL PERFORMANCE

               Revenue ($m)**                                                                             EBITDA ($m)**                                                                              Adjusted NPAT* ($m)**
                                                                    CAGR                                                                                       CAGR                                                                     CAGR
                                                                    12%                                                                                           8%                                                                     7%

                                                                      235.0                                                                                                                                                      61.4    60.2
                                                                                                                                                                  98.0                                                    54.9
                                                        200.5                                                                                      91.0                                                           51.6
                                         178.6                                                                         81.5          83.2                                                           46.7
                           167.3                                                                         72.9
             150.9

           H1 FY15 H1 FY16 H1 FY17 H1 FY18 H1 FY19                                                    H1 FY15 H1 FY16 H1 FY17 H1 FY18 H1 FY19                                                   H1 FY15 H1 FY16 H1 FY17 H1 FY18 H1 FY19

* Adjusted NPAT stated above is post non-controlling interests and excludes certain non-recurring or non-cash items relating to financing, investments and acquired intangible amortization. See slide 34 regarding the
disclosure of non-IFRS Information and slide 35-36 for a reconciliation of Adjusted NPAT to Reported NPAT.
** H1 FY18 revenue, EBITDA and Adjusted NPAT have been restated to reflect the adoption of AASB15. FY15-FY17 figures have not been restated as the impact would not be material.
                                                                                                                                                                                                                                                6
HALF YEAR RESULTS PRESENTATION - HALF YEAR ENDED 31 DECEMBER 2018 - Open Briefing
REPORTED
GROUP FINANCIAL
PERFORMANCE
TO 31 DECEMBER 2018

                      7
HALF YEAR RESULTS PRESENTATION - HALF YEAR ENDED 31 DECEMBER 2018 - Open Briefing
SUMMARY REVENUE & EBITDA PERFORMANCE

    Half Year Ending                                           $A Millions                         Growth                     Revenue
    31 December 2018                                 H1 FY18*             H1 FY19               $'s           %                • Half year revenue of $235.0m, up                   large part reflecting challenging
    Revenue                                                                                                                        17% on pcp. Revenue growth of 3%                 market conditions.
     Online Advertising                                  142.0               146.4              4.4           3%                   excluding the acquisition of SK Encar.
                                                                                                                                                                                  • Excellent result from an international
       Dealer                                            69.2                75.0               5.8           8%
                                                                                                                               • Continued solid performance in the                 perspective, with international look
       Private                                           37.0                41.5               4.5          12%
       Display                                           35.8                29.9              (5.9)        (16%)                  Dealer, Private and Data, Research &             through revenue growth of 79%.
     Data, Research and Services                          20.6                21.8              1.2           6%                   Services segments reflecting                     Reported carsales Asia growth in the
     Finance and Related Services                         32.1                30.9             (1.2)         (4%)
                                                                                                                                   sustained investment in product                  table adjacent reflects consolidation
     carsales Asia                                         1.8                31.3             29.5        1605%
                                                                                                                                   initiatives.                                     of the SK Encar acquisition from
                                                                                                                                                                                    January 2018.
     carsales Latin America                                4.0                 4.6              0.6          16%               • Weaker revenue performance in the
    Total Revenue                                        200.5               235.0             34.5          17%                   Display and Finance segments in a

    EBITDA
     Online Advertising                                   74.2                73.0             (1.2)         (2%)
                                                                                                                               EBITDA
     Data, Research and Services                          11.8                12.6              0.8           6%
     Finance and Related Services                          5.0                 1.4             (3.6)        (72%)             • Overall EBITDA result of $98.0m up                • Strong result from an international
     carsales Asia                                         1.0                14.0             13.0        1345%                   8% on pcp. Excluding SK Encar,                   perspective overall with international
     carsales Latin America                               (1.0)               (3.1)            (2.1)          n/a
                                                                                                                                   EBITDA was 7% lower than pcp.                    look through EBITDA growth of 83%.
                                                                                                                                                                                    This has been driven by excellent
    Total EBITDA                                          91.0                98.0              6.9           8%              • EBITDA performance in the Online
                                                                                                                                                                                    performances in Korea and Brazil.
                                                                                                                                   Advertising and Finance Segments
                                                                                                                                                                                    Reported carsales Asia growth largely
                                                                                                                                   reflected the weaker revenue
                                                                                                                                                                                    SK Encar acquisition related whilst
                                                                                                                                   outcomes in Display and Stratton,
                                                                                                                                                                                    losses in carsales Latin America
                                                                                                                                   offset by continued cost discipline in
                                                                                                                                                                                    reflects the continuing investment in
                                                                                                                                   the core business.
                                                                                                                                                                                    Mexico and Argentina.
                                                                                                                              • Solid performance in the Data,
                                                                                                                                   Research and Services segment.

* H1 FY18 revenue, EBITDA and Adjusted NPAT have been restated to reflect the adoption of AASB15. FY15-FY17 figures have not been restated as the impact would not be material.

                                                                                                                                                                                                                             8
HALF YEAR RESULTS PRESENTATION - HALF YEAR ENDED 31 DECEMBER 2018 - Open Briefing
EBITDA MARGIN PERFORMANCE

                                                                                                                              Core EBITDA margins expanded but were offset by Stratton’s performance
   45.4%              0.1%            (1.4%)                                                                                  and our lower margin / high growth domestic and international investments.

                                                       (1.6%)
                                                                                                                                •    Reported Group margins moved                     on pcp, primarily reflecting an
                                                                          0.2%            (1.0%)                                     from 45.4% in H1 FY18 to 41.7%                   increasing revenue contribution
                                                                                                           41.7%                     in H1 FY19, with domestic core                   from the lower margin tyresales
                                                                                                                                     business margin increases offset                 business.
                                                                                                                                     by a decline in Stratton margins
                                                                                                                                                                                  •   Lower margins in Stratton within
                                                                                                                                     and an increasing contribution
                                                                                                                                                                                      the finance segment have also
                                                                                                                                     from early stage lower margin
                                                                                                                                                                                      been a key contributor to the
                                                                                                                                     businesses.
                                                                                                                                                                                      decrease in overall margins.
                                                                                                                                •    Domestic core business margin
                                                                                                                                                                                  •   carsales Asia had a positive
                                                                                                                                     expansion continues as
                                                                                                                                                                                      impact on overall margins,
                                                                                                                                     operating leverage is being
                                                                                                                                                                                      reflecting the strong profit
                                                                                                                                     achieved. Costs have been well
                                                                                                                                                                                      margins being achieved in Korea.
                                                                                                                                     controlled with core business
                                                                                                                                     margins remaining strong at                  •   carsales Latin America impacted
                                                                                                                                     over 58% in the half.                            Group margins by -1.0%,
  H1 FY18          Domestic    Other    Finance                         carsales         carsales         H1 FY19                                                                     reflecting the impact of losses in
  EBITDA*            Core     Domestic Segment                            Asia            Latin           EBITDA                •    Domestic investments reduced
                   Business Investments                                                  America                                                                                      Argentina and Mexico.
   Margin                                                                                                 Margin                     reported Group margins by 1.4%

* H1 FY18 revenue, EBITDA and Adjusted NPAT have been restated to reflect the adoption of AASB15. FY15-FY17 figures have not been restated as the impact would not be material.

                                                                                                                                                                                                                           9
HALF YEAR RESULTS PRESENTATION - HALF YEAR ENDED 31 DECEMBER 2018 - Open Briefing
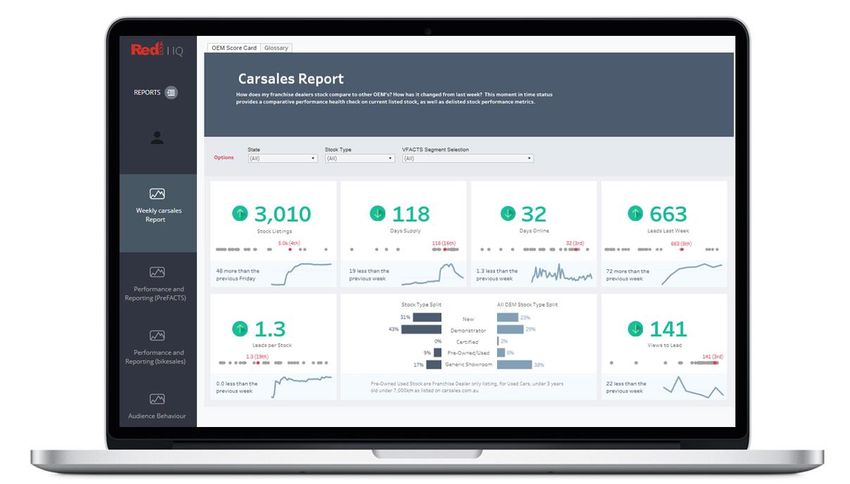
LOOK THROUGH SUMMARY

                             International businesses now contribute more than 20% of look through revenue and 15% of look through
                             EBITDA which will continue to strengthen despite ongoing investment in Argentina and Mexico.

                             International look through revenue and EBITDA grew 79% and 83% respectively in H1 FY19.

                          Look Through Revenue ($m)                                                                                                       Look Through EBITDA ($m)
                                                                                                   CAGR                                                                                                     CAGR
                                                                                                   11%                                                                                                        8%

                                                                                                                                                                                                           100.4
                                                                                                    222.1                                                                                        94.5
                                                                                 194.9                                                                                       81.1       84.5
                                                                                                                                                                                                  8.1       14.8
                                                                  173.3                              44.9                                                  73.5
                                            159.4                                  25.1                                                                                           5.4
                                                                                                                                                                                        5.7
                          146.2
                                                                  20.4                                                                                       4.3
                                              16.5
                           14.0

                                                                                                                                                                                                 86.4       85.6
                                                                                  169.9             177.2                                                                     75.7      78.8
                                             142.9                152.9                                                                                     69.2
                           132.2

                       H1 FY15* H1 FY16* H1 FY17* H1 FY18* H1 FY19                                                                                     H1 FY15* H1 FY16* H1 FY17* H1 FY18* H1 FY19

                             carsales Domestic                        carsales International                                                                 carsales Domestic            carsales International

* H1 FY18 revenue, EBITDA and Adjusted NPAT have been restated to reflect the adoption of AASB15. FY15-FY17 figures have not been restated as the impact would not be material.

                                                                                                                                                                                                                   10
NOTE: Refer to slide 37 for carsales “Look Through” methodology
ADJUSTED NET PROFIT AFTER TAX SUMMARY

Half Year Ending                                                              $A Millions                   Growth                 • The analysis adjacent reflects the                                        • Net finance costs growth reflects
31 December 2018                                                   H1 FY18** H1 FY19                             %                      Adjusted net profit after tax                                               additional interest incurred on
                                                                                                                                        results of the business for H1                                              funding the SK Encar acquisition
Total revenue                                                            200.5               235.0             17%
                                                                                                                                        FY19. Details of the reconciliation                                         from January 2018.
   Total operating expenses                                               109.5               137.0            (25%)
                                                                                                                                        between Adjusted and Reported
EBITDA                                                                    91.0                98.0               8%                                                                                            • Reported profits from associates
                                                                                                                                        results are shown on slides 35-
  EBITDA margin                                                           45.4%               41.7%                                                                                                                 down on pcp reflecting the
                                                                                                                                        36. The proceeding analysis
                                                                                                                                                                                                                    reclassification of SK Encar from
   Depreciation & amortisation                                              5.1                 8.2            (61%)                    focuses on results below EBITDA
                                                                                                                                                                                                                    an associate to a consolidated
EBIT                                                                      85.9                89.8               4%                     after adjustments to better
                                                                                                                                                                                                                    subsidiary from January 2018.
Net finance costs                                                           3.0                 7.0          (131%)                     reflect the underlying trading
                                                                                                                                                                                                                    Strong underlying local currency
                                                                                                                                        performance of the Group.
Profit Before Tax                                                         82.9                82.8             (0%)                                                                                                 NPAT growth of 48% from
Income Tax Expense                                                        24.5                24.5               0%                                                                                                 Webmotors.
Profits from associates                                                     4.7                 1.8            (62%)
                                                                                                                                   • D&A increased by $3.1m                                                    • Non-controlling interests lower
Non-controlling interests (NCI)                                           (1.7)                 0.1             n/a
                                                                                                                                        reflecting acquired underlying                                              than pcp reflecting lower profit
Adjusted NPAT*                                                            61.4                60.2             (2%)                     D&A from SK Encar ($1.1m) as                                                contribution from Stratton.
Adjustments                                                               (0.8)              (49.1)             n/a                     well as the impact of increased
                                                                                                                                                                                                               • Interim dividend of 20.5 cents
Reported net profit after tax                                             60.6                11.1            (82%)                     depreciation of capitalised
                                                                                                                                                                                                                    per share declared.
                                                                                                                                        labour, other growth capex and
                                                                                                                                        intangibles. This investment
                                                                                                                                        supports Group wide integration
                                                                                                                                        and globalisation projects.

* Adjusted NPAT stated above is post non-controlling interests and excludes certain non-recurring or non-cash items relating to financing, investments and acquired intangible amortization. See slide 34 regarding the
disclosure of non-IFRS Information and slide 35-36 for a reconciliation of Adjusted NPAT to Reported NPAT.
** H1 FY18 revenue, EBITDA and Adjusted NPAT have been restated to reflect the adoption of AASB15. FY15-FY17 figures have not been restated as the impact would not be material.                                                                        11
REPORTED DEBT AND CASH FLOW
  Robust balance sheet and credit metrics

                       Pre-tax Operating Cash Flow** (column)                                                                                          Reported Leverage Ratio*
                       and conversion from EBITDA to cash (line)                                                                                       (Net Debt/Annualised EBITDA ***)
            100.0                                                                         90.9          120%
                            66.0                           75.4            73.8                         100%
              80.0                          71.0
                                                                                           93%          80%                                           H1 FY18                                       0.95
              60.0          91%             87%            91%
                                                                           81%
                                                                                                        60%
              40.0
                                                                                                        40%                                           H1 FY19                                                                    2.14
              20.0                                                                                      20%

                0.0                                                                                     0%
                         H1 FY15         H1 FY16        H1 FY17          H1 FY18         H1 FY19
                                                                                                                                                       Net debt*
                 Half Year Ending                                    $A Millions                 Growth
                                                                                                                                                        $A Millions                           Dec-17       Dec-18          %
                 31 December 2018                              H1 FY18 H1 FY19                 $'s         %
                                                                                                                                                        Borrowings                              207.9             504.2   143%
                 Cash Capital expenditure                          3.2            5.9          2.7        84%
                                                                                                                                                        Swaps                                         -           22.9    n/a
                 Capitalised labour costs                          5.6            8.0          2.4        42%
                                                                                                                                                        Cash                                    (32.4)       (108.1)      233%
                 Total capital expenditure                         8.8            13.9         5.1        57%
                                                                                                                                                        Net Debt                                175.5             419.0   139%

             • Cash flow conversion returned to typical                                           • Cash capex increase principally reflects                                           • Leverage ratio increased due to
                  levels in H1 FY19 reflecting improved                                                incremental capex from including SK                                                 incremental debt from the SK Encar
                  debtor collection results following some                                             Encar (c.$2.0m). Capitalised labour costs                                           acquisition but still remains prudent at
                  ERP implementation issues experienced                                                up 42% on pcp reflecting both the                                                   just above 2x EBITDA.
                  in FY18.                                                                             inclusion of SK Encar as well as the
                                                                                                       continued investment in technology
                                                                                                       platforms supporting international and
                                                                                                       adjacent market expansion.

See slide 34 regarding the disclosure of non-IFRS Information | *Net debt includes total borrowings and cross currency interest swaps less total cash as at 31 December 2018 and 31 December 2017 per published
balance sheet. Ratios above are based on reported financial outcomes and may vary with bank covenant definitions. | **Pre-tax operating cash flow is Reported Operating Cash Flow excluding tax. | *** H1 FY18

                                                                                                                                                                                                                                        12
revenue, EBITDA and Adjusted NPAT have been restated to reflect the adoption of AASB15. FY15-FY17 figures have not been restated as the impact would not be material.
CARSALES
DOMESTIC
(AUSTRALIA)
TO 31 DECEMBER 2018

                      13
OUR DOMESTIC BUSINESS STRATEGY

    OUR DOMESTIC STRATEGY
    Grow our core advertising solutions, expand into adjacent markets and develop value driven opportunities for our two key
    customer divisions of Commercial and Consumer.

    OUR CUSTOMERS                                                                STRATEGIC OPPORTUNITIES

                                                                                 Core Digital Advertising Solutions
    Commercial                                                                   Leveraging our sizeable data footprint to drive new
    (Dealer, agency and manufacturer)                                            products that meet the needs of both consumer &
    Addressing the demand for data driven                                        commercial advertisers.
    advertising solutions for our commercial
    customers to sell more cars (or bikes, boats…).                              Adjacent Markets
                                                                                 Expanding our range of services across the
    Consumer                                                                     consumer auto cycle to provide buyers and sellers
    (Membership, consumer classifieds, adjacencies)                              with confidence to transact and enhance our
    Continuing our focus on creating a frictionless                              connection with owners.
    buying, selling and ownership experience for our
    consumers.                                                                   Future horizons
                                                                                 Leveraging consumer insights & industry trends to
                                                                                 explore new opportunities in core and adjacent
                                                                                 markets & beyond.

    Our strategy is focussed on delivering value for our commercial and consumer customers. To better align our reporting
    segments to this strategy, we anticipate changing our reporting segments from a product view to a customer view in H2 FY19.

                                                                                                                                       14
CLEAR LEADER ACROSS ALL METRICS OF REPUTATION,
SITE ENGAGEMENT AND INVENTORY

                  Average Daily Monthly Audience1                                                                                                 Inventory2                                                                      Average Time Spent on Site3

                                                 +61%                                                                                                      +40%                                                                                                   +66%

                                                                                                                                             nearest                  carsales                                                                         nearest           carsales
                                      nearest                 carsales                                                                     competitor                                                                                                competitor
                                    competitor

               Most Preferred Place to Buy & Sell4                                                                      Most Trusted Place to Buy & Sell5                                                                                             Bounce Rate6

                                                                                                                                                                                                                                                       nearest
                                                  +196%                                                                                                  +67%                                                                                        competitor          carsales

                                     nearest                 carsales                                                                      nearest                 carsales                                                                                       -48%
                                   competitor                                                                                            competitor

1. Nielsen Digital Content Ratings, Average Unique Audience, Average July - December 2018. 2. carsales internal data, December 2018. 3. Nielsen Digital Content Ratings, Average Time on Site, Average July - December 2018.
4. Study conducted by independent research agency, Nature Pty Ltd, “market brand health tracker 2018” from July 2018 – December 2018. You said you would go to the following for buying a new / used / selling car.
If you had to choose one tomorrow, which one would you most prefer? 5. Study conducted by independent research agency, Nature Pty Ltd, “market brand health tracker 2018” from July 2018 – December 2018. Thinking about how you see the following                                  15
place/websites/apps, to what extent do you associate each place /website/app with the following statement? 6. Similarweb, Bounce Rate, Average July - December 2018.
DEALER PERFORMANCE SUMMARY

                           Dealer revenue up 8% on pcp to $75.0m
                                                                                                                                                          Growth in regular users of promote products**

                                                                                                      CAGR                                                                                  GROWTH
                                                                                                        9%                                                                                    45%

                                                                                                         $75.0
                                                                                       $69.2
                                                                     $64.6
                                                   $58.8
                                 $53.8

                    ($m)

                              H1 FY15*          H1 FY16*          H1 FY17*          H1 FY18*           H1 FY19                                                                    H1 FY18     H1 FY19

                      Solid growth in core dealer advertising revenue driven by                                                                    Continued to demonstrate growth in the penetration of our
                      an uplift in used car leads volumes, which reflected the                                                                     suite of promote products. As shown above, the number of
                      ongoing strength of the used car market. In addition, yield                                                                  regular users of promote products continues to grow well.
                      improvements and continued increases in depth                                                                                This is testament to both our continued investment in new
                      penetration also had a positive impact on revenue growth                                                                     product initiatives to drive better outcomes for dealers as
                      in the half.                                                                                                                 well as our continued focus on educating dealers about the
                                                                                                                                                   ROI of our products.

* H1 FY18 revenue, EBITDA and Adjusted NPAT have been restated to reflect the adoption of AASB15. FY15-FY17 figures have not been restated as the impact would not be material.
** Source: internal carsales data, reflects increase in regular users of promote products – regular defined as a customer that has made > 20 self service purchases within 6 months.
                                                                                                                                                                                                                 16
PRIVATE PERFORMANCE SUMMARY

                                  Private revenue up 12% on pcp to $41.5m

                                                                                                          CAGR
                                                                                                          18%

                                                                                                              $41.5
                                                                                            $37.0
                                                                          $30.7
                                                        $24.4
                                      $21.2

                         ($m)

                                    H1 FY15*         H1 FY16*          H1 FY17*          H1 FY18*           H1 FY19

       Solid growth in core private advertising                                         Products such as Instant Offer and
       product reflecting the continued                                                 Redbook Inspect continue to evolve with
       optimisation of tiered pricing and an                                            these businesses being positioned for
       increased take up of premium listing                                             further growth. Redbook Inspect has
       solutions for customers.                                                         continued to reduce the reliance on lower
                                                                                        margin rideshare inspections and invest in
                                                                                                                                                                            The Price Indicator product feature provides
                                                                                        capability for future contracts.
       Strong growth in Carfacts as consumers                                                                                                                               consumers with more information and transparency
       look for opportunities to differentiate their                                                                                                                        on the price of cars on our site. It was launched in
       vehicle and provide potential buyers with                                        Good growth from tyresales which                                                    September with a marketing campaign on radio,
                                                                                                                                                                            outdoor and digital channels.
       greater assurance relating to their vehicle’s                                    continues to validate the opportunity that
       history.                                                                         exists with this adjacent market over time.

* H1 FY18 revenue, EBITDA and Adjusted NPAT have been restated to reflect the adoption of AASB15. FY15-FY17 figures have not been restated as the impact would not be material.

                                                                                                                                                                                                                                   17
DISPLAY PERFORMANCE SUMMARY

                       Display revenue down 16% to $29.9m

                                                                                              CAGR
                                                                                                                                                                  2019 Key Display Opportunities
                                                                                                -1%

                                                            $34.5             $35.8
                         $30.9            $31.6                                                 $29.9

                                                                                                                                                 NEW CAR                             NATIVE & VIDEO         OEM
           ($m)

                                                                                                                                        Refreshed new car                         Focus on native,      Stronger OEM
                                                                                                                                        offerings that                            audience and video    relationships with
                                                                                                                                        support the needs                         products delivering   solutions tailored
                      H1 FY15*          H1 FY16*          H1 FY17*          H1 FY18*          H1 FY19
                                                                                                                                        of both customers                         new opportunities     to deliver value
                                                                                                                                        & consumers in                            to connect with our   through brand
                                                                                                                                        their new car                             engaged audience.     engagement,
                                                                                                                                        buying experience.                                              enquiries & sales.
        Display advertising revenue down 16% on pcp. The
        performance was impacted by some execution challenges as
        well as a more difficult advertising environment, given the
        current subdued new car market.                                                                                                   Supported by a growing audience as well as investment in capability,
                                                                                                                                                 talent and a strengthened go-to-market proposition
        Automotive brand and F&I advertising remains an attractive
        market in which to operate. There remains significant
        opportunities to grow with the right investments being made in
        product and capability to leverage the continued growth in
        Australia’s largest and most engaged car buying audience.

* H1 FY18 revenue, EBITDA and Adjusted NPAT have been restated to reflect the adoption of AASB15. FY15-FY17 figures have not been restated as the impact would not be material.

                                                                                                                                                                                                                             18
DATA, RESEARCH AND SERVICES PERFORMANCE SUMMARY

                Data, Research and Services revenue up 6% to $21.8m

                                                                                                         CAGR
                                                                                                            9%

                                                                                                           $21.8
                                                                                         $20.6
                                                                       $19.2
                                                     $17.4
                                   $15.2

                      ($m)

                                H1 FY15*          H1 FY16*          H1 FY17*          H1 FY18*           H1 FY19

                                                                                                                                                                          RedBook IQ provides our automotive clients with a
                                                                                                                                                                          cloud-based set of interactive tools, market intelligence
                     Solid pcp revenue growth reflecting continued demand for Data,                                                                                       and insights data about the online performance of
                     Research and Services from OEMs, with the business continuing                                                                                        their vehicles.

                     to draw on its investments in data and analytics to address
                     changing customer needs in an increasingly data driven market
                     place. Our extended warranty product has attracted strong
                     interest since its introduction into the market.

* H1 FY18 revenue, EBITDA and Adjusted NPAT have been restated to reflect the adoption of AASB15. FY15-FY17 figures have not been restated as the impact would not be material.

                                                                                                                                                                                                                                      19
FINANCE AND RELATED SERVICES PERFORMANCE SUMMARY

   Half Year Ending                                                             $A Millions                    Growth      Finance and related services revenue down 4%
   31 December 2018                                                    H1 FY18 H1 FY19                     $'s      %      to $30.9m
      Core Finance                                                          23.2                 19.6      (3.6)   (16%)
      Other products                                                         8.9                 11.3      2.4     28%     Overall core finance contract loan volumes were consistent
                                                                                                                           on a pcp basis.
   Total Revenue                                                            32.1                 30.9      (1.2)   (4%)
      Cost of sales                                                          7.3                  9.9      (2.6)   (36%)   Challenges included a tightening of consumer lending
   Gross Profit                                                             24.8                 21.0      (3.8)   (15%)   conditions, the impact of regulatory changes and a reduction
      Operating Expenses                                                    19.8                 19.6      0.2      1%     in yield per contract. Lower yield is largely a result of lower
                                                                                                                           average amount financed and changes to financier rate
   EBITDA                                                                    5.0                  1.4      (3.6)   (72%)   plans.
      Depreciation & Amortisation                                            0.5                  0.6      (0.1)   (17%)
      Net Interest expense                                                   0.1                  0.1      0.0       -     Operating costs have been well controlled to mitigate the
                                                                                                                           core finance revenue performance with several cost and
      Income Tax expense                                                     1.2                  0.0      (1.2)    n/a    automation initiatives in place moving into H2.
      Non controlling interest (NCI)*                                       (1.9)                (1.5)     0.4     (23%)

   carsales share of Net Profit                                              1.4                 (0.8)     (2.2)   n/a

   KPI
      Gross Margin                                                          77%                  68%
      EBITDA / Gross Profit                                                 20%                   7%
      EBITDA Margin                                                         16%                   5%

                                                                                                                                                                                             20
* Non controlling interest (NCI) includes the impact of intercompany trading between reporting segments.
CARSALES
INTERNATIONAL
TO 31 DECEMBER 2018

                      21
INTERNATIONAL SUMMARY

  Consolidated Entities
                                                                                                    Constant
                                                         $A Millions                   Growth
   International - reported results                                                                 Currency   Summary
                                                     H1 FY18 H1 FY19             $'s        %         (%)**    • Excellent progress in our international expansion strategy
   Revenue                                                                                                       with a significant increase to revenue and EBITDA
       SK Encar                                         n/a          29.3        29.3           -      -         contribution from our international businesses.
       RedBook Asia and New Zealand                     1.8           2.0        0.2        9%        8%       • Continued development of our global technology platform
   carsales Asia                                        1.8          31.3        29.5      1605%     1605%       which will generate significant revenue growth over the
       soloautos                                        0.5           0.9        0.4        93%       73%        coming years, particularly in our earlier stage investments
       Carsales Chile                                   2.3           3.0        0.6        26%       28%
                                                                                                                 in Argentina and Mexico.
       Demotores Argentina                              1.2           0.8        (0.4)     (37%)      15%
                                                                                                               Revenue
   carsales Latin America                               4.0           4.6        0.6        16%       n/a
   Total International revenue                          5.8          35.9        30.1      518%       n/a
                                                                                                               • Strong reported revenue growth, largely reflecting the
                                                                                                                 acquisition of SK Encar. Excellent international look
   EBITDA                                                                                                        through revenue growth of 79%, with good organic growth
       SK Encar                                         n/a          13.0        13.0           -      -         in all international businesses on a constant currency
       RedBook Asia and New Zealand                     1.0           1.0          -        5%        5%         basis.
   carsales Asia                                        1.0          14.0        13.0      1345%     1345%
       soloautos                                       (0.9)         (2.6)       (1.7)      n/a       n/a      EBITDA
       Carsales Chile                                   0.7           0.8        0.1        20%       2%
                                                                                                               • Excellent international look through EBITDA growth of
       Demotores Argentina                             (0.8)         (1.3)       (0.5)      n/a       n/a        83%, reflecting growth in our three largest businesses in
   carsales Latin America                              (1.0)         (3.1)       (2.1)      n/a       n/a        Korea, Brazil and Chile.
   Total International EBITDA                           0.0          10.9        10.9       n/a       n/a      • Highlights were the performances of SK Encar and
                                                                                                                 Webmotors, our two largest international businesses: SK
 Associate Entity                                                                                                Encar’s EBITDA grew 22% on an underlying local currency
                                                                                                                 basis, whilst Webmotors’ EBITDA grew 54% on an
                                                         $A Millions                Growth          Constant
   Webmotors - underlying results*                                                                               underlying local currency basis.
                                                        FY18      FY19            $'s     %         Currency   • Losses incurred in Argentina and Mexico in our aggressive
       Revenue                                          27.0         31.7         4.7       17%       31%        pursuit of clear market leadership.
       EBITDA                                            9.6         13.2         3.6       38%       54%

*Revenue and EBITDA stated is 100% of the revenue and EBITDA for the business.                                                                                                 22
** Reflects growth in local currency, excluding the impact of FX
OUR INTERNATIONAL STRATEGY

Investments are optimised via carsales deploying its strategic, product and technology capabilities

           1.
                               1. Increase sustainable quality audience and traffic through SEO optimisation and brand marketing
  ESTABLISH CLEAR
  MARKET-LEADING               2. Deploy key technology programs to drive optimal consumer and dealer user experience

     POSITION                  3. Aggressive customer acquisition resulting in increased listing volumes
                               4. Pursue local complementary partner integrations e.g. finance, insurance

                               2.
                       MONETISE AND
                                                       1. Educate and articulate value to dealers and drive focus on conversion from lead to sale
                       EXTEND CLEAR
                      MARKET-LEADING                   2. Increase in penetration of key dealer and OEM products

                         POSITION                      3. Regional expansion
                                                       4. Expand profitability via scalable and sustainable revenue growth

                                                          3.
                                                LEVERAGE CLEAR
                                                MARKET-LEADING                   1. Yield growth through premium products that drive ROI for dealers and consumers
                                                   POSITION                      2. Optimise adjacency strategy to drive additional growth
                                                                                 3. Achieve 55%+ core EBITDA margins via scalable and sustainable growth

                                                                                                                                                                     23
CARSALES ASIA – SK ENCAR

            Pro-Forma (100%)*                             H1 FY18            H1 FY19           PCP       Financial commentary:
                                                           KRWb               KRWb              %
            Reported revenue                                   19.9               23.8         20%       • Pleasing EBITDA growth of 22% as operating leverage is being
                                                                                                           achieved.
            Reported EBITDA                                     8.7               10.6         22%
                                                                                                         • Good growth across all key revenue channels of Dealer,
                                                                                                           Private and Display. This revenue growth is pleasing given
                             H1 FY19 Revenue by Category                                                   there has been no price increase on dealer subscriptions
                                                          1%                                               between the comparative periods.
                                                 12%
                                          3%
                                                                                                         • Key revenue growth drivers include the following:

                                                                                                                 • Increased uptake of premium listing dealer products,
                                                                                                                   particularly the “SK Encar guarantee” vehicle
                                                                                                                   inspection service, which has been fuelled by
                                                                            84%
                                                                                                                   geographic expansion into new branches outside of
                                                                                                                   the key major cities.
                                      Dealer        Private       Display     Other
                                                                                                                 • Attaining additional share of media spend from key
                                                                                                                   OEM and finance and insurance clients through a
                       Inventory (000s)                                      Unique Visitors (000s)                more targeted sales approach, as well as pleasing
                                                                                                                   adoption of the new native display mobile advertising
                                                                                         +4%
                                +2%                                                                                product.
                      60.5                61.6                                                  9,423
                                                                              9,052
                                                                                                         • Significant upside remains from selling additional value added
                                                                                                           services, particularly the ‘ SK Encar Guarantee’ service into H2
                                                                                                           and beyond.

                    H1 FY18             H1 FY19                              H1 FY18           H1 FY19

* Revenue and EBITDA is 100% of the revenue and EBITDA of the business

                                                                                                                                                                              24
SK ENCAR’S GROWTH OPPORTUNITY

   Large Market Opportunity                                                                   Australia              South Korea

                    GDP                 Annual cars             Subscribed               Site Visits          CY18 Revenue
                (A$ trillion)            sold (m)              dealers (000s)               (m)                  (A$m)
                                                                                                                                                        Growth Opportunities
                                                                                                                                                        •    Economic / structural. South Korea is the 12th largest
                           2.1                                                                                                                               economy in the world, has a high GDP per capita, a strong
                                                                                       22.6
                                                 5.8
                                                                          11.9
                                                                                                               343
                                                                                                                                                             automotive market and good growth prospects over the next
                1.8
                                        4.2                                                       15.9
                                                                                                                                                             10 years. The automotive dealer market is relatively immature
                                                                                                                                                             from a digital adoption perspective when compared with
                                                                                                                                                             Australia, so the business should benefit from the general
                                                                3.2
                                                                                                                            58
                                                                                                                                                             migration of advertising expenditure towards online sources
                                                                                                                                                             over the next 2-3 years.

                      Macroeconomic indicators                                       Company metrics                                                    •    Yield growth: potential for material yield growth over the next
                                                                                                                                                             2-3 years from a combination of price rises and volume growth
                                                                                                                                                             in promote and inspection services. The revenue and EBITDA
                                                                                                                                                             growth shown adjacent has been achieved without a price rise
                                                                                                                                                             in the last two calendar years.
     Delivering excellent financial returns
                                                                                                                                                        •    Volume growth: good potential to grow listing volumes
                                                                                    EBITDA (KRW $b)                                                          through regional expansion and a maturing online automotive
            Revenue (KRW $b)
                                                       CAGR                                                               CAGR                               sector.
                                                      20%                                                              20%                              •    Display/OEM revenue. Currently only a relatively small
                                                                                                                                                             revenue contributor, but the fastest growing area with
                                                                                                                                                             significant medium to long term upside potential. New mobile
                                                  48                                                                   24
                                                                                                                                                             and native product releases to drive this growth.
                                  41                                                                     21                                             •    Dealer and consumer services: significant opportunity to
                34
                                                                                                                                                             grow the suite of dealer and consumer services being offered,
                                                                                       17                                                                    including pricing analysis and appraisal tools, finance products
                                                                                                                                                             and extended warranty services.

               CY16              CY17            CY18                                CY16              CY17           CY18

Source: GDP: World Bank, Annual car sales: Korea – Korea Automobile Manufacturers Association, Australia – VFACTS and road transport Authority. Site visits internal data
                                                                                                                                                                                                                                25
Note: CY refers to calendar year January to December
CARSALES LATIN AMERICA – WEBMOTORS

     Pro-Forma (100%)                                 H1 FY18               H1 FY19                PCP                                     Financial commentary:
                                                       BRLm                  BRLm                   %
     Underlying revenue*                                   67.5                  88.7              31%                                     • Another outstanding financial performance in H1 FY19 as
                                                                                                                                             Webmotors continues to consolidate its position as the clear
     Underlying EBITDA*                                    24.1                  37.0              54%                                       no.1 automotive vertical classified site in Brazil.

                                                                                                                                           • The key driver of the result was a 26% growth in dealer
                                                                                                                                             revenue, which was supported by both a large increase in
     carsales Share of Earnings (30% owned – equity accounted)                                                                               dealer numbers as well as improved yield per dealership. The
                                                                                                                                             new ‘Cockpit’ platform for dealers has been well received and
                                                        AUDm                  AUDm                   %                                       is a critical component driving this growth.
     Reported NPAT                                          1.6                   2.3              40%
                                                                                                                                           • There has also been significant growth in finance and
     Adjusted NPAT*                                         1.9                   2.6              32%                                       insurance revenue, primarily driven by the integration with
                                                                                                                                             Santander bank, which allows seamless credit assessment,
                                                                                                                                             including approval into Cockpit.

                                                                                                                                           • The business continues to generate good operating leverage,
              Dealer numbers                                           Inventory Volume (000s)                                               expanding EBITDA margins from 36% in H1 FY18 to 42% in H1
                                                                                                                                             FY19.
                         +19%                                                              +38%
                                                                                                                                           • Outstanding growth in key operational metrics of inventory
                                                                                                                                             and dealer numbers being up 19% and 38% respectively on
                                                                                                      436.8
                                    13,343                                                                                                   pcp.
             11,205
                                                                               315.8

            H1 FY18                H1 FY19                                    H1 FY18                H1 FY19

*Revenue and EBITDA stated is 100% of the revenue and EBITDA for the business. The carsales share of earnings is based on owning the percentage set out above. Adjusted NPAT stated above excludes intangible   26
amortisation. See slide 34 regarding the disclosure of non-IFRS Information and slides 35-36 for a reconciliation of Adjusted NPAT to Reported NPAT.
WEBMOTORS’ GROWTH OPPORTUNITY

    Significant Market Opportunity                                                                 Australia            Brazil

                   GDP                 Annual cars               Subscribed              Site Visits            CY18 Revenue
               (A$ trillion)            sold (m)                dealers (000s)              (m)                    (A$m)

                                                                                                                                                                Growth Opportunities
                          2.8
                                                 13.3
                                                                          13.3          22.6      23.0
                                                                                                                 343
                                                                                                                                                                •    Economic. Brazil, the 8th largest economy in the world, is
                                                                                                                                                                     a huge market which is expected to grow strongly over
               1.8
                                                                                                                                                                     the next decade. The growing purchasing power of an
                                                                                                                                                                     emerging middle class should have a positive impact on
                                       4.2                                                                                                                           the automotive market.
                                                                 3.2                                                     73

                                                                                                                                                                •    Competitive position. Webmotors is now the clear
                                                                                                                                                                     number 1 automotive vertical classified site in Brazil,
                     Macroeconomic indicators                                        Company metrics
                                                                                                                                                                     having successfully transitioned to the lead charging
                                                                                                                                                                     model over the last 2 years.
                                                                                                                                                                •    Dealer acquisition. Considerable upside remains as
     Delivering outstanding financial returns                                                                                                                        Webmotors currently only has c.50% dealer penetration,
                                                                                                                                                                     with a total addressable market of c.26k dealers in Brazil.
                                                                                                                          CAGR
                                                         CAGR                                                                                                   •    Commercialising ‘Cockpit’. Cockpit is a comprehensive
            Revenue (BRL $m)                                                     EBITDA (BRL $m)
                                                        25%                                                             65%                                          automotive CRM product recently deployed which has
                                                                                                                                                                     strong customer adoption and use, however it is not yet
                                                                                                                                                                     monetised.
                                                                                                                          65
                                                        158
                                                                                                                                                                •    Diversifying revenue streams. The business currently
                                                                                                                                                                     generates a relatively low proportion of its revenue from
                                                                                                          42                                                         private consumers and OEMs, which is a significant
                                 119
                                                                                                                                                                     growth opportunity over the next 5 years.
             101
                                                                                   24

             CY16               CY17                 CY18                         CY16                   CY17            CY18

Source: GDP: World Bank, Annual car sales: Brazil – Based on new cars legal registration volume and used selling volume . Source: FENABRAVE (National Vehicle Distribution Association), Australia – VFACTS and road
transport Authority. Site visits internal data
                                                                                                                                                                                                                                   27
Note: CY refers to calendar year January to December
CARSALES LATIN AMERICA – CARSALES CHILE

                                  H1 FY18     H1 FY19           PCP    Financial commentary:
                                   CLPm        CLPm              %
                                                                       • Completed the acquisition of the remaining 16.7% of the
 Reported revenue                  1,121            1,434       28%      chileautos business in December 2018.

 Reported EBITDA                    391             401          2%    • Good financial performance in H1 FY19 as the business
                                                                         further strengthened its market leadership position in a
                                                                         buoyant market with new car sales up c.20% on pcp. The
                                                                         Dealer and Private business segments were the key drivers of
                                                                         revenue growth.

        Dealer numbers                      Inventory (000s)           • In Dealer, the business continues to benefit from expansion
                                                                         into regional areas outside of Santiago generating additional
                 +10%                                 +13%               inventory on site. There was also a price rise implemented in
                                                                         May, which has positively impacted yield when compared with
                         966                                  103.3      H1 FY18.
         882
                                             91.5

                                                                       • From a private segment perspective, the business continues
                                                                         the migration from a post-paid to a pre-paid private seller
                                                                         model, which is positively impacting overall yield.

                                                                       • There have been two key recent product releases for dealers:
       H1 FY18          H1 FY19             H1 FY18          H1 FY19     a pricing analysis and appraisal tool as well as a call tracking
                                                                         product. These new products position the business for
                                                                         continued growth in H2 and beyond.

                                                                       • EBITDA margin for the period was impacted by the timing of a
                                                                         significant brand marketing campaign in H1, which was not
                                                                         incurred in the corresponding period last year.

                                                                                                                                            28
CARSALES LATIN AMERICA – DEMOTORES ARGENTINA

                                                                                                                             Commentary
                                                       H1 FY18                H1 FY19                PCP
                                                                                                                          • Strategy in Argentina is to focus on           • Achieving 15% revenue growth was a
                                                       ARS $'000              ARS $'000                %                    establishing demotores as the clear              creditable result in a challenging
                                                                                                                            and dominant market leader from a                market, given that manufacturers
     Reported revenue                                         16,257                18,645            15%                   vertical auto classifieds perspective.           have reduced marketing spend given
                                                                                                                                                                             the decline in new car sales.
     Reported EBITDA                                        (10,547)               (32,940)            n/a                • The progress made in pursuit of this
                                                                                                                            goal in FY18 has continued in the              • Key highlights
                                                                                                                            first half of FY19.
                                                                                                                                                                               • Significant focus on dealer and
                                                                                                                          • The current macroeconomic                            inventory acquisition resulting in
                                                                                                                            environment in Argentina is                          a 38% increase in inventory
                                                                                                                            challenging, with high inflation and a               levels in the last 12 months.
                                                                                                                            reduction in new cars sold of c.45%
                                                                                                                                                                               • 58% growth in lead volumes.
                                                                                                                            in H1 on pcp.

                                                Key metric comparison with our nearest competitor***                                                                            Internal KPI metric comparison

   Monthly Visitors (000’s)*                            Unique Visitors (000’s)*                             Total page views (m)*                   Inventory**                              Leads****

                   +72%                                              +47%                                               +65%                             +18%                                     +58%

                             809.8                                              436                                                                              31.3
                                                                                                                                     3.85
                                                                                                                                                  26.4
                                                          296.9
           471.9                                                                                               2.34

Nearest Competitor        demotores                     Nearest             demotores                Nearest Competitor         demotores   Nearest Competitor demotores                H1 FY18          H1 FY19
                                                       Competitor

*Trafficinformation sourced from Similarweb for December 2018. Total page views equals total visits multiplied by pages per visit.
**Inventory  information as published on competitor site.
***Nearest competitor reflects the nearest vertical automotive classified competitor.

**** Leads reflects dealer, private and finance leads and includes email, calls and clicks to reveal contact details.
                                                                                                                                                                                                                      29
CARSALES LATIN AMERICA – MEXICO

                                                                                                                                Commentary
     Pro-Forma (100%)                                  H1 FY18                H1 FY19                 PCP                  • Significant progress made on our               • Successfully launched finance and
                                                      MXN $'000              MXN $'000                 %                     goal to become the clear and                     insurance integrations with
                                                                                                                             dominant market leader in Mexico.                commercial partners. This has also
     Reported revenue                                            7,378               12,788           73%                                                                     been a key driver of revenue growth
                                                                                                                           • Revenue growth of 73% on pcp
                                                                                                                                                                              in H1.
     Reported EBITDA                                         (12,035)              (28,446)            n/a                   driven by strong growth in display
                                                                                                                             and dealer products. Display growth            • Other key highlights included:
                                                                                                                             reflects improved relationships with
                                                                                                                                                                              o 92% growth in monthly visitors
                                                                                                                             OEMs as well as growth in key
                                                                                                                             website traffic metrics, with a                  o 97% increase in leads on pcp.
                                                                                                                             continued focus on growing high
                                                                                                                             quality sustainable traffic.

                           Key metric comparison with our closest competitor**                                                                                         Internal KPI metric comparison

                                  Soloautos                                                                  Nearest Competitor                           Monthly traffic * (‘000)                   Leads***
                                Page Views (m)*                                                               Page Views (m)*
                                                                                                                                                                     +92%                                +97%
                                          +82%                                                                              -8%

                                                                                                                                                                             1,572

                                                                   7.14                             9.14
                                                                                                                                                  8.39
                                                                                                                           7.80
                                           5.91
                                                                                                                                                            821
                    3.92

                 H1 FY18                 H2 FY18                 H1 FY19                         H1 FY18                H2 FY18                 H1 FY19    H1 FY18          H1 FY19            H1 FY18          H1 FY19

*Traffic information sourced from Similarweb. Total page views equals total visits multiplied by pages per visit. Monthly traffic growth from Dec-18.
**Nearest competitor reflects the nearest vertical automotive classified competitor.
*** Leads reflects dealer, private and finance leads and includes email, calls and clicks to reveal contact details.
                                                                                                                                                                                                                          30
FY19 OUTLOOK

               31
PERFORMANCE OUTLOOK

   We continue to monitor our performance and market conditions in each market in which we operate. Assuming these remain
   consistent, we anticipate revenue, EBITDA and Adjusted NPAT growth will be moderate in the second half of FY19.

   carsales Domestic Outlook                                          carsales International Outlook

   Domestic core business performance in January has remained         In Brazil, we anticipate continued strong local currency revenue
   solid, with the exception of display advertising. Whilst the       and earnings growth in the second half of FY19. In South Korea,
   display segment remains challenging, we are anticipating an        we are expecting continued good local currency revenue and
   improving performance in the second half. We anticipate our        earnings growth in the second half.
   domestic adjacent businesses of tyresales and Redbook Inspect
   will continue to build scale.                                      Integration of core carsales IP and technology into Chilean,
                                                                      Mexican and Argentinian businesses will continue. In Chile we
   As detailed in our market announcement in December, our            expect this to drive a good uplift in local currency revenue and
   Finance and Related Services business continues to be impacted     earnings. In Mexico and Argentina, we expect this to drive good
   by credit tightening as a result of the Financial Services Royal   growth in local currency revenue and key performance metrics.
   Commission and the recent ASIC legislative changes.                We continue to execute on our planned investment in
                                                                      technology, marketing and innovation in these businesses to
                                                                      aggressively pursue market leadership.

                                                                                                                                         32
APPENDIX

           33
OVERVIEW OF CARSALES NON-IFRS FINANCIAL INFORMATION

  What is IFRS and non-IFRS financial                        information presented is sourced directly            presentations in order to allow the reader to
  information?                                               from financial information prepared in               clearly reconcile between the IFRS and non-
                                                             accordance with all relevant accounting              IFRS financial information.
  •   IFRS financial information is financial                standards and has been subject to either
      information that is presented in accordance            review or audit by carsales’ external auditors   Why does carsales disclose non-IFRS
      with all relevant accounting standards.                (PwC).                                           financial information in its half year
                                                                                                              and full year results presentations?
  •   Non-IFRS financial information is financial        •   In carsales’ investor presentations the
      information that is presented other than in            company aims to provide equal or greater
                                                             prominence to IFRS financial information.        •   carsales has invested in businesses in
      accordance with all relevant accounting                                                                     Malaysia, Thailand, Indonesia, South Korea,
      standards. For example:                                However, we also present or refer to non-IFRS
                                                             financial information. Please note, all              Mexico, Chile, Brazil and Argentina and has
                                                             information labelled “Reported” in this              become a global portfolio of online
      o Revenue or profit information calculated                                                                  automotive assets. Accordingly carsales
         on a basis other than under accounting              presentation complies with IFRS.
                                                                                                                  management believes that the presentation
         standard definitions or calculated with                                                                  of additional non-IFRS information in its half
         accounting standards and then adjusted          •   Non-IFRS financial information is calculated
                                                             based on statutory IFRS financial information        year and full year results presentations
         e.g. “adjusted”, “underlying” or “look                                                                   provides readers of these documents with a
         through”.                                           and adjusted to show either a position
                                                             excluding significant items which have been          greater understanding into the way in which
                                                             removed OR presented based on carsales’              management analyses the business as well as
                                                             effective equity ownership interest of an            meaningful insights into the financial
                                                             entity’s underlying revenue, EBITDA or NPAT.         conditions of carsales overall performance.
  What non-IFRS financial information
  does carsales disclose in its half year                •   Any non-IFRS financial information is clearly    •   The Australian Securities and Investment
  and year end results presentations?                        labelled as “underlying” or “look-through” to        Commission (“ASIC”) acknowledges the
                                                             differentiate it from reported/IFRS financial        relevance of non-IFRS financial information in
  •   carsales presents reported financial                   information.                                         providing “meaningful insight” as long as it
      information for its business segments,                                                                      does not mislead the reader.
      associates and investments where applicable        •   carsales provides reconciliations on the face
      IFRS financial information exists. The financial       of slides, appendices and in footnotes of

                                                                                                                                                                   34
RECONCILIATION OF REPORTED TO ADJUSTED NPAT

       Half Year Ending                              $A Millions          Growth
       31 December 2018                         H1 FY18       H1 FY19    $'s   %
       Reported NPAT                              60.6         11.1     (49.5)   (82%)
       Interest Adjustments
         Option Discounting Unwind                  -          0.2
         Option Movement in Fair Value              -          (1.2)
       Investment Adjustments
         Gain on associate dilution               (0.9)        (1.5)
         Goodwill Impairment                        -          47.8
       NPAT before one-off items                  59.7         56.4     (3.3)    (5%)

       Acquired intangible amortisation
         Stratton                                 0.3          0.3
         Webmotors                                0.3          0.3
         SK Encar                                 0.9          2.9
         Chileautos                               0.2          0.2
         Demotores                                  -          0.1
       Total acquired intangible amortisation     1.7          3.8       2.1     122%
       Adjusted NPAT*                             61.4         60.2     (1.2)    (2%)

         Adjusted Earnings per Share (cents)      25.4         24.7     (0.7)    (2%)

                                                                                         35
ADJUSTED FINANCIALS

                      $A Millions                          H1 FY18                             H1 FY19                       Growth %

      Year Ending 31 December 2018            Reported   Adjustments   Adjusted   Reported   Adjustments   Adjusted   Reported    Adjusted

      Revenue
          Online Advertising                   142.0                    142.0      146.4                    146.4       3%          3%

          Data, Research and Services           20.6                     20.6       21.8                     21.8       6%          6%

          carsales Asia                         1.8                      1.8        31.3                     31.3      1605%       1605%
          carsales Latin America                4.0                      4.0        4.6                      4.6        16%         16%

          Finance and Related Services          32.1                     32.1       30.9                     30.9       (4%)        (4%)
      Total revenue                            200.5          -         200.5      235.0          -         235.0       17%         17%

      Total operating expenses                 109.5                    109.5      137.0                    137.0      (25%)       (25%)
      EBITDA                                    91.0          -          91.0       98.0          -          98.0       8%          8%

      EBITDA margin                             45%                      45%        42%                      42%
      Depreciation & amortisation               5.6         (0.5)        5.1        12.5        (4.3)        8.2       (125%)      (61%)
      EBIT                                      85.4         0.5         85.9       85.5         4.3         89.8       0%          4%

      Net financing cost                         3.0          -           3.0        6.0         1.0          7.0      (98%)       (131%)
      Profit Before Tax                         82.4         0.5         82.9       79.5         3.3         82.8       (4%)        (0%)

      Income Tax Expense                        24.5                     24.5       23.7         0.8         24.5       4%          0%
      Profits from associates                   3.5          1.2         4.7        1.5          0.3         1.8       (58%)       (62%)

      Goodwil Impairment                                      -            -       (47.8)       47.8          -          -              -

      Gain on associate investment dilution     1.2         (1.2)          -        2.0         (2.0)         -         59%             -

      Non-controlling interest (NCI)            (2.0)        0.3         (1.7)      (0.4)        0.5         0.1        79%        108%

      Net profit after tax                      60.6         0.8         61.4       11.1        49.1         60.2      (82%)        (2%)

                                                                                                                                             36
CARSALES “LOOK THROUGH” P&L ANALYSIS

                                                                        H1 FY18                                                                                        H1 FY19                                                          Growth
                                                                                                                Look                                                                                           Look                                     Look
                                      % Owned           Days Owned          Reported        Underlying                               % Owned            Days Owned         Reported        Underlying                      Reported % Underlying %
                                                                                                              Through                                                                                        Through                                 Through %
Revenue
carsales International
iCar Asia                               13.3%                 184       Financial Asset*          -               -                    13.1%                 184       Financial Asset*         N/A             N/A            n/a         n/a          n/a
SK Encar                                49.9%                 184        Equity Acc'ted          23.2            11.6                  100%                  184             29.3               29.3            29.3           n/a         26%         153%
WebMotors                                30%                  184        Equity Acc'ted          27.0            8.1                    30%                  184        Equity Acc'ted          31.7            9.5            n/a         17%          17%
RedBook Asia and NZ                     100%                  184             1.8                1.8             1.8                   100%                  184             2.0                2.0             2.0            10%         11%          10%
soloautos                                65%                  184             0.5                0.5             0.3                   100%                  184             0.9                0.9             0.9            74%         80%         171%
chileAutos**                            83.3%                 184             2.3                2.3             2.0                   100%                  184             2.9                2.9             2.5            28%         26%          25%
Demotores                               100%                  184             1.2                1.2             1.2                   100%                  184             0.8                0.8             0.8           -34%        -33%         -37%
Total International                                                             5.8             56.0             25.1                                                         35.9             67.6             44.9         518%         21%          79%

carsales Domestic
Domestic Core Business                  100%                  184             143.9             143.9           143.9                   100%                 184             146.3             146.3           146.3          2%          2%            2%
Domestic Investments *                Various *               184              50.8              54.2            25.9                Various *               184              52.8              54.6            30.9          4%          1%           19%
Total Revenue                                                                 200.5             254.1           194.9                                                        235.0             268.5           222.1          17%         6%           14%

EBITDA
carsales International
iCar Asia                               13.3%                 184       Financial Asset*          -                -                   13.1%                 184       Financial Asset*        N/A              N/A           n/a         n/a           n/a
SK Encar                                49.9%                 184        Equity Acc'ted         10.3              5.1                  100%                  184             13.0              13.0             13.0          n/a         26%          155%
WebMotors                                30%                  184        Equity Acc'ted          9.6              2.9                   30%                  184        Equity Acc'ted         13.2              4.0          n/a         38%           38%
RedBook Asia and NZ                     100%                  184              1.0               1.0              1.0                  100%                  184              1.0               1.0              1.0          5%          0%            0%
soloautos                                65%                  184             (0.9)             (0.9)            (0.6)                 100%                  184             (2.6)             (2.6)            (2.6)        200%        189%          333%
chileAutos**                            83.3%                 184              0.8               0.8              0.6                  100%                  184              0.8               0.8              0.7          4%          0%            17%
Demotores                               100%                  184             (0.9)             (0.9)            (0.9)                 100%                  184             (1.3)             (1.3)            (1.3)         46%         44%           44%
Total International                                                            (0.0)            19.9              8.1                                                         10.9             24.1             14.8          n/a         21%          83%

carsales Domestic
Domestic Core Business                  100%                  184              83.9              83.9            83.9                   100%                 184              85.1              85.1            85.1          1%          1%            1%
Domestic Investments *                Various *               184               7.1             (1.2)             2.5                Various *               184               2.0              0.5              0.5          -72%       -139%         -80%
Total EBITDA                                                                   91.0             102.6            94.5                                                         98.0             109.7           100.4          8%          7%            6%

* Domestic Investments comprises Stratton Finance, RedBook Inspect, tyresales, Ratesetter and Promisepay. | Auto Exchange - remaining 50% of Auto Exchange purchased in August 2018. Restated to show this within
Core Business rather than Domestic Investments for all periods. | ** chileautos was 100% owned for 1 month from Dec-18. Previously 83.3% owned| carsales “Look Through” methodology: For equity accounted
associates and consolidated subsidiaries, add the total revenue or EBITDA for the period of ownership within the reporting period multiplied by the % ownership over the period. Some “Look Through” numbers involve the                                         37
disclosure of non IFRS information - Refer to carsales’ Disclosure of Non IFRS slide 34 for further details.
You can also read