RG Continental Central East - TEN-YEAR NETWORK DEVELOPMENT PLAN (TYNDP) WORKSHOP - entso-e
←
→
Page content transcription
If your browser does not render page correctly, please read the page content below
TEN-YEAR NETWORK DEVELOPMENT PLAN (TYNDP)

  RG Continental Central East
  WORKSHOP

5 December 2011
Prague, Czech Republic

Regional Group Continental Central East

Towards TYNDP and RgIP

…Regardless of how the CCE region and European
energy mixes evolve over the long term, the Transmission
Network will have to be expanded….
AGENDA

  10:00   Registration and welcome coffee
  10:30   Welcome and Introduction                                         Andrew Kasembe
                                                                           Convenor RG CCE

  10:40   General presentation on ENTSO-E, TYNDP, RgIP and their role in   Dimitrios Chaniotis
          the EIP                                                          Manager, ENTSO-E Secretariat
  11:00   Main challenges and specifics for grid development in CCE        Harald Koehler
          region                                                           RG CCE

  11:15   Panel discussion with stakeholder about general expectations     All

  11:45   Coffee break
  12:15   Preliminary results of the CCE Regional Grid Investment Plan -   Zdeněk Hruška
          Market Studies                                                   Convenor subgroup Market Modeling for RG CCE
  12:45   Lunch
  13:45   Preliminary results of the CCE Regional Grid Investment Plan –   Norbert Lechner
          Grid Studies                                                     Member RG CCE
  14:15   Towards TYNDP 2014 and further; Role in EC Energy                Dimitrios Chaniotis
          Infrastructure Package implementation                            Manager, ENTSO-E Secretariat

  14:30   Way forward and role of RG CCE in grid development               Convenor, Members, All
  14:45   Questions & Final Discussion                                      All
  15:25   Conclusions and the way forward                                  Andrew Kasembe
                                                                           Convenor RG CCE
  15:30   End of Workshop

                                                                                                                          6 December 2011 | Page 4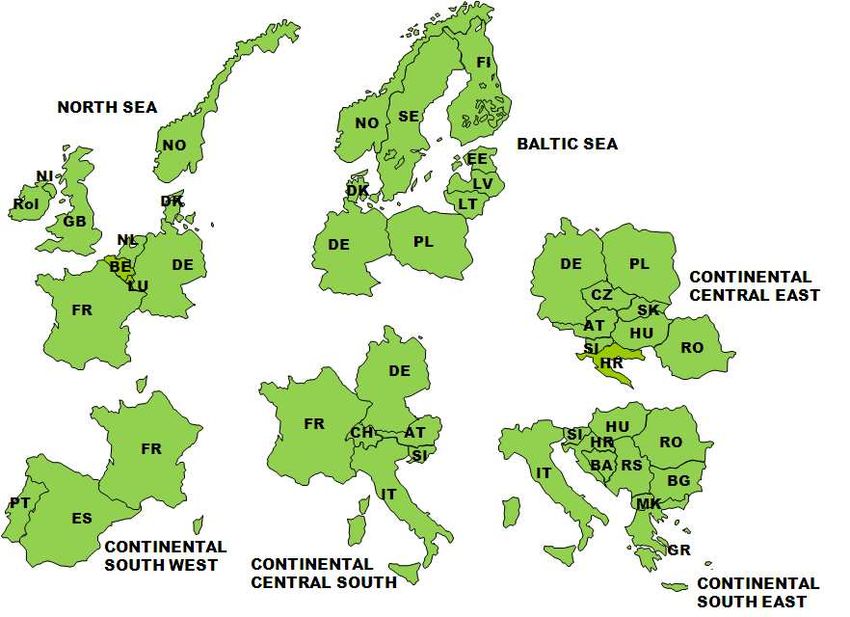
YOU ARE ALL WELCOME

Andrew Kasembe
kasembe@ceps.cz
5 December 2011

General presentation on ENTSO-E, TYNDP and
  Regional Investment Plan
  Dimitrios Chaniotis
  Manager, ENTSO-E Secretariat

RG CCE Workshop
5 December 2011
Prague, Czech Republic
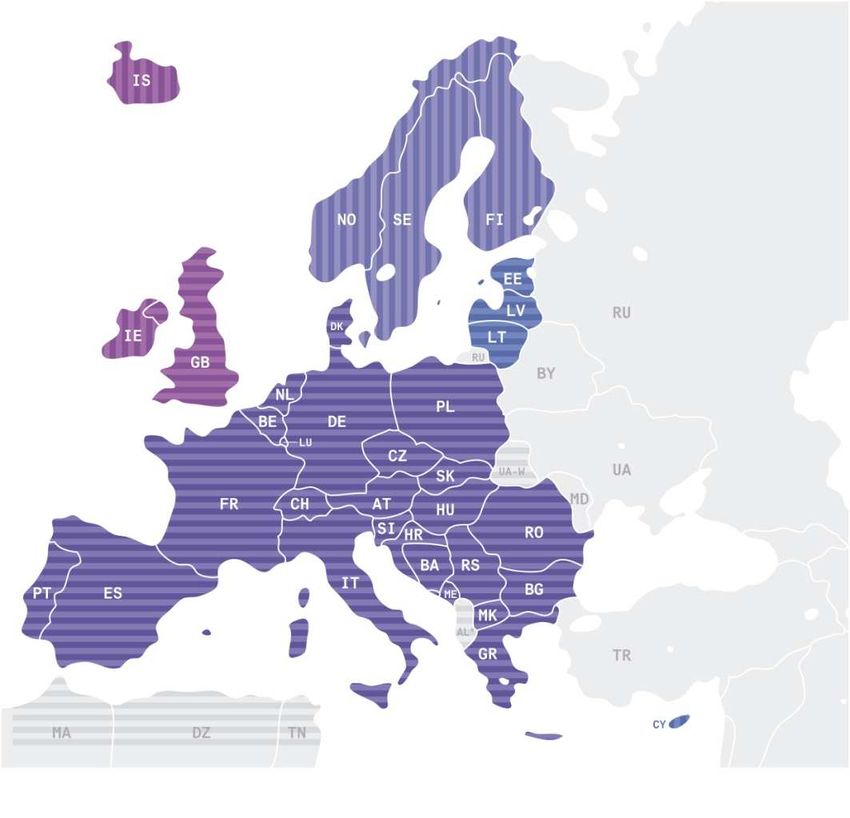
ENTSO-E: a trans-European network

• Fully operational since July 2009

• Represents 41 TSOs from 34 countries
    • 525 million citizens served
    • 828 GW generation
    • 305,000 Km of transition lines
      managed by the TSOs
    • 3,400 TWh/year demand
    • 400 TWh/year exchanges

• Replaces former TSO organisations:
  ATSOI, BALTSO, ETSO, NORDEL,
  UCTE, UKTSOA
Regulation 714/2009– an important raison d’être for ENTSO-E

    Article 4: European network of transmission system operators for electricity
         •   Completion and functioning of the internal market in electricity and
             cross-border trade
         •   Optimal management, coordinated operation and sound technical
             evolution of the European electricity transmission network

    Article 6: Establishment of network codes
    Article 8: Tasks of the ENTSO for Electricity
         •   Network codes
         •   Common network operation tools
         •   Non-binding Community-wide 10-year network development plan,
             including a European generation adequacy outlook, every two years
         •   Work programme, annual report, summer/winter outlooks, monitoring

      ENTSO-E operational because a fully developed IEM and the integration of
                         RES demand urgent TSO action
Approach to system development

     Goal
                                 System Adequacy Retrospect
                                                                • An ambitious and
 Integrated network and market

                                 Summer/Winter Reviews
                                 TYNDP 2010 Assessment
                                                                comprehensive work program
      Consistent scenarios
      (2020 – 2030 – 2050)

                                 Winter Outlook 2011-2012       looking at all time horizons
                                 Summer Outlook 2012
            modeling

                                                                • TSO expertise and experience
                                 Scenario Outlook & Adequacy    under a common working
                                 Forecast 2011-2025
                                 Regional Investment Plans      framework
                                 TYNDP 2012
                                                                •Transparency and stakeholder
                                 Modular Development Plan for
                                 Electricity Highways           involvement
                                 North Seas Offshore grid
The 3rd Package defines the TYNDP

     Non binding                                                            Binding
     Every 2 years                  Regulators check consistency           Every year
      EU-
      EU-TYNDP                                                         Nat. TYNDPs
• Generation adequacy outlook                                      • Existing and forecast supply
  5 yr up to 15yr ( 2025!)           Build on nat. gen. adequacy     demand
• modelling integrated networks       outlooks and invest. plans   • Efficient measures to
                                                                     guarantee adequacy & SoS
• Scenario development
                                                                   • Indicate main transmission
• Assessment of resilience                Take into account          infrastructure to be built
• Based on reasonable needs of
  system users                                                     • Based on reasonable
                                                                     assumptions about evolution
• Identify investments gaps                                          of generation
• Review barriers to increase                                      • Supply consumption and
  cross border capacities arising
  from approval procedures                 Non binding               exchanges

                                          Every 2 years
                                            Regional
                                        Investment Plans
The Ten-Year Network Development Plan 2010
42.100 km of new lines (mostly overhead )
500 individual projects
all required!!
mostly along EC corridors
€ 28 billion (5 years)
On top of investments for growing
demand and aging assets!Main drivers identified in 2010
Massive integration of renewable energy sources
in Northern Europe
in Southern Europe
Important East-West and North-South energy
flows in South-East and Central-South regions
Baltic States integration
Connection of new conventional power plants
Power supply of some large European cities and
regionsTYNDP 2012 package improves
• Explicit definition of projects of pan-European significance
• Public procedure to identify the 3rd party projects
• More scenarios : top down + bottom up scenarios + Nuclear
phase-out sensitivity analysis
• Regional market & network studies – based on the common
set of data
• Project assessment based on a set of clear indicators
• More compact reports easy to understandENTSO-E Regional Groups
The most
appropriate
framework for
grid
development
in Europe
Every RG gather
countries sharing the
same common concerns
Overlaping, in order to
ensure overall
consistencyA dense 2-year long study process
Annual generation CSW Region (TWh) -
• Scenario elaboration EU202020 - Grid 2012
Miscellaneous;
& validation Peak
95
Total Hydro;
116 Wind; 157
Hydro ROR;
Generation; 60
0 Hydro STOR;
CCGT; 70 57
COAL; 0
Solar; 36
LIGNITE; 4
• Market studies NUCLEAR;
501
• Network studies
• Project identification
& valuation
• Reports compilationMain deliverables TYNDP 2012
Market
studies
G/L dev. areas Expected bulk
NTCs + technical needs 202020 flow patterns
in 2020
2010 (+)
Transmission
Network
studies
adequacy
Proposed Grid transfer
projects capability increasesThe TYNDP 2012 package
8 documents
• Scenario outlook & adequacy forecast report
(SOAF)
• 6x Regional Investment Plans reports
• Detailed grid development issues, regional level
• Ten-Year Network Development Plan report
• Synthetic compilation, pan-European levelOverall schedule TYNDP 2012
Jun2010 Jan 2011 Jun 2011 Dec2011 March 2012 June 2012
Methodologie Regional
TYNDP 2010 New 202020 s& workshops
scenario assessment RgIP & TYNDP
criteria results
NREAPs SAF 2011
Scenarios
Final
reports
6 RgIPs + TYNDP reports
SOAF 2012 report
Workshop
Consultation
2010 2011 2012Conclusions
• A consistent ENTSO-E approach in all planning horizons
• The pilot TYNDP in 2010 first overview of the needs, drivers and
the necessary European infrastructure
• TYNDP 2012 improvement: more comprehensive, common
studies, top down approach, open to the 3rd party projects
• The TYNDP as the factual and methodological basis for key
policy and investment decisions.
• Transparency - stakeholder involvement is the key success
factorTHANK YOU FOR YOUR ATTENTION Dimitrios Chaniotis dimitrios.chaniotis@entsoe.eu 5 December 2011
Main challenges and specifics for
  Grid Development in CCE region
  Harald Köhler
  Member RG CCE

RG CCE Workshop
5 December 2011
Prague, Czech Republic
Transformation Process

 Evolving from a reliable transmission network which was designed,
 optimized and operated together with generation resources …

 …towards a transmission network facilitating EU energy & climate
 policies (KYOTO, EU 202020), enabling market development,
 integration of renewables and maximising welfare.

    Still uncertainties that prevail over the future power system

                                                              6 December 2011 | Page 22
European Energy Policy Goals
Main Drivers for Network Development
Security of
Supply • Security of Supply
• Enormous RES-Development
• New Pumped Storage Power Plants
efficient,
demand • New Conventional Power Plants
delivering
Infrastructur • Change of Generation and Load Patterns
e
• Market Integration
Competitiveness Sustainability
Sustainability
Develop and complete the KYOTO, EU 20-20-20, National
Internal Electricity Market Climate Acts
Integration of Renewables to
achieve the 2020 climate targets
6 December 2011 | Page 23RES Development within the CCE Region
GW
140 132
• Massive RES growth
120
• Most of all Wind Energy is
100 93 planned to be expanded
followed by Photovoltaik
80
65 63
53
• In 2020 about 80% of the
60 48 CCE wind capacity will be
40 installed in Germany
28 23
19 18 21
17
20 • 50 % of the installed
capacity – non
0 dispatchable
2009 2015 2020
Total RES Wind PV and other RES Run off river hydro
* Based on National Renewable Energy Action Plans
6 December 2011 | Page 24Energy Transition is Happening….
…and Brings New Challenges for the Network
Kyoto
Regional drifting apart of generation
EU 20-20-20 and demand
Climate- & Energy aims
o Decentralisation vs. centralisation
Integration of o Wide area power flows
Renewables
Time related drifting apart of generation
Nuclear Phase Out and demand
Need for Storage o Need for dispatchable generation reserves
Technologies o Need for storage capacity
Growing Demand o Generation oriented demandmanagement?
Smart Grids No coordinated planning of the
Electricity Highways electricity system
o Generation – Transmission – Consume
Roadmap 2050
o Lack of overall picture
6 December 2011 | Page 25RES-Development – Enormous Increase of
Non-Dispatchable Generation (EU2020)
Peak of non-
dispatchable
generation is
higher than
minimum load in
RG CCE (AT)
For Germany
Peak is higher
than maximum
load
Non-dispatchable
generation
consists of run of
river, wind and
dispersed
generation
including Solar
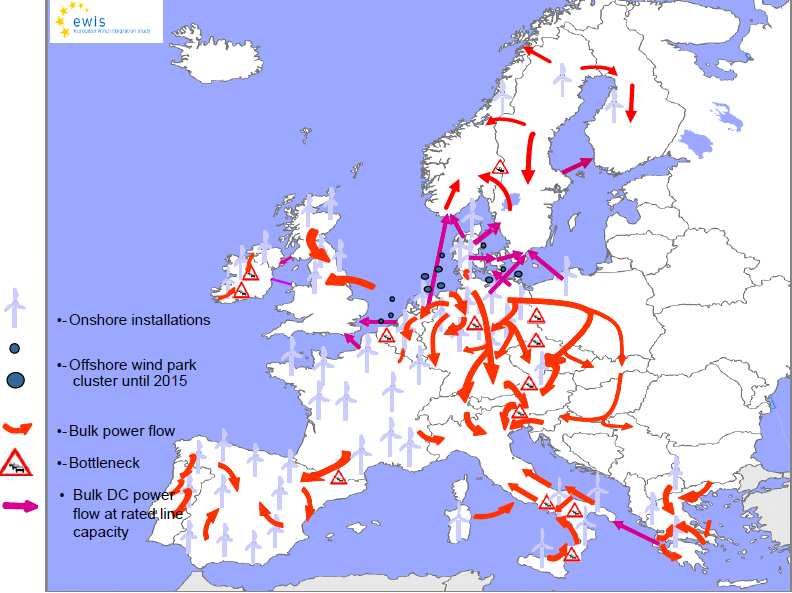
6 December 2011 | Page 26EWIS Results
High pan-European electricity transport due to planned Wind-Integration
16.11.2010 27
January 28th 2011
27We are Heading Towards a
Structural Congestion in Europe
Urgent need for additional transmission lines
6 December 2011 | Page 28European Energy Strategy is defined
Need for new grids are proven and
will be affirmed with the TYNDP 2012
Still obstacles in the procedure of grid development !
6 December 2011 | Page 29Further Challenges for Transmission
Infrastructure Development
Public Acceptance
Long lasting
Authorisation Process
Urban Planning
Financing and Regulation
EU 20/20/20 targets
Security of Supply Grid
Integrated Eletricity development
Market
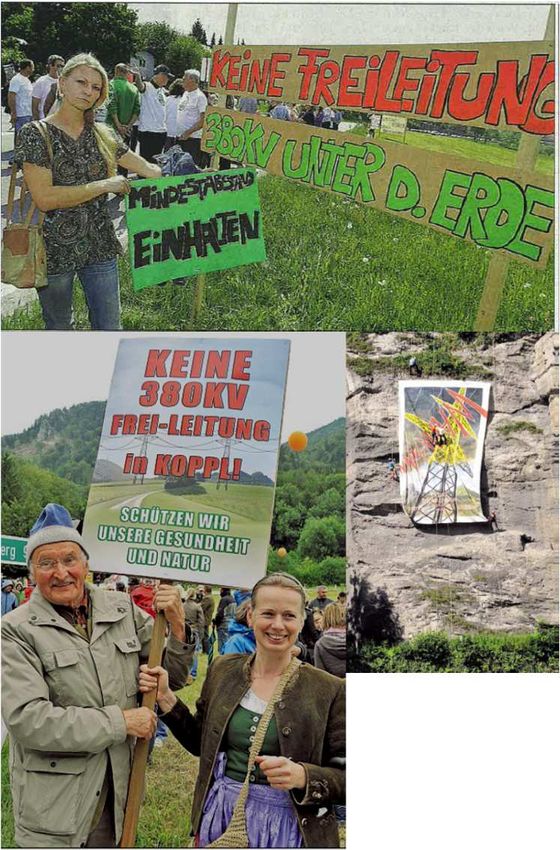
6 December 2011 | Page 30Public Acceptance –
a Strategic Keyfactor for Success
• Lack of understanding / appreciation for…
o …the liberalized internal electricity
market
o …the need of new grids
Local vs European Perception/Thinking
• Fear of…
o …EMF (many different opinions, different
limit values within the European countries)
o …property devaluation
• Discussion on OHL/Cable
• Often the lack of commitment from the
political stakeholders
NIMBYUrban Planning
Urban planning does not take lines into consideration
• no legislative possibility to prevent corridor rededication
Buildings under an existing Building under a new 380kV Line
220kV Line
32
January 28th 2011Authorisation Process
Lengthy Permitting Procedures as consequence of…
• Submission of objections is possible at all times and instances of the
permitting procedure
• Public interest has to be proven by the TSO even for projects of
European interest
• Unharmonised legislation between countries and even between regions
• Lack of uniform limit values e.g. concerning values for EMF
• Lack of reasonable and concrete time limits for issuing approvals
• Conflict: nature vs. humans
There is no appropriate evaluation of values between
environmental issues and the public interest for security of
supply or other aims
33
January 28th 2011Present Steps Taken by TSOs to Reduce
the Lengthy Permitting Process
• Financial compensation of the population affected -
reflected further in the tariffs
• Closer collaboration with the local administration in
assessing the future urban planning
• Environmental compensation - “balance effect”
• Active participation in informing the population on EMF
• Environmental impact taken into account from incipient
study phases
January 28th 2011Recommendations
• EU priority legislation and infrastructure corridors
• Mandatory support from national and regional political
bodies for projects of European importance
• Adoption of a legal framework that ensures efficient
authorisation procedures
o Harmonised EU permitting legislation
o One stop permitting procedure – with clear deadline
• Building lines of European top priority should be possible in
nature protection areas
35
January 28th 2011Conclusions
Adequate and reliable transmission network is a crucial pre-requisite
for the EU energy policy goals
To achieve them on time, there is a need for:
• … an inclusive view (planning) of the whole power system and its
functions
• …an improvement of social acceptance with support of all stakeholders
• … a robust regulatory framework
• … efficient authorisation procedures
36
January 28th 2011THANK YOU FOR YOUR ATTENTION Harald Koehler Harald.Koehler@apg.at 5 December 2011
Preliminary results of the CCE RG Investment
  Plan – Market Studies
  Zdenek Hruska
  Convenor Subgroup market Modelling for RG CCE

RG CCE Workshop
5 December 2011
Prague, Czech Republic
Content

 •   Overall Process of RgIP and TYNDP 2012
 •   Methodology of Market simulations
 •   Scope of market simulations results
 •   From market studies to grid studies

                                              6 December 2011 | Page 39
Overview of common RG CCE process
10.01
0.8
1.91
5.3
0.1
3.6
2.75
6.87
3.4
3.48
19.85
2.7 TWh p.a.
0.3
19.01
2.3
3000
10.0
2500
2.40
0.14
2000
2.5
1.30
0.5
0.12
7.1
1500
3.24
0.34
1000
500
0
0 1000 2000 3000 4000 5000 6000 7000 8000
-500
Market -1000
-1500
Studies -2000
PL-CZ PTDF flows PL-CZ Market flows
PTDF
method
Grid study
6 December 2011 | Page 40Overview and key findings
• Based on validated common database and consulted scenarios
• ENTSO-E SDC Regional Groups perform jointly regional analyses
while TSO experts sharing views and building jointly solutions
• The entire Europe was modeled; results communicated and shared
by all RGs
• Several sensitivity studies were carried out (nuclear power plants
phase out, CO2 price change; ...)
• Indication of the future market and grid needs with regards to the
EU energy goals
• A top-down, open, dense and complex study process with
consistent results and constantly improving within ENTSO-E
6 December 2011 | Page 41Methodology
of market simulations
6 December 2011 | Page 42Market Study towards RgIP and TYNDP 2012
MARKET SIMULATION
• Pan European Common Market Database to ensure
consistency (over 1 million items) – under ENTSO-E SDC
• More than 30 countries in the DB
• SW PowrSym3 - OSA, Inc. (USA)
• Perfect market model, no subsidies, no capacity payment, no
market player bahaviour
• ENTSO-E common guidelines
• Bottom-up & top-down scenario development
(consulted, complying with EC initiatives and NREAPS)
• Shared by all RGs: methodologies, data and results
• The main focus was to model whole ENTSO-E
6 December 2011 | Page 43Market Study towards RgIP and TYNDP 2012
ASSUMPTIONS and DATA SETS
• Common data sets for all RGs:
• Transfer capacity for interconnections
• Installed capacity of power plants
• Consistent time series for RES and load
• Same fuel prices, efficiency, etc. for whole Europe to
follow behavior of energy sector
• TSO experts sharing views and building jointly solutions
6 December 2011 | Page 44RG CCE Market Simulation – Fundamental Scenarios
Scenario EU2020 (European target 202020)
• Data according to NREAPs (National renewable energy action plan)
• Price of CO2 emissions (high price level – price level influencing
merit order of power plants)
• Load (energy saving) and generation portfolio specific to this
scenario
Scenario B
• Data according to actual way of energy sector development (TSO
Best Estimate)
• Price of CO2 emissions (low price level)
• Load and generation portfolio specific to this scenario
6 December 2011 | Page 45RG CCE Market Simulation – Sensitivity Analysis
Sensitivities on Scenario EU2020
• Price of CO2 emissions (middle price level for CO2 market)
• Price of CO2 emissions (low price level– price level according to
Scenario B outlook for CO2 market)
• German Nuclear phase out (installed capacity in 2020)
Sensitivities on Scenario B
• German Nuclear phase out (installed capacity in 2020)
• Price of CO2 emissions (middle price level for CO2 market)
• Set of scenario frame to asses the possible future market behavior
6 December 2011 | Page 46Scope of results
6 December 2011 | Page 47Balances for EU2020 Base case and Nuclear phase out
Nuclear phase out – 24TWh additional
import of RG CCE
CCE is a net importer in Scenario EU 2020
and more for Nuclear phase out
Each value of annual balance represents
sum of individual hours of year
For PL additional import from Belarusia and
HU from Ukraine
6 December 2011 | Page 48Market exchanges for EU2020 and its Nuclear phase out
Each value of annual exchanges
represents sum of individual hours of year
Highest market exchanges in RG CCE:
DE-AT, SK-HU, AT-SI, AT-HU,CZ-SK
For PL additional import from Belarusia
and HU from Ukraine
6 December, 2011 | Page 49Hourly commercial exchange and duration curve
Hourly results
per border and
duration curve
At this stage –
commercial
exchange, not
physical flows
6 December 2011 | Page 50Comparison of commercial exchange (duration curve)
2000
1500 Comparison of
commercial
1000 exchange in
different scenarios
for one border
500
Changes in
0 generation
0 876 1752 2628 3504 4380 5256 6132 7008 7884 8760 portfolio or grid
structure influence
-500 also areas quite
far away
-1000
-1500
-2000
RO-HU B base case RO-HU B nuclear phase out RO-HU EU base case RO-HU EU nuclear phase out
6 December 2011 | Page 51Scenario EU2020
Energy production, RES share in CCE region (202020 target) year 2020
300 60.0%
Overview of energy
%
GWh
production inside CCE.
250 50.0%
Share of RES production
200 40.0%
150 30.0%
100 20.0%
50 10.0%
0 0.0%
RG CCE DE PL CZ SK AT HU RO SI HR
Nuclear Lignite Hard Coal Gas Oil Hydro Phyd Wind Other REN RES/production RES/consumption
6 December 2011 | Page 52Hourly output per type and country (scope of results)
Hourly results per
type of power
plants
Results available
for each modelled
country
Maintenance and
outages taken into
account
Technology
restriction (min up
and down time,
ramp rates,…)
6 December 2011 | Page 53Input data - Installed capacity Scenario EU2020
Total installed capacity and share of technologies
1114G 347GW 45GW 24GW 186GW 5GW 8GW 40GW 26GW 6GW 7GW
100% In RG CCE only
90% 50% of Installed
capacity is reliable
80%
available capacity
70% The rest of the
capacity 50% is
60%
constituted from
50% non dispatchable
40%
generation
30% Non-dispatchable
20% generation consists
of run of river, wind
10%
and dispersed
0% generation
ENTSO-E RG CCE AT CZ DE HR HU PL RO SI SK including Solar
NUCLEAR HARDCOAL LIGNITE CCGT
GAS OIL OTHER PUMP HYDRO
RESRVOIR HYDRO ROR WIND
6 December 2011 | Page 54Load and non-dispatchable generation Scenario EU2020
Peak of non-
dispatchable
generation is
higher than
minimum load in
RG CCE (AT)
For Germany
Peak is higher
than maximum
load
Non-dispatchable
generation
consists of run of
river, wind and
dispersed
generation
including Solar
6 December 2011 | Page 55Average marginal costs – EU2020, B and sensitivity studies
Overall price
levels of energy
are very
dependent on
CO2 price level
Not taken into
account consumer
prices (feeding
tarifs, …)
6 December 2011 | Page 56Conclusions I
• Common coordinated process by ENTSO-E
• All European countries modelled
• European visions & Best Estimate assumptions for
future implemented in model
• Successfully created inputs for grid studies by
market studies
6 December 2011 | Page 57Conclusions II
• RG CCE (Scenario EU 2020)
o importer of 6TWh
o nuclear phase out import of 30TWh
• 50% of installed capacity in RG CCE could be dependent on
non dispatchable generation (weather conditions
dependency – water, sun, wind)
• Interconnections within the CCE region reduce around
4.5Mts CO2/a
6 December 2011 | Page 58THANK YOU FOR YOUR ATTENTION Zdenek Hruska hruskaz@ceps.cz 5 December 2011
Preparation and Results towards RgIP and TYNDP 2012

  RG Continental Central East
  Grid Studies

Norbert Lechner
5 December 2011
Prague, Czech Republic
Overview of common RG CCE process

       Why we need grid studies?

                                    6 December 2011 | Page 61
Overview of common RG CCE process
Why we need grid studies?
- Market simulations show the generation dispatch
and market flows for the chosen scenario
- market flows are not identical with physical flows
but:
knowledge of physical flows is necessary to
elaborate planned grid extensions and identify new
projects
6 December 2011 | Page 62Overview of common RG CCE process
Market
Studies
10.01
0.8
1.91
5.3
0.1
& Evaluation
Project identification
3.6
2.75
& Validation
Scenario elaboration
6.87
3.4
3.48
19.85
2.7 TWh p.a.
0.3
19.01
2.3
10.0
2.40
0.14
2.5
1.30
0.5
0.12
7.1
3.24
0.34
3000
2500
2000
1500
1000
500
0
0 1000 2000 3000 4000 5000 6000 7000 8000
-500
-1000
-1500
-2000
PL-CZ PTDF flows PL-CZ Market flows
PTDF
method
Grid Studies
6 December 2011 | Page 63Power Transfer Distribution Factors (PTDF)
6 December 2011 | Page 64Reason for using the PTDF approach
Output of market simulations: 8736 Situations per scenario
too many situations to make for all AC grid calculations
To choose those situations that will be relevant for dimensioning the
future grid a rough choice out of the market data is necessary
?? Advantage PTDF
25.000 DE
20.000
approach: there is the
15.000 possibility to make a first
10.000
5.000
analyses of all cases
MW
0
0 2000 4000 6000 8000
-5.000
-10.000
-15.000
-20.000 HoursPTDF- Basic principle I
∆P
∆Pab
A B
A→ B
=
Line ab
Node A node B
PTDF
∆P
ab line
∆Pab
line
ax xb
Node x
PTDFabA→ B = PTD-Factor / relation
A→B = Transaction from node A to B
ab = connection between node A and B
∆Pab = power on the connection ab
∆P = power of the overall transaction from node A to B
source: Duthaler C.L 2007: Power Transfer Distribution Factors; Analyse der Anwendung im
Ucte-Netz (Analysis of use in the UCTE grid). Master‘s thesis 2007PTDF- Basic principle II • In the CCE-PTDF-Matrix every country is modeled as a single node • One country is used as a reference node (here: AT) • Grid calculations were done, what is the impact on each border inside continental ENTSO_E for an additional market flow from one country to the reference • Theses calculations were done for every country inside continental ENTSO_E • =>PTD Factors between every country and the reference country were found • A market flow between country A and B is calculated as a flow from A to reference and from reference to B
PTDF- Basic principle III

• All PTD Factors were put together in a matrix in excel
• PTDF is a fast possibility to analyze a lot of cases
• critical cases can be find out with help of PTDF

• but: additional AC-load flow calculations are necessary due:
 - PTDF is a linear solution of a no linear problem
 - no information's about flows inside a country
Comparison of market flow and PTDF flow duration curve
 (PL-CZ profile) Scenario EU2020
3000
                                                                                        Comparison of
2500                                                                                    commercial
                                                                                        exchange and
2000                                                                                    PTDF flow

1500                                                                                    Identification of
                                                                                        cases of interest –
1000                                                                                    input for network
                                                                                        studies
 500

   0
        0   1000   2000   3000        4000       5000              6000   7000   8000

 -500

-1000

-1500

-2000
                           PL-CZ PTDF flows   PL-CZ Market flows

                                                                                        6 December 2011 | Page 69
AC load flow calculations
6 December 2011 | Page 70The points in time have been chosen to justify the necessity of projects included in RIP and verify if they are enough to satisfy the network security in following situations Significant transits: North-to-South (4 cases) Northwest-to-Southeast (1 case) Highly loaded cross-border profiles, (3 cases) RES integration: High RES generation (2 case) (all cases for Scenario EU2020)
From Market studies To Grid Studies

Based on generation
dispatch within CCE region –
allocation of power output to
particular generators in the
grid for specific cases (out of
PTDF-results)

Loading of each individual
element of the grid

Security assessment (N-1,
voltage,…)

                                      6 December 2011 | Page 72
Network model for RC CCE study – example for results:
(for the northwest – southeast transit case)
Market
exchanges can
be significantly
different from
flows in the grid
PTDF calculation
is considered as
useful tool
6 December 2011 | Page 73Investments in CCE in TYNDP 2012
6 December 2011 | Page 74Mid term investments in Region CCE (draft)
6 December 2011 | Page 75Long term investments in Region CCE (draft)
6 December 2011 | Page 76Project Monitoring
• Main reasons for projects delays:
• Financial issues – lack of support, financial gap
• Permit granting procedure – long process, local opposition,
environmental aspects
• Generation investment uncertainty – RES and conventional generators
• Harmonization with other investments (priority aspects, project
rescheduling)
• Main reasons for earlier commissioning
• Security issues
• Power plant evacuation – rapid increase of RES
• Other projects were cancelled or changed their structure
• New projects also evolved
6 December 2011 | Page 77Project Monitoring and Indicators
Share of each category is for all monitored
indicators in conformity with other RGs.
No significant discrepancy
6 December 2011 | Page 78THANK YOU FOR YOUR ATTENTION Norbert Lechner norbert.lechner@tennet.eu 5 December 2011
Towards TYNDP 2014 and further

  Dimitrios Chaniotis
  Manager, ENTSO-E Secretariat

RG CCE Workshop
5 December 2011
Prague, Czech Republic
The path to 2020 and 2050

                    Oslo

                                  Warsaw

                           Rome
          Madrid

                                           6 December 2011 | Page 81
European transmission grid – key role in reaching the EU
policy goals
Energy policy goals
• Sustainability/GHG:
̶ More renewables, further from the loads
̶ More heating and mobility with electricity
• Competitiveness/market integration:
̶ More long-distance flows
• Security of supply
̶ More optimal resources sharing
6 December 2011 | Page 82Two difficult questions!
• What would happen if the projects in the TYNDP
cannot be delivered?
• Do you think that the TYNDP projects will be
delivered?
6 December 2011 | Page 83From words to actions - field initiatives for public acceptance
• Facts:
– Less than 1% of overhead lines built during the last decade
– TYNDP 2010 14,4% increase needed by 2020
– Slow and cumbersome permitting procedures the main obstacle for delivering investments
– Public acceptance cannot be improved by TSOs alone
• What needs to be done, now!
– Policy makers, Mayors, NGOs, Administrations and Media should deliver the same message:
“a sustainable and CO2 free power system tomorrow
implies more transmission lines from now on”
6 December 2011 | Page 84From words to actions - legislative implementation • Some stability in EU legislation - avoid new concepts becoming part of official documents – when relying on unproven or fuzzy concepts, or – technologies without track records in the EU network • Some compatibility among the 27 MS energy policies
From words to actions - attractive financing framework

          Stock listed and        Money flows to companies &
Equity                           projects with the best perceived
       Privately owned TSOs
                                        risk/return profile.

         State owned TSOs        TSO = safe perception
Loans
            Other TSOs           Rating Agency requirements!

    What do EU TSOs need to be well positioned in the
              globalised capital market ?
     • “real” return in line with similar risk profiles businesses
     • incentives for activities “really” managed by TSOs
     • legislation and regulation in line with 20 to 50 years assets
The Energy Infrastructure Package
• A timely legislative initiative addressing the most urgent
issues
• Huge step forward to streamline permitting procedures
• Positive but unfocused effort to facilitate investments on
the transmission grid
• Cost-allocation is just part of the overall picture –
cost-benefit analysis not a panacea
• Incentivizing TSOs to deliver on time should be the
priority
• Regional approach for decision making with TYNDP as
the main starting point – Projects of Common InterestThe role of ENTSO-E after 2012
• The TYNDP as the only basis for identifying projects of
common interest
• With an open, transparent and non-discriminatory
procedure for including non-TSO projects
• Deliver a cost-benefit analysis adapted to the real needs of
the deciding bodies
• A common basis for identifying financing gaps
• Provide the top-down technical overview at the EC regional
Groups
• Avoiding duplication of effortsConclusions
• The Energy Infrastructure Package is a much needed
policy initiative
• Streamlining permitting processes must happen
now
• Focus on regulation that incentivizes TSOs
• ENTSO-E is ready to undertake the new roles to be
assigned to it …
• … continuing being a listening organization,
operating in transparency and involving all
stakeholdersTHANK YOU FOR YOUR ATTENTION Dimitrios Chaniotis dimitrios.chaniotis@entsoe.eu 5 December 2011
Way forward and role of RG CCE in Grid
  Development
  Members RG CCE

RG CCE Workshop
5 December 2011
Prague, Czech Republic
TYNDP 2014 and further – continuously increasing quality

 •   Long visions that have a larger spam than 10 years
     (e.g. vision 2030)
 •   Creating the methodology for the European CBA
 •   Updating and improving the network model for the pan-
     European and regional network studies
 •   Updating and improving the existing pan-European
     market data base (PEMD) – base for the Regional
     market studies
 •   Looking for continuous coherency with longer term
     plans – 2050 E-HIGHWAYS, North-Sea grid,
     Mediterranean ring, System Extension Project
     (Ukraine/Moldavia, ..)

                                                  6 December 2011 | Page 92
THANK YOU FOR YOUR ATTENTION Andrew Kasembe kasembe@ceps.cz 5 December 2011
You can also read