Compositional Characteristics of Atmospheric Aerosols during a Consecutive High Concentration Episode in Seoul, Korea - MDPI
←
→
Page content transcription
If your browser does not render page correctly, please read the page content below
atmosphere
Article
Compositional Characteristics of Atmospheric
Aerosols during a Consecutive High Concentration
Episode in Seoul, Korea
Hee-Jung Ko 1 , Seung Joo Song 2 , Jeong Eun Kim 1 , Jung-Min Song 3, *             and Joo Wan Cha 4
 1   Environmental Meteorology Research Division, National Institute of Meteorological Science, Seogwipo,
     Jeju 63568, Korea; khj0614@korea.kr (H.-J.K.); narci76@korea.kr (J.E.K.)
 2   Emission Inventory Management Team, National Center for Fine Dust Information, Cheongju-si,
     Chungcheongbuk-do 28166, Korea; sjtomato@korea.kr
 3   Department of Chemistry & Cosmetics, Jeju National University, Jeju-si, Jeju 63243, Korea
 4   Applied Meteorology Research Division, National Institute of Meteorological Science, Jeju 63568, Korea;
     jwcha@korea.kr
 *   Correspondence: sjm6990@gmail.com.; Tel.: +82-64-754-3540

 Received: 8 January 2020; Accepted: 19 March 2020; Published: 22 March 2020

 Abstract: This study focuses on the temporal variation in the compositional characteristics of
 atmospheric aerosols in Seoul, South Korea, during the consecutive high aerosol concentration
 episode from 30 December 2013 to 2 January 2014. The temporal variations in the observed physical,
 optical, and chemical properties show that there were three distinct episodes during the period: haze,
 mixed haze/Asian dust, and Asian dust episodes. For the haze period, the concentration of secondary
 inorganic aerosols increased and both secondary inorganic aerosols and calcium species exhibited
 simultaneously high concentrations during the mixed haze/Asian dust period. The neutralization
 factors by ammonia in the haze periods were higher as 1.03 than the other periods, meanwhile the
 neutralization contribution by calcium carbonate was relatively higher as 1.39 during the Asian dust
 episode. The backward trajectory analysis showed that concentrations of SO4 2− , NO3 − , and NH4 +
 were relatively high when air masses moved over East China. Principal component analysis showed
 that water-soluble components originated from soil dust/incineration, secondary aerosols/biomass
 burning, and road dust from the haze aerosol. For the mixed haze/Asian dust episode, the major
 source of aerosols was estimated to have originated from soil dust, pollutants from fossil fuel
 combustion, biomass burning, and sea-salt emissions. Furthermore, the main sources of ionic species
 in the Asian dust aerosols were estimated to be sea-salt/soil dust, secondary aerosols/coal combustion,
 and road dust.

 Keywords: aerosol; sky radiometer; particle-into-liquid sampler; haze; Asian dust; principal
 component analysis

1. Introduction
     Aerosol particles play important role in the ambient air related to air quality, urban and regional
air pollution, visibility, global climate, biogeochemical cycles, human health, etc. [1,2]. Aerosols can
offset regional greenhouse warming effects directly by scattering sunlight back into space and indirectly
by enhancing cloud albedo, thereby cooling the climate [3]. However, aerosol components such as
soot heat the atmosphere by absorbing sunlight and thereby augmenting the warming produced by
the greenhouse effect [3,4]. Over polluted regions, long-range transport of mineral dust mixed with
anthropogenic species could induce substantial changes in the optical and chemical properties of
aerosols [3,5].

Atmosphere 2020, 11, 310; doi:10.3390/atmos11030310                           www.mdpi.com/journal/atmosphere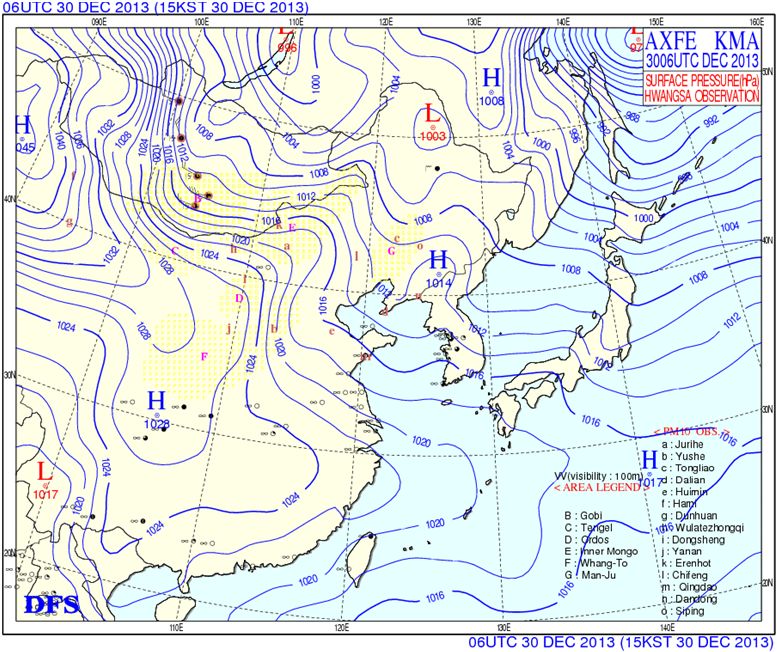
Atmosphere 2020, 11, 310                                                                            2 of 13

     Research on the concentration, size, and chemical composition at the receptors is essential to
elucidate the sources of aerosols and the processes associated with their formation [6]. Both natural and
anthropogenic sources, such as road dust, vehicular emissions, secondary aerosols, sea-salt, and black
carbon from oil burning, influence aerosol characteristics [7,8]. Source apportionment is an important
approach for identifying and quantifying various sources of air pollutants [9,10]. The most common
method is receptor modeling [11], which can provide a theoretical and mathematical framework for
quantifying contributions from potential sources. The purpose of a receptor source apportionment
model is to estimate the contributions of specific source types to pollutant levels in the atmosphere at a
sampling (or receptor) site [12]. The contributions of each source are distinguished through differences
in their physical and chemical properties [12]. Computer-generated source apportionment results
must be interpreted by experts with knowledge about the site and the associated potential sources [12].
Principal component analysis is one of the most widely used multivariate statistical techniques in the
atmospheric sciences [12,13].
     In this study, data on the optical and chemical properties of atmospheric aerosols were collected
and analyzed in real time at the Seoul Meteorological Station, South Korea during a consecutive high
concentration episode from 30 December 2013 to 2 January 2014. This period was selected as a case
study of dust and sand storm (DSS) events by working group-1 (WG1) of the Tripartite Environment
Ministers Meeting among China, Japan, and Korea (TEMM) [14]. More specifically, the solar radiation
properties and concentrations of the water-soluble ionic components of the ambient aerosols were
analyzed to identify the possible sources of the main aerosol constituents.

2. Method
     Seoul Meteorological Station (37.57◦ N, 126.97◦ E) is situated in the Songwol-dong area located in
the middle of Seoul, South Korea at a height of 85.5 m. An intensive observation study of atmospheric
aerosols was carried out during the high aerosol concentration episode from 30 December 2013
to 2 January 2014. Surface weather map charts and meteorological parameters, including wind
speed, wind direction, humidity, and visibility, were continuously measured at this station by the
Korean Meteorological Administration. The HYSPLIT 4.0 model developed at National Oceanic and
Atmospheric Administration (NOAA) was used to estimate the upstream path of air flow during this
period. The HYSPLIT simulations were run using the Unified Model-Global Data Assimilation and
Prediction System (UM-GDAPS) with weather data from Korea Meteorological Administration (KMA)
for 72 h before each episode at altitude of 500 m above ground level [15].
     Direct and diffuse solar radiations were measured using a collocated sky radiometer (POM-02L,
Prede Co. Ltd, Japan) at Seoul Meteorological Station.
     The aerosol optical depth (AOD) and single scattering albedo (SSA) at five wavelengths (400, 500,
675, 870, and 1020 nm) were retrieved using the SKYRAD.pack software (version 5.0) package [16].
The Ångström exponent (AE) was calculated as a log-linear fitting for the five wavelengths.
     The PM10 (particle matter with an aerodynamic diameter of less than or equal to 10 µm), PM2.5 ,
and PM1.0 concentrations were measured using the Environmental Dust Monitoring (EDM, #180,
GRIMM, Germany) system with 31 channels of different sizes at a flow rate of 1.2 L min−1 at Seoul
Meteorological Station. The instrument is designed to measure the particle size distribution and
particulate mass based on light scattering by individual aerosol particles in the ambient air.
     Semi-continuous measurements of the ionic concentrations in PM10 aerosols were taken at 20 min
intervals using a particle-into-liquid sampler (PILS, model ADI-2081, Metrohm, Switzerland) coupled
to two ion chromatography systems (IC, model ICS-5000, Thermo Fisher Scientific, United States).
The PILS nucleates aerosol particles to form water droplets by mixing a denuded aerosol stream with
a supersaturated steam. The nucleated droplets are collected in a flowing liquid stream by inertial
impaction. The liquid stream, which contains an internal Lithium bromide (LiBr) standard to determine
dilution by condensed water vapor, is split into two streams. These are then injected into two ion
chromatography systems every 20 min to analyze the ionic concentrations for the major water-soluble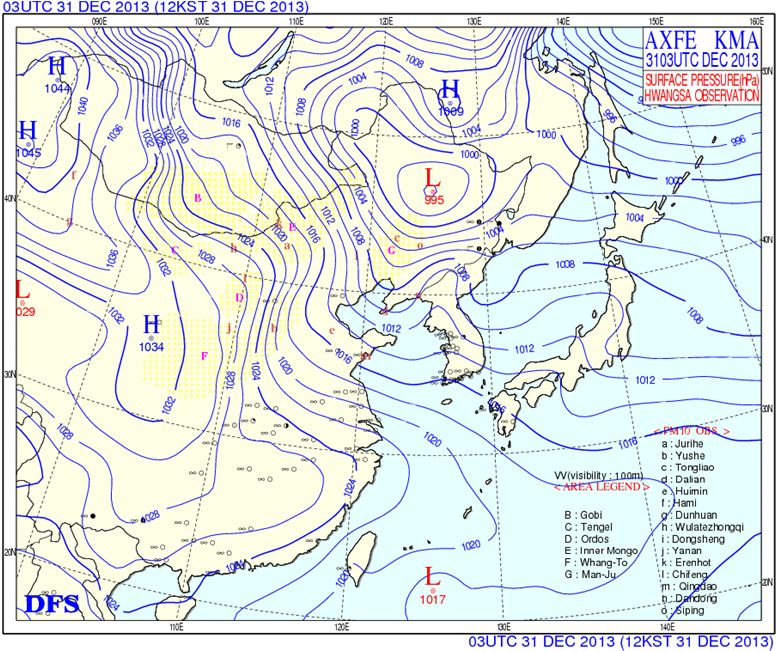
Atmosphere 2020, 11, 310 3 of 13
inorganic species (Na+ , NH4 + , K+ , Mg2+ , Ca2+ , SO4 2− , NO2 − , NO3 − , Cl− ). Eluent for the cationic
analysis was 20 mM methane sulfonic acid with a flow rate of 0.5 mL min−1 using CG12A/CS12A
column and CSRS-ULTRA II suppressor. The analysis of anionic species was performed with an
ion chromatograph equipped using AG19/AS19 column (13 mM KOH eluent) and ASRS-ULTRA II
suppressor. The standard calibration curve for the analysis of cations and anions showed linearity with
R2 = 0.9999 or better. During the analysis period and depending on the species, the limit of detection
(LOD) for IC analyses of the ionic species ranged from 0.05 to 0.1 µg m−3 .
into two ion chromatography systems every 20 min to analyze the ionic concentrations for the major
3. Results and Discussion
water-soluble inorganic species (Na+, NH4+, K+, Mg2+, Ca2+, SO42−, NO2−, NO3−, Cl−). Eluent for the
cationic analysis
3.1. Meteorological was 20 and
Conditions mMMass methane sulfonic acid with a flow rate of 0.5 mL min−1 using
Concentrations
CG12A/CS12A column and CSRS-ULTRA II suppressor. The analysis of anionic species was
Surface weather
performed maps
with an ion for 29 December
chromatograph equipped2013
using to 1 January
AG19/AS19 2014(13are
column mMshown in Figure
KOH eluent) and 1.
The ASRS-ULTRA
atmosphere around the Korean
II suppressor. peninsula
The standard was stable
calibration curvedue
for to
thethe effectofofcations
analysis high pressure
and anions from
29 December to the with
showed linearity morning of 31or
R2 = 0.9999 December (Figure
better. During 1a, Figure
the analysis 2b).and
period Haze was observed
depending in Seoul
on the species,
on 30theand
limit
31ofDecember.
detection (LOD)
On thefor IC analyses of
afternoon of the ionic speciesthe
31 December ranged frompeninsula
Korean 0.05 to 0.1 was
μg maffected
−3.
by
a low-pressure system over northeastern China. The 850 hPa wind speed increased, and the wind
3. Results and Discussion
direction changed from southwest to northwest after January 1, 2014. Asian dust was observed from
02:30 KST 1 January 2014, and the ratios of PM2.5 to PM10 were mainly below 0.5 after this time.
3.1. Meteorological Conditions and Mass Concentrations
(a) (b)
(c) (d)
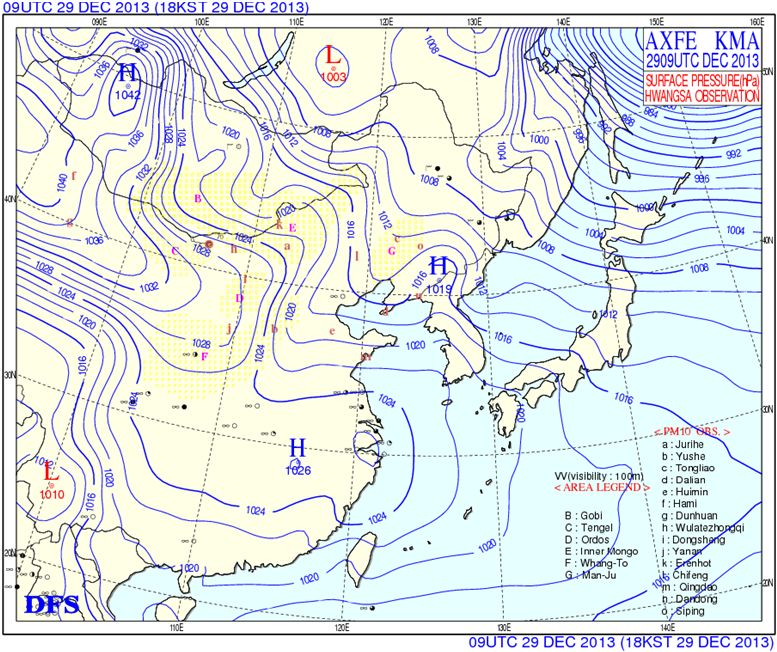
Figure 1. Surface weather chart for (a) 29 December 2013 at 18:00 KST, (b) 30 December 2013 at 15:00
KST,Figure
(c) 31 December 2013 at chart
1. Surface weather 12:00for
KST,
(a) and (d) 1 January
29 December 2014
2013 at atKST,
18:00 03:00(b)
KST.
30 December 2013 at 15:00
KST, (c) 31 December 2013 at 12:00 KST, and (d) 1 January 2014 at 03:00 KST.
Surface weather maps for 29 December 2013 to 1 January 2014 are shown in Figure 1. The
atmosphere around the Korean peninsula was stable due to the effect of high pressure from 29
December to the morning of 31 December (Figure 1a, 2b). Haze was observed in Seoul on 30 and 31
December. On the afternoon of 31 December the Korean peninsula was affected by a low-pressure
system over northeastern China. The 850 hPa wind speed increased, and the wind direction changed
from southwest to northwest after January 1, 2014. Asian dust was observed from 02:30 KST 1 January
2014, and the ratios of PM2.5 to PM10 were mainly below 0.5 after this time.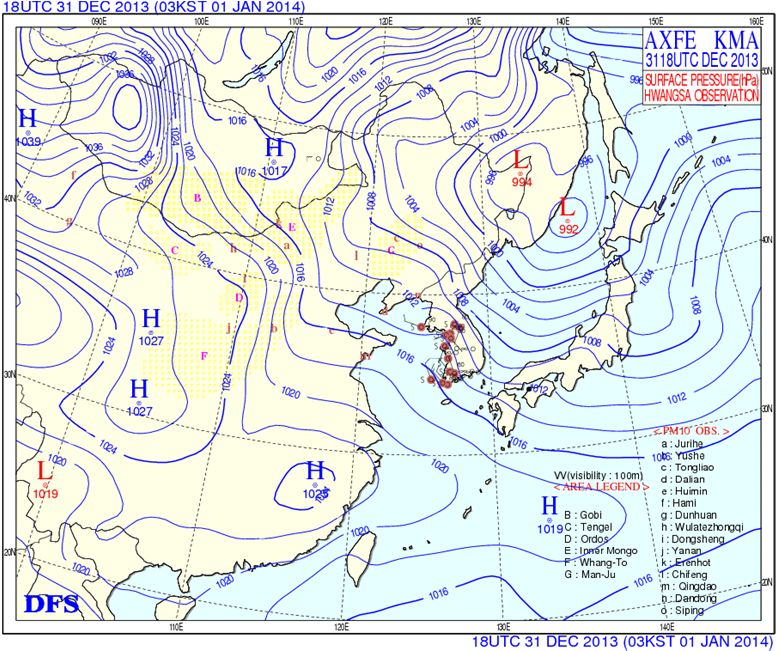
Atmosphere 2020, 11, 310 4 of 13
Figure 2. Time
Figure series
2. Time of (a)
series PMPM
of (a) 10 , 10PM 2.52.5, ,and
, PM andPM
PM1.0 massconcentrations;
1.0 mass concentrations;(b)(b)
PMPM 2.5 /PM
2.5/PM 10 ratio;
10 ratio; (c) wind
(c) wind
direction and and
direction wind speed
wind speed(–:(─:
surface (Seoul), 4:
surface(Seoul), △: 850 hPa
hPa(Osan));
(Osan));and
and(d)(d) humidity
humidity andand visibility
visibility from from
30 December
30 December20132013
to 2toJanuary
2 January 2014.2014.
Figure
Figure 2 presents
2 presents thethetemporal
temporal variations
variations ofofPM
PM10, PM 2.5, and,PM
10 , PM 2.5 and 1.0 mass
PM1.0concentrations; the ratio the
mass concentrations;
ratio of
ofPM
PM2.52.5totoPM
PM10; and the meteorological conditions (wind speed, wind direction, humidity, and
10 ; and the meteorological conditions (wind speed, wind direction, humidity,
visibility) from
and visibility) from3030December
December 2013 to 2toJanuary
2013 2014.2014.
2 January From From December 30 to the
December 30 morning of 31
to the morning of
December, the ratio of PM2.5 to PM10 exceeded 0.6, thus indicating that fine particles were
31 December, the ratio of PM2.5 to PM10 exceeded 0.6, thus indicating that fine particles were
predominant. The maximum concentration of PM10 during this period was 156 μg m–3. After 12:00
predominant. The maximum concentration of PM10 during this period was 156 µg m–3 . After 12:00
KST on 31 December, the concentration began to increase again and reached the highest value of
KST 279.7
on 31μgDecember,
m−3 between the concentration
00:00 - 03:00 KST 1 began
Januaryto(Figure
increase 2a). again and reached the highest value of
279.7 µg m −3 between 00:00 - 03:00 KST 1 January (Figure 2a).
Figure 2c, 2d shows that the wind speed increased while humidity decreased from 09:00 KST on
Figure 2c,d shows
31 December 2013. Inthat the wind
addition, speed
the mass increased while
concentration both PM humidity
10 and PMdecreased from 09:00
2.5 were increased, and theKST on
31 December
concentration2013. In of
ratio addition,
PM2.5/PMthe mass concentration
10 showed both PMafter
a tendency to increase 10 and
15:00PM 2.5 were
KST on 31 increased,
December and
Therefore, it was
the concentration ratio of PM2.5 /PM
determined that 10
theshowed
mass concentration
a tendencyoftoPM 10 was increased
increase relative
after 15:00 to PM
KST on and
31 2.5December
PM1.0 after
Therefore, it was 09:00 KST on 31 that
determined December
the mass2013.concentration of PM10 was increased relative to PM2.5 and
PM1.0 after 09:00 KST on 31 December 2013.
3.1. Aerosol Optical Properties
3.2. Aerosol Optical
Figure Properties
3a shows the means of AOD (500 nm), AE, and SSA (500 nm) retrieved from the sky
radiometer data for 31 December and 1 January. There was no sky radiometer observation on 30
Figure 3a shows the means of AOD (500 nm), AE, and SSA (500 nm) retrieved from the sky
December due to clouds. The daily mean AOD was 0.57 on 31 December 2013, which was higher by
radiometer data for 31 December and 1 January. There was no sky radiometer observation on 30
80% as compared to that on 1 January. The AE values were 1.03 and 0.48 on 31 December and 1
December due to clouds.indicating
January, respectively, The daily mean
that AOD
coarse was dominated
particles 0.57 on 31on December
1 January.2013, which was
The average valueshigher
by 80%
for as
SSA compared
were 0.90toand
that0.93
on for
1 January. The AE
31 December andvalues wererespectively.
1 January, 1.03 and 0.48 on 31types
Aerosol December
can beand 1
January, respectively,
classified using AEindicating that coarse
and SSA, which particles
determine dominated
the size onand
of aerosols 1 January. Theabsorbing/non-
distinguish average values for
absorbing
SSA were 0.90aerosols,
and 0.93respectively. Finer particles
for 31 December have a higher
and 1 January, AE, and more
respectively. absorbing
Aerosol typesaerosols
can be have
classified
a lower SSA. Black carbon is a well-known absorbing aerosol, but dust particles
using AE and SSA, which determine the size of aerosols and distinguish absorbing/non-absorbingalso appeared to be
solar absorbing aerosols [17]. Aerosol type classification for columnar aerosols was
aerosols, respectively. Finer particles have a higher AE, and more absorbing aerosols have a lower suggested by
SSA. Black carbon is a well-known absorbing aerosol, 4 but dust particles also appeared to be solar
absorbing aerosols [17]. Aerosol type classification for columnar aerosols was suggested by previous
studies [18–20]. This study adopted one of these aerosol type classification criteria, suggested in
Mielonen et al. [20]. Fine-mode aerosols are defined as having an AE greater than 1.2, while coarse-mode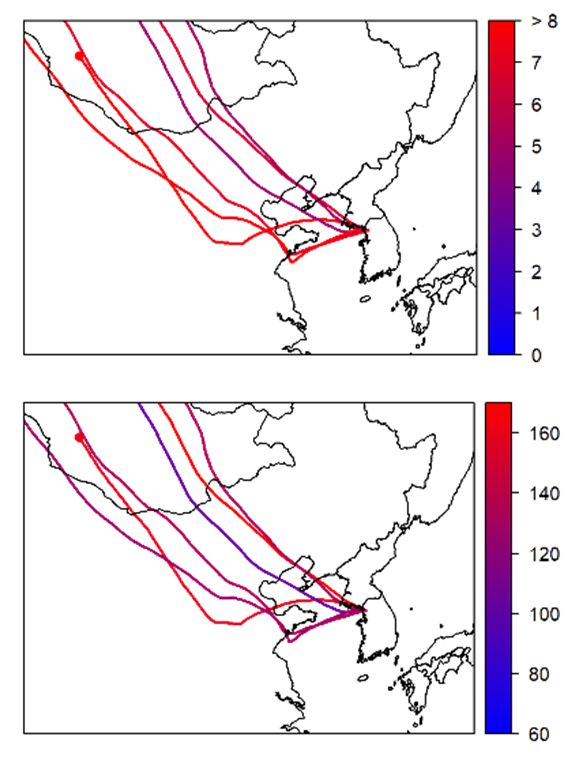
Atmosphere 2020, 11, 310 5 of 13
previous studies [18–20]. This study adopted one of these aerosol type classification criteria,
suggested in Mielonen et al. [20]. Fine-mode aerosols are defined as having an AE greater than 1.2,
aerosols arecoarse-mode
while defined asaerosols
having arean AE less as
defined than 0.8. an
having Aerosols
AE less between
than 0.8. these
Aerosolsthreshold
betweenvalues
these are
threshold
classified as a values are classified
“Mixture” mode. asThe
a “Mixture” mode. The
SSA threshold of SSA
0.95threshold
is used to of 0.95 is used toabsorbing
distinguish distinguishfrom
absorbing from
non-absorbing non-absorbing
aerosols. aerosols.
Values below 0.95Values
in the below
coarse0.95
modein the coarse“Dust”
indicate mode indicate “Dust”
and values and 0.95
above
values above 0.95 indicate “Uncertain” SSA values below 0.95 in the fine mode indicate
indicate “Uncertain” SSA values below 0.95 in the fine mode indicate “black carbon (BC),” and values “black carbon
(BC),” and values above 0.95 indicate “non-absorption (NA)” The dominant aerosol types on two
above 0.95 indicate “non-absorption (NA)” The dominant aerosol types on two days are shown in
days are shown in Figure 3b. The means of SSA for both days were similar, but SSAs on 1 January
Figure 3b. The means of SSA for both days were similar, but SSAs on 1 January were more scattered
were more scattered (0.73–0.95) than on 31 December. All data on 31 December were in the “Mixture”
(0.73–0.95) than
category on 31 December.
indicating All data
that both coarse andon 31particles
fine December were
exist, in the“Dust”
whereas “Mixture” category
was most indicating
frequently
that both coarse
detected on 1and fine particles exist, whereas “Dust” was most frequently detected on 1 January.
January.
Figure 3. (a)
Figure Aerosol
3. (a) Aerosoloptical
optical depth (500nm),
depth (500 nm), Ångström
Ångström Exponent,
Exponent, and Single
and Single Scattering
Scattering Albedo
Albedo (500
(500 nm)
nm) and
and (b) the
the frequency
frequencydistribution
distribution
of of aerosol
aerosol types
types from
from 31 December
31 December 2013 2013
and 1and 1 January
January 2014. 2014.
3.3. Ionic Concentrations
3.3. Ionic of Aerosols
Concentrations of Aerosols
The The concentrations
concentrationsofof the majorwater-soluble
the major water-soluble ionicionic species
species in PM10inwerePM10 were semi-
analyzed analyzed
continuously using the PILS-IC system to examine the chemical characteristics
semi-continuously using the PILS-IC system to examine the chemical characteristics of the aerosol of the aerosol
particles.
particles. TimeTime series
series variationsin
variations inthe
the concentrations
concentrations ofof
ionic species
ionic , NH+4,+,NH
(Na+(Na
species + 2+, Ca
K+, Mg + 2+, SO2+42−, 2+
4 , K , Mg , Ca ,
SO4 2−NO 2 , NO
− 3 , Cl− ) are
− shown in Figure 4a. Here, the concentrations of calcium carbonate and
− − −
, NO 2 , NO3 , Cl ) are shown in Figure 4a. Here, the concentrations of calcium carbonate and
magnesium carbonates were calculated as the soluble (sol) fractions of Ca and Mg and were added
magnesium carbonates were calculated as the soluble (sol) fractions of Ca and Mg and were added to
to the calculated CO32− concentrations [21]. The CO32− was calculated using Equation (1):
the calculated CO3 2− concentrations [21]. The CO3 2− was calculated using Equation (1):
CO32− = 2.5[Mgsol] + 1.5[Casol] (1)
2−
The concentrations of the ionic COspecies
3 = 2.5[Mg sol ] + 1.5[Ca
were ordered as NO3sol ]
− (12.43 μg m−3) > CO32− (6.89 μg m−3) (1)
> SOconcentrations
The 4 (6.82 μg m ) > NH4 (5.35 μg m ) > Ca (4.29 μg m ) > Cl
2− −3 + −3 2+
of the ionic species were ordered as NO3 − (12.43
−3 - (2.49 μg
µgmm−3
−3) > Na+ (1.78
) > CO3 2− μg m−3µg
(6.89 ) > m−3 )
K2−(1.29 μg m ) −3
+ −3 > NO2 (0.26+ μg m ) > Mg−3 (0.26 μg
− −3 2+ m ). The concentrations
−3 of NO3 , SO
− 4 , Ca +
2- 2+ , and
> SO4 (6.82 µg m ) > NH4 (5.35 µg m ) > Ca (4.29 µg m ) –3> Cl (2.49 µg m ) > Na (1.78 µg
2+ −3 - −3
NH4++were 2.28–25.37, 1.71–12.65, 0.03–8.26, and 0.03–11.67 μg m , respectively. In addition, the
m ) > K (1.29 µg m−3 ) −> NO2−2 − (0.26 µg
−3 m−3 ) > Mg2+ (0.26 µg m−3 ). The concentrations of NO3 − ,
concentrations of NO 3 , SO4 , and NH4+ were relatively high from 02:00 KST on 30 December to 08:00
SO4 2-KST
, Ca2+on, and NH4 + were
31 December. 2.28–25.37,
The 1.71–12.65,
concentrations of NO30.03–8.26,
− and CO32− and
were0.03–11.67
high from m–3 , respectively.
µg 09:00 KST on 31 In
addition, the concentrations − 2− +
December to 08:00 KST on 1ofJanuary.
NO3 , The SO4concentrations
, and NH4 ofwere relatively
Ca2+ and highhigh
CO32− were from 02:00
from KST
09:00 KSTon 30
December to 08:00toKST onKST 31 December. The concentrations of NO − and CO 2− were high from 09:00
on 1 January 10:00 on 2 January. Based on this analysis, the3 study period
3 was divided into
KST onthree31episodes:
December the to
haze08:00 KST
period on 1KST
(02:00 January. The concentrations
on 30 December to 08:00 KST ofon Ca31 2+ and CO3the
December), 2− mixed
were high
haze/Asian dust period (09:00 KST on 31 December to 08:00 KST on
from 09:00 KST on 1 January to 10:00 KST on 2 January. Based on this analysis, the study period 1 January), and the Asian dust was
period (09:00 KST on 1 January to 10:00 KST on 2 January). This chemical
divided into three episodes: the haze period (02:00 KST on 30 December to 08:00 KST on 31 December), characteristic was similar
to the haze/Asian
the mixed PM10 mass concentration,
dust periodthe ratioKST
(09:00 of the onPM /PM10, and optical
312.5December to 08:00 characteristics. Using these
KST on 1 January), and the
results, we investigated the chemical compositions, neutralization factors, and pollution sources of
Asian dust period (09:00 KST on 1 January to 10:00 KST on 2 January). This chemical characteristic was
the three episodes.
similar to the PM10 mass concentration, the ratio of the PM2.5 /PM10 , and optical characteristics. Using
these results, we investigated the chemical compositions, neutralization factors, and pollution sources
of the three episodes. 5
The composition ratios of the ionic species in PM10 during the study period are shown in Figure 4b.
The composition ratios of secondary inorganic aerosols (NH4 + , NO3 − , and SO4 2− ), soil (Ca2+ and
CO3 2− ), sea-salt (Na+ , Cl− , and Mg2+ ), and other species in PM10 during the study periods were 55.7%,
28.8%, 11.5%, and 4.10%, respectively. Their species ranges were 28.3–85.8%, 0.3–53.5%, 7.9–16.3%, and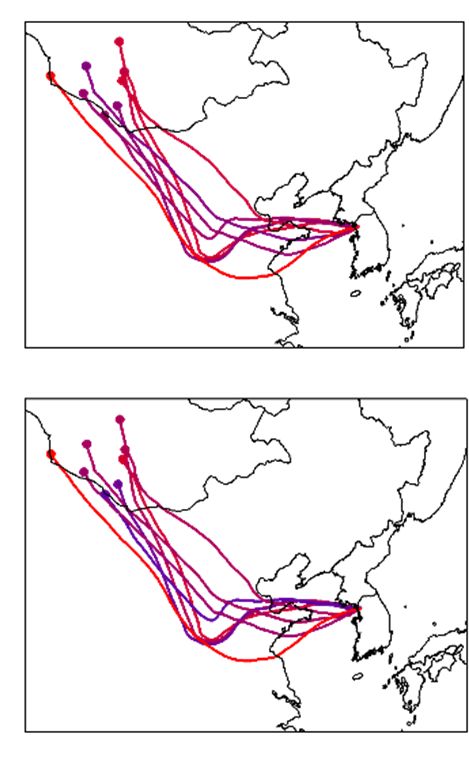
The composition ratios of the ionic species in PM10 during the study period are shown in Figure
4b. The composition ratios of secondary inorganic aerosols (NH4+, NO3−, and SO42−), soil (Ca2+ and
Atmosphere
CO 2020, 11, 310
32−), sea-salt (Na+, Cl−, and Mg2+), and other species in PM10 during the study periods were 55.7%,
6 of 13
28.8%, 11.5%, and 4.10%, respectively. Their species ranges were 28.3–85.8%, 0.3–53.5%, 7.9–16.3%,
and 0.9–12.6%, respectively. The composition ratios of the secondary inorganic aerosol species were
0.9–12.6%, respectively. The composition ratios of the secondary inorganic aerosol species were 80.2%,
80.2%, 57.0%, and 36.5%, and those of the soil species were 7.9%, 28.1%, and 44.6% of the total ionic
57.0%, and 36.5%, and those of the soil species were 7.9%, 28.1%, and 44.6% of the total ionic species
species for the haze, mixed haze/Asian dust, and Asian dust episodes, respectively. Sea-salt species
for the haze, mixed haze/Asian dust, and Asian dust episodes, respectively. Sea-salt species accounted
accounted for 9.9%, 10.8%, and 13.2%, while the others accounted for 1.9%, 4.2%, and 5.6% of the
for 9.9%,
haze, mixed10.8%, and 13.2%,
haze/Asian dust,while
and the others
Asian dustaccounted
episodes, for 1.9%, 4.2%,
respectively. and
The 5.6% of theratios
composition haze,of
mixed
haze/Asian dust, and Asian dust episodes, respectively. The composition ratios of secondary
secondary inorganic aerosol species were higher during the haze episode, whereas those of the soil inorganic
aerosol
and otherspecies were
species higher
were during
higher thethe
during haze episode,
Asian dust whereas
episode. those of the soil
In particular, COand other species were
32− was the most
higher during the Asian dust episode. In particular, CO 2− was the most dominant anion, and Ca2+
dominant anion, and Ca and Mg were major cations during
2+ 2+ 3 the mixed haze/Asian dust and Asian
and Mg 2+ were major cations during the mixed haze/Asian dust and Asian dust episodes.
dust episodes.
haze mixed haze/Asian dust Asian dust
80
(a)
CO32-
CO32- NO3-
NO3- SO42-
SO42- NH4
NH4+
+
NO2-
NO2- Ca2+
Ca2+ Cl-
Cl- K+
K+
Mg2+
Mg2+ Na+
Na+
60
Concentration (μg/m3)
40
20
0
Na+
Na+ Mg2+
Mg2+ K+
K+ Cl-
Cl- Ca2+
Ca2+ NO2-
NO2- NH4+
NH4+ SO42-
SO42- NO3-
NO3- CO32-
CO32-
(b)
100%
90%
80%
70%
Composition (%)
60%
50%
40%
30%
20%
10%
0%
14:00
15:00
16:00
17:00
18:00
19:00
20:00
21:00
22:00
23:00
10:00
11:00
12:00
13:00
14:00
15:00
16:00
17:00
18:00
19:00
20:00
21:00
22:00
23:00
10:00
11:00
12:00
13:00
14:00
15:00
16:00
17:00
18:00
19:00
20:00
21:00
22:00
23:00
10:00
0:00
1:00
2:00
3:00
4:00
5:00
6:00
7:00
8:00
9:00
0:00
1:00
2:00
3:00
4:00
5:00
6:00
7:00
8:00
9:00
0:00
1:00
2:00
3:00
4:00
5:00
6:00
7:00
8:00
9:00
12-30 12-31 01-01 01-02
Figure 4. Time series of 1 h averaged (a) ionic concentrations and (b) their ionic compositions during
the study period.
6
Figure 5 shows the 72 h air mass backward trajectories at a height of 500 m colored according to
the concentration of the ionic component pollutants. The backward trajectories were similar for the
haze and mixed haze/Asian dust episodes, while air masses for the Asian dust case seemed to move
faster than those for the other cases. NO3 − , SO4 2− , NH4 + , i.e., the anthropogenic pollutants, showed
elevated concentrations when the trajectories passed over the industrialized area in East China. During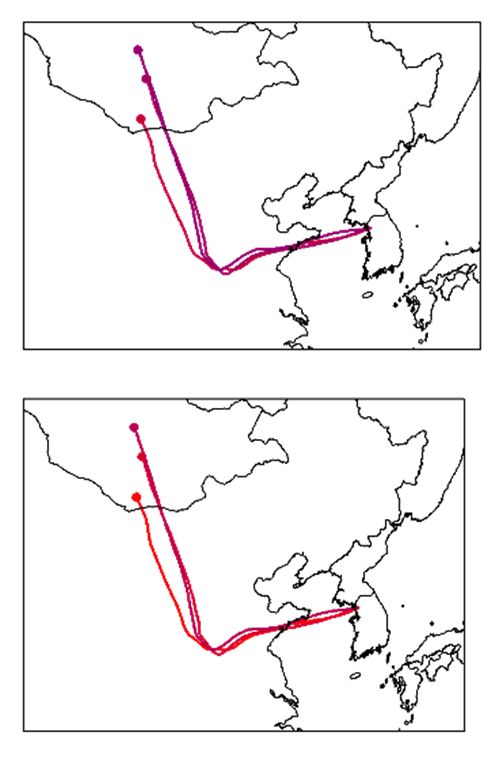
Figure 4. Time series of 1 h averaged (a) ionic concentrations and (b) their ionic compositions during the study
     period.
           Figure 5 shows the 72 h air mass backward trajectories at a height of 500 m colored according to
     the concentration of the ionic component pollutants. The backward trajectories were similar for the
     haze and mixed haze/Asian dust episodes, while air masses for the Asian dust case seemed to move
     faster2020,
Atmosphere   than11,those
                     310 for the other cases. NO3−, SO42−, NH4+, i.e., the anthropogenic pollutants, showed 7 of 13
     elevated concentrations when the trajectories passed over the industrialized area in East China.
     During the Asian dust episode, the air masses passed over Mongolia and Inner Mongolia, the major
the Asian
     Asian dust     episode,
            Dust source       the air
                          regions, andmasses  passed
                                       Ca2+ mainly    over Mongolia
                                                   originating from soiland
                                                                          dust Inner
                                                                               showedMongolia,  the major Asian
                                                                                      higher concentrations.
Dust source regions, and Ca2+ mainly originating from soil dust showed higher concentrations.

       species              (a) haze               (b) mixed haze/Asian                   (c) Asian dust
                                                           dust
        NO3−

        SO42−.

        NH4+

         Ca2+

        PM10

     Figure 5. 72 h HYSPLIT backward trajectories at a height of 500 m arriving at the Seoul, colored
     according                                                    −3 ) for the (a) haze, (b) mixed haze/Asian dust,
         Figureto5. the
                     72 hconcentration  of pollutants
                           HYSPLIT backward             (in µg
                                               trajectories at amheight  of 500 m arriving at the Seoul, colored
     and (c) Asian dust
         according   to theepisodes.
                            concentration of pollutants (in µg m−3) for the (a) haze, (b) mixed haze/Asian dust,
          and (c) Asian dust episodes.
3.4. Ammonium Salt Formation and Neutralization
                                                            7
     The secondary inorganic aerosol species, including SO4 2− , NO3 − , and NH4 + , often exist in various
forms, such as (NH4 )2 SO4 , NH4 HSO4 , and NH4 NO3 [22]. The ratios for (NH4 )2 SO4 and NH4 NO3 that
existed mainly in the ambient air could be calculated using Equations (2) and (3) [23].

                      [nss-SO4 2− ]eq /[NH4 + ]eq < 1, [(NH4 )2 SO4 ] = 1.38[nss-SO4 2− ]
                                                                                                                        (2)
                        [nss-SO4 2− ]eq /[NH4 + ]eq > 1, [(NH4 )2 SO4 ] = 3.67[NH4 + ]

                 [ex-NH4 + ] = [NH4 + ]−0.27[(NH4 )2 SO4 ],           [NH4 NO3 ] = 4.44 [ex-NH4 + ]                     (3)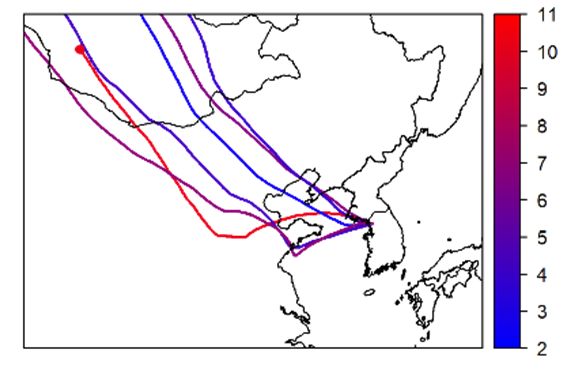
Atmosphere 2020, 11, 310 8 of 13
Figure 6 shows the concentrations of (NH4 )2 SO4 and NH4 NO3 estimated from the ionic analysis
and the neutralization factors caused by the reaction between inorganic acids and bases, such as
ammonia and calcium carbonate in PM10 aerosols. The estimated concentrations of (NH4 )2 SO4 in
Seoul were 12.6, 10.6, and 4.7 µg m–3 , and those of NH4 NO3 were 24.7, 16.6, and 1.5 µg m−3 for
the haze, mixed haze/Asian dust, and Asian dust episodes, respectively, indicating relatively high
concentrations in the haze period but lower concentrations in the Asian dust period. The estimated
concentrations of (NH4 )2 SO4 in PM10 at the Gosan, South Korea site were 22.9, 10.5, and 8.0 µg m−3 ,
and those of NH4 NO3 were 24.3, 0.1, and 0.09 µg m–3 for the haze, mixed haze/Asian dust, and Asian
dust, respectively [24].
60 2.5
NH NO
NH4NO3
4 3
(NH4)2SO4
(NH4)2SO4
50
NFNH3
NFNH3 2.0
NFCaCO3
NFCaCO3
40
Neutralization Factor (NF)
Concentration (μg/m3)
1.5
30
1.0
20
0.5
10
0 0.0
14:00
15:00
16:00
17:00
18:00
19:00
20:00
21:00
22:00
23:00
10:00
11:00
12:00
13:00
14:00
15:00
16:00
17:00
18:00
19:00
20:00
21:00
22:00
23:00
10:00
11:00
12:00
13:00
14:00
15:00
16:00
17:00
18:00
19:00
20:00
21:00
22:00
23:00
10:00
0:00
1:00
2:00
3:00
4:00
5:00
6:00
7:00
8:00
9:00
0:00
1:00
2:00
3:00
4:00
5:00
6:00
7:00
8:00
9:00
0:00
1:00
2:00
3:00
4:00
5:00
6:00
7:00
8:00
9:00
12-30 12-31 01-01 01-02
Figure 6. Time series variations of 1 h averaged estimated concentrations of (NH4 )2 SO4 and NH4 NO3
andFigure 6. Time series
neutralization variations
factors by NH3ofand
1 h CaCO
averaged estimated concentrations of (NH4)2SO4 and NH4NO3
3 during the high concentration episode.
and neutralization factors by NH3 and CaCO3 during the high concentration episode.
Generally, the acid compounds in the air are neutralized by basic ammonia and carbonate
3.5. Emission
compounds Sources
through theofreactions
Ambient Aerosols
between inorganic acids and base species, which are mostly ammonia
or soil components,
Table 1 showssuch as calciumcoefficients
the correlation carbonatebetween
and magnesium carbonate
the water-soluble ions[25,26].
in PM10The neutralization
aerosols. In the
results,
factors NH4+ was strongly
are presented in Figure correlated with SO42− in all
6. The neutralization haze by
factors (r =ammonia
0.880), mixed
werehaze/Asian
1.03, 0.81,dust
and (r = for
0.41
0.848),mixed
the haze, and Asian dust (r dust,
haze/Asian = 0.911)
and episodes. Strong
Asian dust correlations
episodes, were alsoMeanwhile,
respectively. found between NH4+ and
the neutralization
NOby
factors 3− in haze (rcarbonate
calcium = 0.783), mixed haze/Asian
were 0.16, dust
0.77, and (r =for0.971),
1.39, haze, and Asian
mixed dust (r =dust,
haze/Asian 0.969).
andCaAsian
2+ was
dust
strongly correlated
episodes, respectively. with CO 32− for all three episodes. These results suggest that (NH4)2SO4, NH4HSO4,
NH4NO3, and CaCO3 were the major chemical fractions in all three episodes.
It has been shown that the neutralization by ammonia was noticeably higher during the haze
episode Table
but decreased as the Asian dust episode began to occur. Conversely, the neutralization
1. Correlation between the ionic species during the (a) haze, (b) mixed haze/Asian dust, and (c)
by calcium carbonate increased
Asian dust episodes. during the Asian dust episode. Interestingly, the neutralization by
ammonia and calcium carbonate were reversed during the haze and mixed haze/Asian dust episodes.
(a) Haze
Therefore, it is thought that the concentrations of ammonium sulfate and ammonium nitrate would
Species Na+ NH4+ K+ Mg2+ Ca2+ Cl− NO2− NO3− SO42− CO32−
increase during the haze episode, while the soil-originated CaCO3 would increase during the Asian
Na+ 1.000
dust episode.
NH4+ 0.268 1.000
K
3.5. Emission Sources of0.737
+ 0.471 Ambient1.000
Aerosols
Mg2+ 0.863 0.441 0.530 1.000
Table
Ca 2+ 1 shows
0.450
the correlation
0.645
coefficients
0.404 0.631
between
1.000
the water-soluble ions in PM10 aerosols. In the
results,ClNH + was strongly 2− all haze (r = 0.880), mixed haze/Asian dust
− 4 0.276 0.200 correlated
0.062 with SO
0.158 4
0.543 in 1.000
NO2− −0.232 −0.514 −0.302 −0.334 −0.827 −0.683 1.000
NO3− 0.142 0.783 0.632 0.351 0.231 −0.352 0.056 1.000
SO42− 0.342 0.880 0.650 0.486 0.773 0.358 −0.773 0.470 1.000
CO32− 0.473 0.647 0.415 0.654 1.000 0.536 −0.819 0.239 0.773 1.000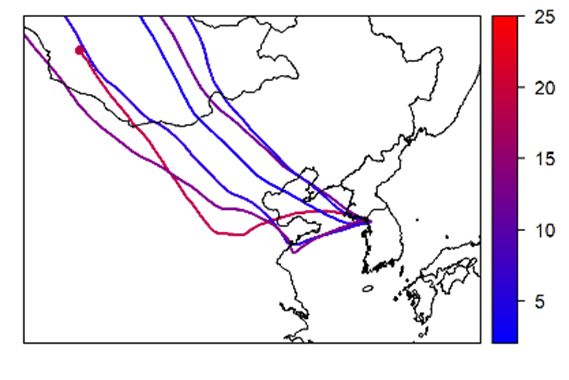
Atmosphere 2020, 11, 310                                                                                    9 of 13

(r = 0.848), and Asian dust (r = 0.911) episodes. Strong correlations were also found between NH4 +
and NO3 − in haze (r = 0.783), mixed haze/Asian dust (r = 0.971), and Asian dust (r = 0.969). Ca2+ was
strongly correlated with CO3 2− for all three episodes. These results suggest that (NH4 )2 SO4 , NH4 HSO4 ,
NH4 NO3 , and CaCO3 were the major chemical fractions in all three episodes.

      Table 1. Correlation between the ionic species during the (a) haze, (b) mixed haze/Asian dust,
      and (c) Asian dust episodes.

                                                       (a) Haze
     Species     Na+       NH4 +      K+      Mg2+       Ca2+         Cl−   NO2 −    NO3 −    SO4 2−   CO3 2−
      Na+       1.000
     NH4 +      0.268       1.000
       K+       0.471       0.737     1.000
     Mg2+       0.863       0.441     0.530   1.000
      Ca2+      0.450       0.645     0.404   0.631      1.000
      Cl−       0.276       0.200     0.062   0.158      0.543    1.000
     NO2 −      −0.232     −0.514    −0.302   −0.334    −0.827    −0.683     1.000
     NO3 −      0.142       0.783     0.632   0.351      0.231    −0.352     0.056   1.000
     SO4 2−     0.342       0.880     0.650   0.486      0.773    0.358     −0.773   0.470    1.000
     CO3 2−     0.473       0.647     0.415   0.654      1.000    0.536     −0.819   0.239    0.773    1.000
                                              (b) Mixed haze/Asian dust
     Species     Na+       NH4   +    K+      Mg2+       Ca2+         Cl−   NO2 −    NO3 −    SO4 2−   CO3 2−
      Na+       1.000
     NH4 +      0.071       1.000
       K+       0.439       0.107     1.000
     Mg2+       0.777      −0.314     0.663   1.000
      Ca2+      0.609      −0.223     0.526   0.838      1.000
      Cl−       0.117       0.700    −0.077   −0.368    −0.321     1.000
     NO2 −      −0.158      0.188    −0.536   −0.440    −0.069     0.324    1.000
     NO3 −      0.212       0.971     0.260   −0.144    −0.131     0.605    0.053     1.000
     SO4 2−     0.415       0.848     0.436   0.190      0.254    0.427     −0.069    0.904   1.000
     CO3 2−     0.626      −0.231     0.540   0.857      0.999    −0.327    −0.094   −0.133   0.252    1.000
                                                     (c) Asian dust
     Species     Na+       NH4   +    K+      Mg2+       Ca2+         Cl−   NO2 −    NO3 −    SO4 2−   CO3 2−
       Na+      1.000
      NH4 +     0.538       1.000
       K+       −0.063      0.702    1.000
      Mg2+      −0.785     −0.098    0.419    1.000
      Ca2+      0.947       0.573    0.100    −0.744     1.000
       Cl-      0.901       0.743    0.203    −0.644     0.888    1.000
      NO2 −     −0.844     −0.284    0.116    0.764     −0.871    −0.753     1.000
      NO3 -     0.695       0.969    0.579    −0.258     0.709    0.848     −0.438   1.000
      SO4 2-    0.760       0.911    0.564    -0.347     0.824    0.849     -0.556   0.955    1.000
      CO3 2-    0.912       0.649    0.226    -0.618     0.985    0.879     -0.828   0.768    0.880    1.000

     Principal component analysis (PCA) was applied to estimate the major emission sources of aerosol
components [27]. PCA is the most common multivariate statistical method applied in environmental
studies. The Statistical Package for the Social Sciences (SPSS) software (version 18.0) was used for the
multivariate analysis. We applied PCA for the water-soluble ions analyzed during the episodes for
source attribution. The varimax rotated factors of the loading matrix are presented in Table 2.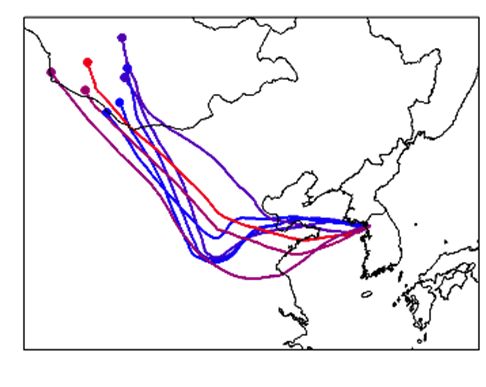
Atmosphere 2020, 11, 310                                                                                               10 of 13

      Table 2. Principal component analysis results for water-soluble species during the haze, mixed
      haze/Asian dust, and Asian dust episodes, with loading > 0.5 in bold. The analysis used a varimax
      rotation with Kaiser normalization.

                                   Haze                    Mixed haze/Asian Dust                   Asian Dust
            Species
                           PC 1    PC 2    PC 3    PC 1        PC 2    PC 3        PC 4    PC 1      PC 2       PC 3
      Na+                  0.171           0.951   0.702      0.155    0.166       0.624   0.830     0.450
      NH4 +                0.429   0.875   0.100              0.973                        0.186     0.963      0.154
      K+                   0.145   0.752   0.380   0.531      0.302    0.651                         0.649      0.712
      Mg2+                 0.238   0.301   0.889   0.866               0.421       0.178                        0.511
      Ca2+                 0.825   0.323   0.346   0.985                                   0.888     0.437
      Cl−                  0.823           0.113              0.602                0.586   0.682     0.669
      NO2 −
      NO3 −                        0.941   0.105              0.978                0.105   0.350     0.929
      SO4 2−               0.672   0.659   0.148   0.295      0.928    0.120               0.519     0.824      0.176
      CO3 2−               0.813   0.326   0.372   0.987                                   0.840     0.507
      Eigenvalue            3.7    3.1     2.2     3.7          3.3     1.7        0.8     4.7        4.0       0.9
      Variance (%)         36.9    30.5    21.6    36.8        32.7     16.6       8.0     46.7       40.0      9.4
      Cumulative (%)       36.9    67.5    89.0    36.8        69.6     86.2       94.2    46.7       86.7      96.2

     In the haze episode, the first three principal components with eigenvalues greater than one were
extracted; they accounted for 89.0% of the total variance. The first principal component (PC1), which
explained 36.9% of the total variance with an eigenvalue of 3.7 was mostly dependent on Ca2+ , Cl− ,
SO4 2− , and CO3 2− . The Ca2+ and CO3 2− species are considered to be soil dust sources [28], while
SO4 2− and Cl− are typically produced by waste incinerators [29]. This indicates that PC1 is associated
with soil dust and emissions from waste incinerators. The second principal component, PC2 accounted
for 30.5% of the total variance and showed high loadings for NH4 + , SO4 2− , NO3 − , and K+ . Because
K+ is regarded as a tracer for biomass burning [30], PC2 can be associated with secondary aerosols
mixed with biomass-burning aerosols [31]. SO4 2− showed a significant loading on both PC1 and
PC2 indicating composite sources. Finally, PC3 explained 21.6% of the total variance, which was
dominated by Na+ and Mg2+ . A strong correlation between Na+ and Mg2+ indicates that Na+ and
Mg2+ had the same origin Table 1a. Thus, the major sources of PC3 were natural minerals characteristics
(Figure 7a) [32].
     In the mixed haze/Asian dust episode, four principal components were identified and accounted
for 94.2% of the total variance. PC1, accounting for 36.8% of the total variance was heavily loaded
by Na+ , Mg2+ , Ca2+ , and CO3 2− , with loadings of 0.702, 0.866, 0.985, and 0.987, respectively. Mg2+ ,
Ca2+ , and CO3 2− are regarded as tracers for soil dust sources from natural and a variety of crustal
minerals [33]. The high correlation between Na+ and Mg2+ (r = 0.777) indicates that Na+ and Mg2+
share the same origin Table 1b. PC2 showed high loadings of the three secondary ions as well as Cl-
indicating that the secondary pollutants originated from fossil fuel combustion and other anthropogenic
sources [31]. The loading of K+ on PC3 (16.6% of the total variance) mainly originated from biomass
burning. PC4, which explained another 8.0% of the total variance grouped Na+ and Cl− and appears
to represent the sea-salt source (Figure 7b) [34].
     Three principal components that explained 96.2% of the total variance were identified in the Asian
dust episode. PC1, with 46.7% of the total variance, was loaded with Na+ , Ca2+ , Cl− , and CO3 2− , with
values of 0.830, 0.888, 0.682, and 0.840, respectively, indicating the presence of a mixture of sea-salt
aerosols and soil dust. PC2, accounting for 40.0% of the variance was mainly affected by NH4 + (0.963),
K+ (0.649), Cl− (0.669), NO3 − (0.929), and SO4 2− (0.824). NO3 − , SO4 2− , and NH4 + are the typical
tracers of secondary origins, and Cl- and K+ are emitted mainly from coal combustion and biomass
burning [33]. PC3 accounted for 9.4% of the total variance and was strongly loaded with K+ and Mg2+ .
These are regarded as tracers for crustal and construction dusts (Figure 7c).
Atmosphere 11, 310
2020,2019,
Atmosphere 10, x FOR PEER REVIEW 1 11 of 13
of 16
(a) (b) others
5.8%
others Sea-salt
11.0% 8.0%
Waste
incineraton Soil &
Crustal and soil crustal
Biomass
mineral dusts
dust burning
dusts 36.8%
21.6% 36.9% 16.6%
Secondary Secondary
aerosol pollution
from fossil
with
fuel
biomass
combustion
burning
32.7%
30.5%
(c)
Secondary Mineral dust others
aerosol 9.4% 3.8%
with
biomass
burning &
coal
combustion
40.0%
Sea-salt
and soil
dust
46.7%
Figure
Figure Source
7. 7. apportionments
Source apportionmentsofofwater-soluble
water-soluble species in each
species in each episode:
episode: (a)(a)haze,
haze,(b)(b)mixed
mixed
haze/Asian
haze/Asian dust,
dust, andand
(c)(c) Asian
Asian dust.
dust.
4. Conclusions
Through optical analyses using the sky radiometer, aerosol types were classified as “Mixture” and
“Dust” particles for 31 December 2013 and 1 January 2014, respectively. The secondary inorganic aerosol
species (NH4 + , NO3 − , and SO4 2− ) during the haze episode had relatively higher concentrations (80.2%)
as compared to the other episodes. In addition, the composition ratios of soil (Ca2+ and CO3 2− ) were
3.6 and 5.6 times increased in both the mixed haze/Asian dust and Asian dust episodes, respectively.
The NH4 NO3 content was higher than (NH4 )2 SO4 during the haze, but it was relatively low during
the Asian dust episode. Comparing the high aerosol concentration episodes, the neutralization by
ammonia was noticeably higher during the haze episode, and calcium carbonate was more prominent
during the Asian dust episode. The backward trajectories analysis indicated that the concentrations of
the secondary inorganic aerosol species (NH4 + , NO3 − , and SO4 2− ) were higher when the air masses
moved over the industrialized area in East China. However, when the air mass was transported over
Mongolia and Inner Mongolia during the Asian dust episode, the concentration of Ca2+ species was
relatively higher. The neutralization factors of ammonia were 1.03, 0.81, 0.41, respectively, for the haze,
mixed haze/Asian dust, and Asian dust episodes. Moreover, the neutralization factors of calcium
carbonate were 0.16, 0.77, 1.39, respectively. Based on PCA, the haze episode compositions might be
influenced by a mixture of soil dust and emissions from waste incinerators, a mixture of secondary
aerosols and biomass burning, and crustal mineral dust. The compositions of the mixed haze/Asian
dust period were most affected by a mixture of soil and crustal dusts, followed by secondary pollutants
from fuel combustion, biomass burning, and sea-salt emissions. Moreover, a mixture of sea-salts andAtmosphere 2020, 11, 310 12 of 13
soil dust, a mixture of secondary aerosols with biomass burning and coal combustion, and mineral
dust were the potential sources in the Asian dust episode.
Author Contributions: Conceptualization, H.-J.K. and J.-M.S.; methodology, H.-J.K., S.J.S., and J.E.K.; software,
S.J.S.; validation, H.-J.K. and J.-M.S.; formal analysis, H.-J.K. and S.J.S.; investigation, J.W.C.; writing—original
draft preparation, H.-J.K. and J.-M.S.; writing—review and editing, H.-J.K., S.J.S., J.E.K., and J.M.S. All authors
have read and agreed to the published version of the manuscript.
Funding: This work was funded by the Korea Meteorological Administration Research and Development Program
“Development of Asian Dust and Haze Monitoring and Prediction Technology” under Grant (1365003013).
Acknowledgments: The authors would like to thank technical and scientific staff members of the Seoul
Meteorological Station and collocated Seoul Hwangsa Monitoring Centre and for their efforts to collect
meteorological and aerosol data.
Conflicts of Interest: The authors declare no conflict of interest.
References
1. Heal, M.R.; Kumar, P.; Harrison, R.M. Particles, air quality, policy and health. Chem. Soc. Rev. 2012, 41,
6606–6630. [CrossRef]
2. Jiang, J.; Zhou, W.; Cheng, Z.; Wang, S.; He, K.; Hao, J. Particulate matter distributions in China during a
winter period with frequent pollution episodes (January 2013). Aerosol Air Qual. Res. 2015, 15, 494–503.
[CrossRef]
3. Gautam, R.; Hsu, N.C.; Lau, K.M. Premonsoon aerosol characterization and radiative effects over the
Indo-Gangetic plains: Implications for regional climate warming. J. Geophys. Res. 2010, 115, D17208.
[CrossRef]
4. Jacobson, M.Z. Strong radiative heating due to mixing state of black carbon on atmospheric aerosols. Nature.
2001, 409, 695–697. [CrossRef]
5. Seinfeld, J.H.; Carmichael, G.R.; Arimoto, R.; Conant, W.C.; Brechtel, F.J.; Bates, T.S.; Cahill, T.A.; Clarke, A.D.;
Doherty, S.J.; Flatau, P.J.; et al. ACE-ASIA—Regional climatic and atmospheric chemical effects of Asian dust
and pollution. Bull. Am. Meteorol. Soc. 2004, 85, 367–380. [CrossRef]
6. Aldabe, J.; Elustondo, D.; Santamaría, C.; Lasheras, E.; Pandolfi, M.; Alastuey, A.; Querol, X.; Santamaría, J.M.
Chemical characterization and source apportionment of PM2.5 and PM10 at rural, urban and traffic sites in
Navarra (North of Spain). Atmos. Res. 2011, 102, 191–205. [CrossRef]
7. Guo, H.; Ding, A.J.; So, K.L.; Ayoko, G.; Li, Y.S.; Hung, W.T. Receptor modeling of source apportionment of
Hong Kong aerosols and implication of urban and regional contribution. Atmos. Environ. 2009, 43, 1159–1169.
[CrossRef]
8. Xu, L.; Chen, X.; Chen, J.; Zhang, F.; He, C.; Du, K.; Wang, Y. Characterization of PM10 atmospheric aerosol
at urban and urban background sites in Fuzhou city, China. Environ. Sci. Pollut. Res. 2012, 19, 1443–1453.
[CrossRef]
9. Watson, J.G.; Zhu, T.; Chow, J.C.; Engelbrecht, J.; Fujita, E.M.; Wilson, W.E. Receptor modeling application
framework for particle source apportionment. Chemosphere 2002, 49, 1093–1136. [CrossRef]
10. Wagstrom, K.M.; Pandis, S.N. Source–receptor relationships for fine particulate matter concentrations in the
Eastern United States. Atmos. Environ. 2011, 45, 347–356. [CrossRef]
11. Amil, N.; Latif, M.T.; Khan, M.F.; Mohamad, M. Seasonal variability of PM2.5 composition and sources in the
Klang Valley urban-industrial environment. Atmos. Chem. Phys. 2016, 16, 5357–5381. [CrossRef]
12. Ho, K.F.; Cao, J.J.; Lee, S.C.; Chan, C.K. Source apportionment of PM2.5 in urban area of Hong Kong. J. Hazard.
Mater. 2006, 138, 73–85. [CrossRef] [PubMed]
13. Hopke, P.K.; Gladnet, E.S.; Gordon, G.E.; Zoller, W.H.; Jones, A.G. The use of multivariate analysis to identify
sources of selected elements in the Boston aerosol. Atmos. Environ. 1976, 10, 1015–1025. [CrossRef]
14. Uno, I.; Yuminoto, K.; Osada, K.; Wang, Z.; Pan, X. Dust acid uptake analysis during long-lasting dust and
pollution episodes over east Asia based on synergetic observation and chemical transport model. SOLA
2017, 13, 109–113. [CrossRef]
15. Lim, Y.K.; Kim, J.; Lee, H.C.; Lee, S.S.; Cha, J.W.; Ryoo, S.B. Aerosol Physical Characteristics over the Yellow
Sea During the KORUS-AQ Field Campaign: Observation and Air Quality Model Simulations. Asia-Pacific J.
Atmos. Sci. 2019, 55, 629–640. [CrossRef]Atmosphere 2020, 11, 310 13 of 13
16. Nakajima, T.; Tonna, G.; Rao, R.; Kaufman, Y.; Holben, B. Use of sky-brightness measurements from ground
for remote sensing of particulate poly dispersions. Appl. Opt. 1996, 35, 2672–2686. [CrossRef]
17. Sohn, B.J.; Nakajima, T.; Chun, H.W.; Aoki, K. More Absorbing Dust Aerosol Inferred from Sky Radiometer
Measurements at Anmyeon, Korea. J. Meteorol. Soc. Jpn. 2007, 85, 815–823. [CrossRef]
18. Lee, J.; Kim, J.; Song, C.H.; Kim, S.B.; Chun, Y.; Sohn, B.J.; Holben, B.N. Characteristics of aerosol types from
AERONET sunphotometer measurements. Atmos. Environ. 2010, 44, 3110–3117. [CrossRef]
19. Kim, J.; Lee, J.H.; Lee, H.C.; Higurashi, A.; Takemura, T.; Song, C.H. Consistency of the aerosol type
classification from satellite remote sensing during the ABC EAREX campaign. J. Geophys. Res. 2007, 112,
D22S33. [CrossRef]
20. Mielonen, T.; Arola, A.; Komppula, M.; Kukkonen, J.; Koskinen, J.; De Leeuw, G.; Lehtinen, K.E.J. Comparison
of CALIOP level 2 aerosol subtypes to aerosol types derived from AERONET inversion data. Geophys. Res.
Lett. 2009, 36, L18804. [CrossRef]
21. Kchih, H.; Perrino, C.; Cherif, S. Investigation of desert dust contribution to source apportionment of PM10
and PM2.5 from a Southern Mediterranean Coast. Aerosol Air Qual. Res. 2015, 15, 454–464. [CrossRef]
22. Xu, H.; Bi, X.H.; Zheng, W.W.; Wu, J.H.; Feng, Y.C. Particulate matter mass and chemical component
concentrations over four Chinese cities along the western Pacific coast. Environ. Sci. Pollut. Res. 2015, 22,
1940–1953. [CrossRef] [PubMed]
23. Rogula-Kozłowska, W.; Klejnowski, K.; Rogula-Kopiec, P.; Ośródka, L.; Krajny, E.; Błaszczak, B.; Mathews, B.
Spatial and seasonal variability of the mass concentration and chemical composition of PM2.5 in Poland.
Air Qual. Atmos. Health. 2014, 7, 41–58. [CrossRef] [PubMed]
24. Ko, H.J.; Song, J.M.; Cha, J.W.; Kim, J.; Ryoo, S.B.; Kang, C.H. Chemical composition characteristics of
atmospheric aerosols in relation to haze, Asian dust and mixed haze-Asian dust episodes at Gosan Site in
2013. J. Kor. Soc. Atmos. Environ. 2016, 32, 289–304. [CrossRef]
25. Seinfeld, J.H.; Pandis, S.N. Atmospheric Chemistry and Physics: From Air Pollution to Climate Change; John Wiley
& Sons, Inc.: New York, NY, USA, 1998.
26. Satsangi, A.; Pachauri, T.; Singla, V.; Lakhani, A.; Maharaj Kumari, K. Water soluble ionic species in
atmospheric aerosols: Concentrations and Sources at Agra in the Indo-Gangetic Plain (IGP). Aerosol Air Qual.
Res. 2013, 13, 1877–1889. [CrossRef]
27. Harrison, R.M.; Smith, D.T.J.; Luhana, L. Source apportionment of atmospheric polycyclic aromatic
hydrocarbons collected from an urban location in Birmingham, UK. Environ. Sci. Technol. 1996, 30,
825–832. [CrossRef]
28. Koçak, M.; Theodosi, C.; Zarmapas, P.; Im, U.; Bougiatioti, A.; Yenigun, O.; Mihalopoulos, N. Particulate
matter(PM10 ) in Istanbul: Origin, source areas and potential impact on surrounding regions. Atmos. Environ.
2011, 45, 6891–6900. [CrossRef]
29. Mustaffa, N.I.H.; Latif, M.T.; Ali, M.M.; Khan, M.F. Source apportionment of surfactants in marine aerosols at
different locations along the Malacca Straits. Environ. Sci. Pollut. Res. 2014, 21, 6590–6602. [CrossRef]
30. Deshmukh, D.K. Characterization of dicarboxylates inorganic ions in urban PM10 aerosols in the Eastern
Central India. Aerosol Air Qual. Res. 2012, 12, 592–607. [CrossRef]
31. Yin, L.; Niu, Z.; Chen, X.; Chen, J.; Zhang, F.; Xu, L. Characteristics of water-soluble inorganic ions in PM2.5
and PM2.5 -10 in the coastal urban agglomeration along the western Taiwan Strait Region, China. Environ. Sci.
Pollut. Res. 2014, 21, 5141–5156. [CrossRef]
32. Khamkaew, C.; Chantara, S.; Janta, R.; Pani, S.K.; Prapamontol, T.; Kawichai, S.; Wiriya, W.;
Lin, N.H. Investigation of Biomass Burning Chemical Components over Northern Southeast Asia during
7-SEAS/BASELInE 2014 Campaign. Aerosol Air Qual. Res. 2016, 16, 2655–2670. [CrossRef]
33. Meng, C.C.; Wang, L.T.; Zhang, F.F.; Wei, Z.; Ma, S.M.; Ma, X.; Yang, J. Characteristics of concentrations and
water-soluble inorganic ions in PM2.5 in Handan City, Hebei province, China. Atmos. Res. 2016, 171, 133–146.
[CrossRef]
34. Gao, Y.; Lee, S.C.; Huang, Y.; Chow, J.C.; Watson, J.G. Chemical characterization and source apportionment
of size-resolved particles in Hong Kong sub-urban area. Atmos. Res. 2016, 170, 112–122. [CrossRef]
© 2020 by the authors. Licensee MDPI, Basel, Switzerland. This article is an open access
article distributed under the terms and conditions of the Creative Commons Attribution
(CC BY) license (http://creativecommons.org/licenses/by/4.0/).You can also read