DENSITY DISTRIBUTION OF SEVERAL MAJOR WHALE SPECIES IN THE INDO-PACIFIC REGION OF ANTARCTIC USING JARPA AND JARPAII SIGHTING DATA OBTAINED THROUGH ...
←
→
Page content transcription
If your browser does not render page correctly, please read the page content below
DENSITY DISTRIBUTION OF ANTARCTIC WHALES

Full paper

    DENSITY DISTRIBUTION OF SEVERAL MAJOR
    WHALE SPECIES IN THE INDO-PACIFIC REGION
     OF ANTARCTIC USING JARPA AND JARPAII
       SIGHTING DATA OBTAINED THROUGH
            1987/88 –2008/09 SEASONS

                          Koji MATSUOKA* and Takashi HAKAMADA
                Institute of Cetacean Research, 4 – 5 Toyomi-cho, Chuo-ku, Tokyo 104 – 0055, Japan
                                  (*Corresponding author: matsuoka@cetacean.jp)

                                                   Abstract
           This paper examined the geographical distribution of several whale species in the Indo-
        Pacific region of the Antarctic during the austral summer. The analyses were based on sighting
        data collected systematically by JARPA and JARPAII surveys in the longitudinal sector of
        35°E – 145°W, south of 60°S, between 1987/88 and 2008/09. The searching effort comprised a
        total of 353,134 n.miles. The Antarctic minke whale was the species most frequently sighted,
        followed by killer, humpback, unidentified beaked, fin, sperm, southern bottlenose, blue, south-
        ern right and sei whales. Density index of whales (DIW: no. of individuals sighted/100 n.miles)
        was calculated using all primary effort and sightings data and its geographical distribution plot-
        ted on maps with Lat. 1 degree × Long. 1 degree squares for each species. These maps are more
        detailed compared to those of the previous maps which used 5° × 5°squares in the 1960s. The
        geographical distribution was described for each whale species together with some features of
        their distribution. For example, sei, dwarf minke, humpback and southern bottlenose whales
        were not sighted in the Ross Sea, distribution areas of southern right whales were limited to the
        sector 80°E and 135°E, and high-density areas of humpback whales were observed between
        80°E and 110°E. The large scale and long-term sighting data set has made a substantial contri-
        bution to understanding the geographical distribution patterns and habitat use of whales in the
        Antarctic ecosystem.

        Key words: Antarctic, distribution, baleen whales, toothed whales.

                                                 Introduction

   One of the main sources of large scale and long-term sighting data for assessing the population
status of whale species in the Antarctic is the JARPA (Japanese Whale Research Program under Special
Permit in the Antarctic), the first phase of which was conducted between 1987/88 and 2004/05, with
its second phase, JARPAII (sighting component), conducted between 2005/06 and 2008/09. One of
the features of JARPA and JARPAII is that, unlike the IWC/IDCR (International Whaling Commission/
International Decade for Cetacean Research)-SOWER (Southern Ocean Whale and Ecosystem
Research) programmes conducted from 1978/79 to 2009/10 (Matsuoka et al., 2003a), surveys have
been repeated in the same area and in the same months every second season over a long period. Cur-

Cetacean Population Studies (CPOPS)
Vol. 2, 2020, 15-38                                                                                          15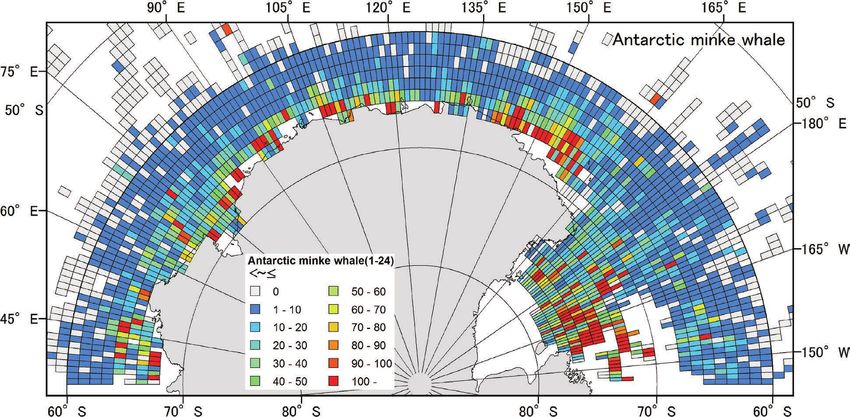
MATSUOKA AND HAKAMADA

rent distribution maps are more detailed for each Area compared to those of the IDCR/SOWER maps
which had covered the area only three times for each set of circumpolar data on whales. Therefore,
the JARPA and JARPAII surveys facilitate description of the extent of detailed local distribution of
whales.
  The sighting data collected during the JARPA and JARPAII have been used for studying the distri-
bution patterns and estimated abundance of several large whale species (Kishino et al., 1991;
Kasamatsu et al., 2000; Matsuoka et al., 2003b, 2011; Branch et al., 2004; Murase et al., 2002, 2014).
  The objective of this study was to investigate the geographical distribution patterns of large whale
species in the Indo-Pacific region of the Antarctic during the austral summer feeding season. The study
was based on sighting data collected systematically by the JARPA and JARPAII surveys.

                                           Materials and Methods

Research area
   The research area comprised the Indo-Pacific region of the Antarctic every year, specifically the IWC
Management Areas IIIE (35° – 70°E), IV (70° – 130°E), V (130°E – 170°W) and VIW (170° – 145°W),
south of 60°S (Fig. 1). Each individual survey was conducted from December to March during austral
summer (Fig. 2).
   These Areas were divided into two sectors (western sector and eastern sector). Each sector was also
divided into two strata (northern and southern strata), along the 60°S latitude line to the line of 45 n.miles
from the ice-edge (northern stratum), and ice-edge to 45 n.miles from the ice-edge line (southern stratum),
except for the Prydz Bay and the Ross Sea regions. The Prydz Bay is defined as south of 66°S, and the
Ross Sea is defined as south of 69°S. There are no stratifications for Areas IIIE and VIW in JARPA. In
JARPAII, there are stratifications for Areas IIIE and VIW which are the same as in Area IV (Fig. 3).

Fig. 1. The main research area of the JARPA and JARPAII surveys between 35°E and 145°W, south of 60°S with
  searching efforts (red lines) in the period 1987/88–2008/09, including the transit sighting surveys between low
  latitude and Antarctic regions with the IWC Antarctic Areas for the management of baleen whales (except
  Bryde’s whale).

                                                                           Cetacean Population Studies (CPOPS)
16                                                                                           Vol. 2, 2020, 15-38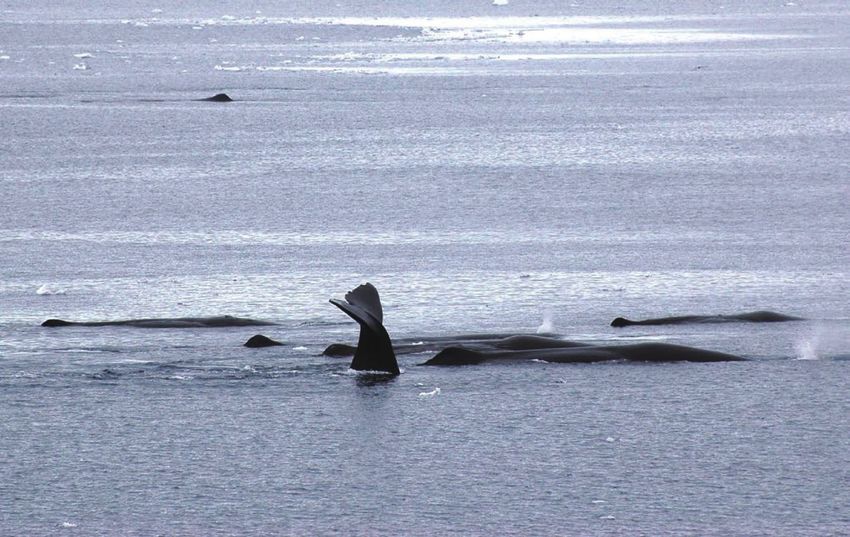
DENSITY DISTRIBUTION OF ANTARCTIC WHALES

Sighting data
  The collection procedures and analyses of sighting data that have been used in JARPA are very
similar to those used in IWC/IDCR-SOWER cruises. Activities aboard the ship are classified into two
principal groups: On-effort and Off-effort. On-effort activities are times when full search effort is being
executed and conditions (such as weather and sea conditions) are within acceptable parameters to
conduct research. Off-effort activities are all activities that are not On-effort. All sightings recorded
while the ship is On-effort are classified as Primary sightings. All other sightings are Secondary sight-
ings.
  Primary search effort is only conducted in acceptable weather conditions. These conditions are
defined as visibility better than 2.0 n.miles, with wind speed less than 20 knots and Beaufort sea state
less than 6. These conditions are used as guidelines; in some circumstances, less severe conditions
may still be inappropriate for search effort. The sighting procedure in JARPAII (2005/06 – 2008/09)
did not differ substantially from JARPA (Hakamada et al., 2006; Nishiwaki et al., 2014).
  The research vessels (ship length averages about 70 meters) were equipped with a top barrel (almost
20 meters from the sea level), from which three men conducted sighting observations. On the upper
bridge (almost 11.5 meter from the sea level), a captain, a gunner, a helmsman and a researcher also
conducted sightings. The sighting activity was carried out from 30 minutes after sunrise to 30 minutes
before sunset. The survey ship speed averages about 11.5 knots.
  When a sighting is made, the topman (or upper bridge observer) gives an estimate of the distance
and angle to the sighting and the ship turns immediately, regardless of the angle to the sighting. The
whales were approached and the species, number of animals and number of calves (if present) deter-
mined. In order to save valuable research time, closure to the sighting position of whales that can be
positively identified as long-diving species (such as sperm whales or beaked whales) may be aban-
doned if it is considered that the animals have dived.
  In addition, using the round-trip transit sighting surveys were also conducted every season between
low latitude and Antarctic regions, although the searching effort was low compared to that south of
60°S (Fig. 1).

                   Fig. 2. Start and end dates of JARPA and JARPA II surveys (1989/90–
                     2008/09) in the research area.

Cetacean Population Studies (CPOPS)
Vol. 2, 2020, 15-38                                                                                     17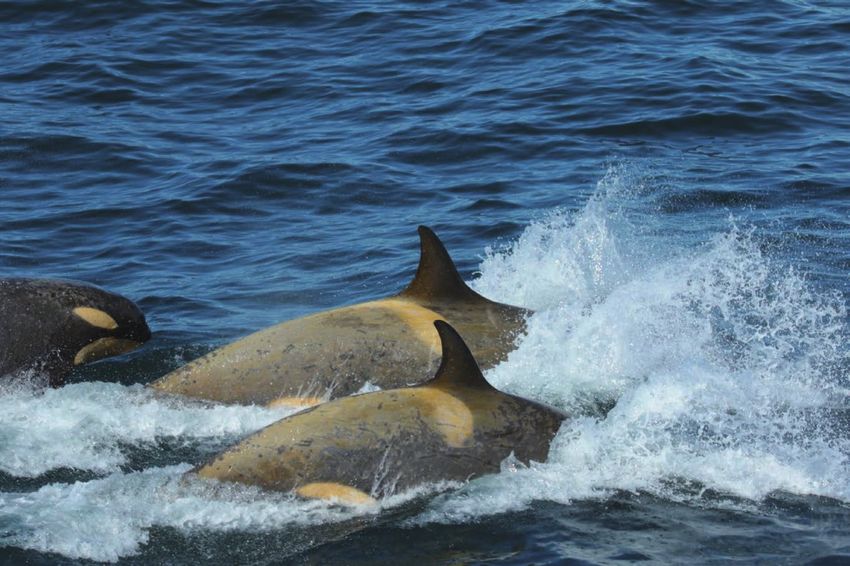
MATSUOKA AND HAKAMADA

          1 9 8 9 /9 0                            1 9 9 1 /9 2                            1 9 9 3 /9 4                            1 9 9 5 /9 6
          IV-NW IV-NE                             IV-NW IV-NE                             IV-NW IV-NE                              IV-NW IV-NE
             5    2                                  5    1                                  5    2                      III-E        3    5
           IV-SW         IV-SE                     IV-SW         IV-SE                     IV-SW         IV-SE             1       IV-SW         IV-SE
             3             1                         3             2                         3             1                         2             6
           IV-PB                                   IV-PB                                   IV-PB                                   IV-PB
             4                                       4                                       4                                       4

          1 9 9 7 /9 8                            1 9 9 9 /0 0                            2 0 0 1 /0 2                            2 0 0 3 /0 4
          IV-NW IV-NE                             IV-NW IV-NE                             IV-NW IV-NE                              IV-NW IV-NE
 III-E       2    4                      III-E       2    3                      III-E       2    3                      III-E        2    3
   1       IV-SW         IV-SE             1      IV-SW          IV-SE             1       IV-SW         IV-SE             1       IV-SW         IV-SE
             5             3                        5              4                         5             4                         5             4
           IV-PB                                   IV-PB                                   IV-PB                                   IV-PB
             6                                       6                                       6                                       6

                        2 0 0 5 /0 6                                                                    2 0 0 7 /0 8
           III-NE IV-NW IV-NE V-NW                 V-NE                                    III-NE IV-NW IV-NE V-NW
                                                                                                                                   V-NE
              3      4       6       2               1                                        1      2       3       4             unsurveyed

           III-SE IV-SW IV-SE V-SW                  V-SE                                   III-SE IV-SW IV-SE V-SW
                                                                                                                                    V-SE
              3      4       6       2               1                                        1      2       3       4             unsurveyed

                         IV-PB                                                                           IV-PB
                           5                                                                             unsurveyed

                  1 9 9 0 /9 1                            1 9 9 2 /9 3                           1 9 9 4 /9 5                            1 9 9 6 /9 7
         V-NW      V-NE                          V-NW      V-NE                      V-NW          V-NE                      V-NW          V-NE
           2         4                             3         1                         2             3                         4             2          VI-W
         V-SW       V-SE                         V-SW       V-SE                         V-SW      V-SE                          V-SW       V-SE          1
           1         3                             2         4                             1        4                              3         5

                  1 9 9 8 /9 9                            2 0 0 0 /0 1                           2 0 0 2 /0 3                            2 0 0 4 /0 5
         V-NW      V-NE                          V-NW      V-NE                      V-NW          V-NE                      V-NW          V-NE
           2         1           VI-W              4         2           VI-W          4             2            VI-W         4             2          VI-W
         V-SW       V-SE           5             V-SW      V-SE           1              V-SW      V-SE            1             V-SW       V-SE          1
           3         4                             5        3                              5        3                              5         3

                  2 0 0 6 /0 7                           2 0 0 8 /0 9
         V-NW      V-NE          VI-NW           V-NW      V-NE          VI-NW
           4         2              1              1         4              2
         V-SW       V-SE         VI-SW           V-SW       V-SE         VI-SW
           4         3             1               1         3             2

Fig. 3. Survey order by strata for the period from 1989/90 to 2008/09 seasons. Key: III= Area III, IV= Area IV,
  V = Area V, VI = Area VI, E = East, W = West, NW= North-West, NE= North-East, SW= South-West, SE= South-
  East, PB = Prydz Bay. A common number in a season indicates that two strata were surveyed in the same
  period. V-NE, V-SE and IV-PB strata could not be surveyed at all in 2007/08 season (Hakamada and Matsuoka,
  2014a).

Density index of whales and mean school size
  The Density Index of Whales (DIW), i.e. the number of individual whales sighted per 100 n.miles,
was calculated for each Lat.1° × Long.1° grid square. The mean school size (Mss) in this study is the
arithmetic mean (i.e. number of animals divided by number of schools).

                                                                                                            Cetacean Population Studies (CPOPS)
18                                                                                                                            Vol. 2, 2020, 15-38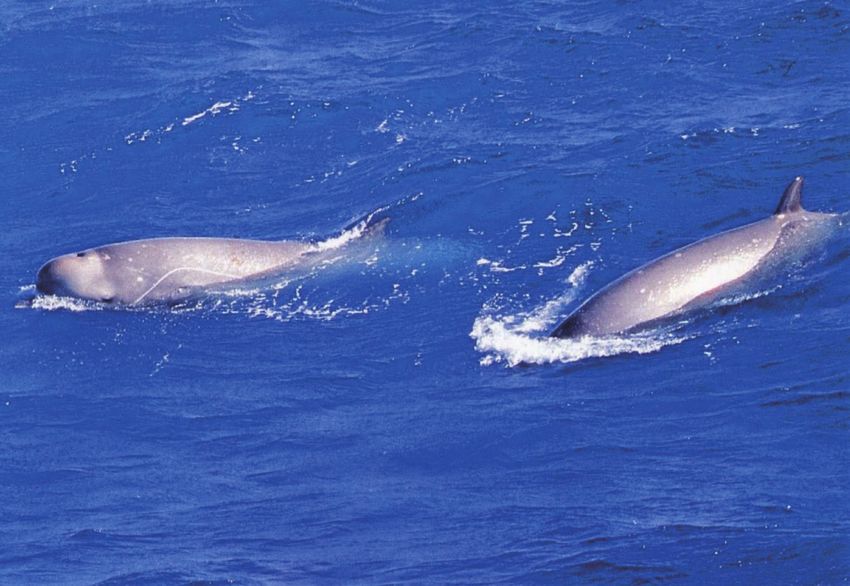
DENSITY DISTRIBUTION OF ANTARCTIC WHALES
Results and Discussion
Searching efforts
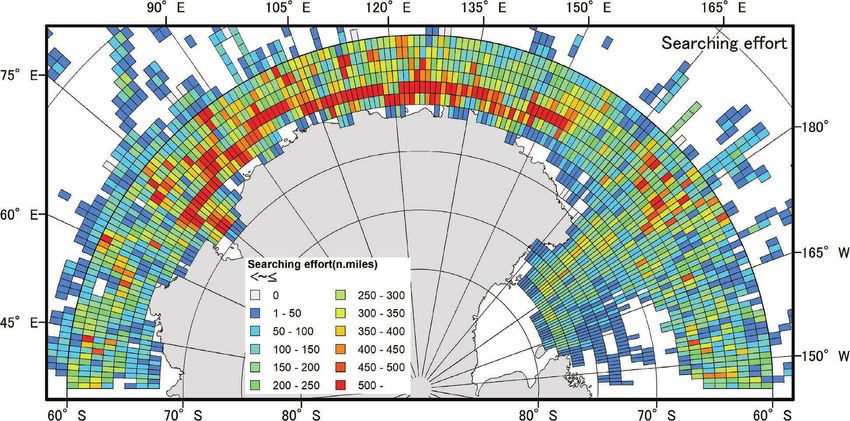
A total of 353,134 n.miles were surveyed in Areas IIIE, IV, V and VIW, south of 60°S, between
1989/90 and 2008/09. Fig. 4 shows the distribution of the primary searching effort (n.miles). All grid
squares were searched and the research area south of 60°S was completely covered.
Distribution of whales
Tables 1a and 1b show a summary of the primary sightings of baleen and toothed whales, respec-
Fig. 4. Distribution of the primary searching effort by Lat.1° × Long.1° squares in JARPA and JARPAII
surveys in the period 1987/88 – 2008/09 seasons.
Table 1a. Summary of baleen whale species sighted in the Indo-Pacific region of the Antarctic.
Dwarf minke
Research Effort Blue whale Fin whale Sei whale Ant. minke whale Humpback whale S. right whale
No. Season whale
area (n.miles)
sch. ind. calf sch. ind. calf sch. ind. calf sch. ind. calf sch. ind. calf sch. ind. calf sch. ind. calf
1 1987/88 IV 8,860.6 0 0 0 3 3 0 1 1 0 237 719 0 1 2 0 35 76 0 1 1 0
2 1988/89 V 10,806.7 2 3 0 7 16 0 0 0 0 353 768 0 5 5 0 1 2 0 0 0 0
3 1989/90 IV 16,423.2 5 9 0 5 20 0 0 0 0 758 1,968 0 3 3 0 121 210 11 2 2 0
4 1990/91 V 14,660.0 4 6 0 33 67 0 0 0 0 740 1,713 0 6 6 0 58 90 0 0 0 0
5 1991/92 IV 17,844.1 3 3 0 8 34 0 2 2 0 597 2,030 0 0 0 0 177 321 7 26 30 0
6 1992/93 V 13,924.9 7 9 0 15 27 1 2 4 0 1,024 3,228 0 7 7 0 28 56 5 3 4 0
7 1993/94 IV 17,957.3 5 9 0 9 26 0 0 0 0 688 1,619 0 4 4 0 133 220 1 11 14 0
8 1994/95 V 14,047.7 13 20 1 73 241 1 2 5 0 823 2,453 0 6 6 0 131 228 9 0 0 0
9 1995/96 IIIE, IV 21,466.7 9 16 0 60 214 1 0 0 0 887 2,008 0 2 2 0 325 562 10 8 8 0
10 1996/97 V, VIW 17,783.2 7 9 0 37 82 1 1 1 0 853 2,610 0 9 9 0 114 200 3 0 0 0
11 1997/98 IIIE, IV 21,594.4 16 25 0 18 57 0 0 0 0 672 1,373 0 2 2 0 577 1,122 2 34 37 0
12 1998/99 V, VIW 8,066.5 4 7 1 45 222 1 0 0 0 826 2,665 0 3 3 0 106 203 7 0 0 0
13 1999/2000 IIIE, IV 16,341.5 25 53 2 66 356 3 0 0 0 1,507 6,581 0 0 0 0 661 1,269 5 3 3 0
14 2000/01 V, VIW 20,421.3 10 18 0 114 374 0 7 13 0 1,907 4,949 0 27 27 0 191 341 3 2 2 0
15 2001/02 IIIE, IV 19,767.4 17 26 1 143 983 2 1 2 0 1,867 4,374 0 0 0 0 1,219 2,387 5 15 22 1
16 2002/03 V, VIW 18,126.2 5 10 0 52 216 0 8 14 0 2,420 6,531 0 6 6 0 145 228 4 0 0 0
17 2003/04 IIIE, IV 19,287.4 32 61 0 109 446 0 0 0 0 1,092 3,250 0 2 2 0 1,690 3,134 5 1 2 1
18 2004/05 V, VIW 18,486.7 12 16 0 49 118 1 1 1 0 1,663 4,278 0 0 0 0 197 336 2 2 2 0
19 2005/06 IIIE, IV 16,372.7 24 38 2 188 748 1 2 3 0 1,657 4,375 0 0 0 0 1,702 3,200 22 53 73 4
20 2006/07 V, VIW 11,968.8 7 12 1 37 253 0 0 0 0 969 2,169 0 1 1 0 160 283 13 0 0 0
21 2007/08 IIIE, IV 14,575.3 43 84 1 48 134 4 2 2 0 823 1,702 0 0 0 0 1,314 2,536 7 72 96 0
22 2008/09 V, VIW 14,351.4 14 28 1 109 440 2 5 7 0 1,870 4,668 0 0 0 0 339 587 8 0 0 0
- Total - 353,134 264 462 10 1,228 5,077 18 34 55 0 24,233 66,031 0 84 85 0 9,424 17,591 129 233 296 6
Cetacean Population Studies (CPOPS)
Vol. 2, 2020, 15-38 19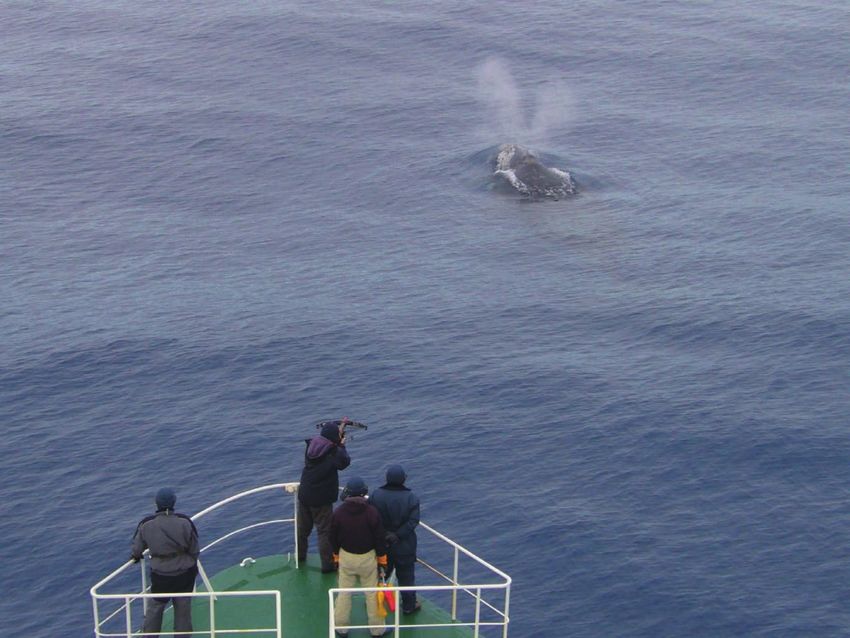
MATSUOKA AND HAKAMADA

Table 1b. Summary of toothed whale species sighted in the Indo-Pacific region of the Antarctic.
                                                                       S. bottlenose              Unid. beaked
                   Research Effort               Sperm whale                                                               Killer whale
No.    Season                                                              whale                    whales
                     area   (n.miles)
                                               sch.    ind.   calf   sch.     ind.   calf     sch.     ind.   calf      sch.      ind.     calf
 1     1987/88           IV       8,860.6       6       6      0      3        5        0     87       218       0       20       194       0
 2     1988/89            V       10,806.7     81      91      0      2        4        0     65       143       0       31       189       0
 3     1989/90           IV       16,423.2     204     215     0      23      46        0     281      514       0       69       859       0
 4     1990/91            V       14,660.0     175     188     0      13      26        0     241      421       1       32       870       2
 5     1991/92           IV       17,844.1     225     233     0      29      51        0     181      304       1       53       805       0
 6     1992/93            V       13,924.9     105     108     0      10      19        0     202      361       0       82      1,130      0
 7     1993/94           IV       17,957.3     321     336     0     145      243       0     205      337       0       56       399       1
 8     1994/95            V       14,047.7     133     135     0      74      146       1     168      263       0       35       281       1
 9     1995/96         IIIE, IV   21,466.7     341     352     0     137      273       1     161      284       0      109      1,282      1
 10    1996/97         V, VIW     17,783.2     121     128     0      75      128       0     78       144       1       50       539       4
 11    1997/98         IIIE, IV   21,594.4     295     302     0     222      409       0     197      338       0       82       931       9
 12    1998/99         V, VIW     8,066.5      49      50      0      23      53        0     35       54        0       35       409       5
 13   1999/2000        IIIE, IV   16,341.5     195     204     0     138      251       0     110      188       0      109      2,011      7
 14    2000/01         V, VIW     20,421.3     100     106     0      72      121       0     173      272       0       72      1,471      2
 15    2001/02         IIIE, IV   19,767.4     269     272     0     126      226       0     134      205       0       79       939       0
 16    2002/03         V, VIW     18,126.2     128     129     0      97      168       0     113      154       0       63       953       0
 17    2003/04         IIIE, IV   19,287.4     222     223     0     154      274       0     208      338       0      120      1,348      0
 18    2004/05         V, VIW     18,486.7     105     108     0      44      78        0     89       159       0       78      1,472      3
 19    2005/06         IIIE, IV   16,372.7     181     182     0      88      179       0     135      244       0      100      1,563      3
 20    2006/07         V, VIW     11,968.8     63      63      0      51      80        0     66       88        0       44       394       0
 21    2007/08         IIIE, IV   14,575.3     280     280     0      79      157       1     102      155       0       62       790       0
 22    2008/09         V, VIW     14,351.4     75      76      0      32      61        0     77       140       0       38       788      14
  -     Total             -       353,134     3,674 3,787      0     1,637 2,998        3    3,108 5,324         3   1,419 19,617          52

Table 2. Summary of sighting information for the whole research area in the period 1987/88-2008/09, for whale
  species and month. Sch: number of primary sightings of schools; Ind: number of primary sightings of indi-
  viduals; Calf: number of calves; Mss: mean school size (Ind./Sch.); DIS: Density Index (schools/100 n.miles);
  DIW: Density Index (individuals/100 n.miles).
                                            All Areas (IIIE, IV, V and VIW;                 Order
                                                                                                      Dec.       Jan.          Feb.      Mar.
             Species                           south of 60S, 35E-145W)                       of
                                    Sch.       Ind.    Calf   Mss      DIS      DIW         DIW       DIW        DIW           DIW       DIW
 Blue whale                         286        495      11    1.73    0.081     0.140        8       0.281       0.092        0.101      0.102
 Fin whale                         1,268      5,209     20    4.11    0.359     1.475        5       1.323       0.794        1.760      3.059
 Sei whale                           36         59      0     1.64    0.010     0.017        11      0.002       0.004        0.020      0.044
 Antarctic minke whale             25,507 69,076        0     2.71    7.223 19.561           1       10.173 14.301 33.331 19.436
 Dwarf minke whale                   84         85      0     1.01    0.024     0.024        10      0.008       0.031        0.039      0.008
 Humpback whale                    10,036 18,770 137          1.87    2.842     5.315         3      3.425       4.842        7.337      6.708
 Southern right whale               235        298      6     1.27    0.067     0.084         9      0.001       0.014        0.156      0.292
 Sperm whale                       3,810      3,926      0    1.03    1.079     1.112         6      1.500       1.272        0.992      0.292
 Southern bottlenose whale         1,666      3,045      3    1.83    0.472     0.862         7      0.932       0.974        0.787      0.570
 Unid. beaked whale                3,175      5,457      3    1.72    0.899     1.545         4       1.864      1.594        1.123      1.209
 Killer whale                      1,472      20,569    59    13.97 0.417       5.825         2       1.935      5.692        9.303      6.624

                                                                                             Cetacean Population Studies (CPOPS)
20                                                                                                             Vol. 2, 2020, 15-38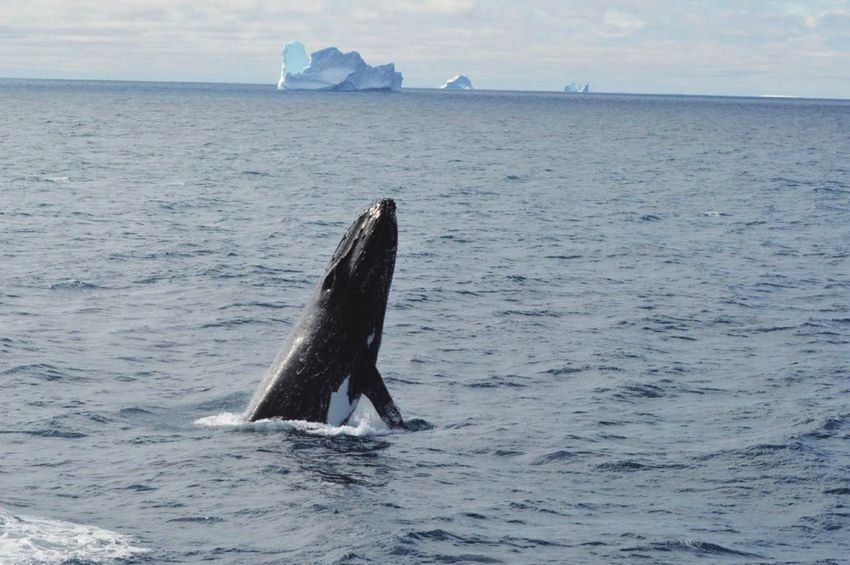
DENSITY DISTRIBUTION OF ANTARCTIC WHALES

tively for each individual survey. Table 2 shows the summary of sighting data for each species such
as the number of calves and the observed mean school size. Total DIW for each species were the total
numbers of sighted individuals divided by the total effort and multiplied by 100. Monthly DIW were
obtained similarly. Figs. 5a – 5d show the maps of the DIW for Antarctic blue (Balaenoptera musculus
intermedia), fin (B. physalus) and sei (B. borealis), Antarctic minke (B. bonaerensis), dwarf minke (B.
a. subsp.), humpback (Megaptera novaeangliae), southern right (Eubalaena australis), sperm (Physe-
ter macrocephalus), southern bottlenose (Hyperoodon planifrons), unidentified beaked (Ziphiidae) and
killer (Orcinus orca) whales, for each Lat.1° × Long.1° grid square. Figs. 6a and 6b show the longi-
tudinal band of DIW for each species. Figs. 7a and 7b show the latitudinal band of DIW for each
species. Fig. 8 shows a plot with time trends of DIW for each species. Fig. 9 shows the monthly change
in DIW for most of the species.
   A description of the geographical distribution of each whale species is presented and discussed
below.

Blue whale
   Blue whale ranked 8th for DIW among the ten species sighted in the research area (Table 2). Blue
whales were widely distributed in the research area, not only in the northern stratum, but also in the
southern stratum. High density values were recorded for this species in Area IIIE, particularly between
45°E and 65°E (Fig. 5a). Blue whales were rarely found in Prydz Bay, but were sighted in the Ross
Sea between 70°S and 77°S. A total of 286 schools (495 individuals), including eleven calves, were
sighted south of 60°S (Table 2). Observed mean school size was 1.73 individuals. Sighting rate of a
mother and calf pair was 3.85% (11 out of 286 schools) which is the highest number compared to other
baleen whale species in the Antarctic. A high-density area was observed between 35°E and 65°E (Fig.
6a). The DIW of this species was 0.140 for the whole survey period and the indices were almost
stable from December to March (Table 2; Fig. 9). Previous studies have noted that blue whales are
more common close to the ice edge than in more northerly waters (e.g. Kasamatsu et al., 2000). This
appears to be true for 110°E eastward, although there are blue whale sightings at or around 60°S in
the region 45°E – 110°E (Figs. 6a and 7a). Similar distribution pattern was observed by Branch (2007).
   Two subspecies of blue whales exist in the Southern Hemisphere: the Antarctic (or true) blue whale
(Balaenoptera musculus intermedia) and the pygmy blue whale (B. m. brevicauda) (Mackintosh, 1966;
Ichihara, 1966; Rice, 1998). Complete reviews of the spatial and seasonal distributions, as well as
densities and movements of blue whales has been provided by Kato et al. (1995), Branch (2007) and
Branch et al. (2007), respectively. These studies indicated that there is little evidence that pygmy blue
whales migrate to high latitudes of the Antarctic, with less than 1% of the records south of 52°S being
of this subspecies. There have been a couple of genetic studies reporting some population structure in
Antarctic blue whales (Sremba et al., 2012, Attard et al., 2016), but there is limited evidence for mul-
tiple separate populations in these papers.
   The latest abundance estimate of this species (south of 60°S, 35°E – 145°W) was 1,223 whales
(CV = 0.345) in the 2007/08 and 2008/09 seasons, and the abundance trend was 8.2% (95% CI: 3.9%,
12.5%) between 1995/96 and 2008/09 combined for Areas IIIE, IV, V and VIW, based on JARPA and
JARPAII data (Matsuoka and Hakamada, 2014). In this study, no formal analysis has been conducted
but it is probable that the trend of DIW is increasing (Fig. 8). There is a need for continued monitoring
of the abundance and abundance trends of this species, especially because it provides an excellent
opportunity to improve our understanding of the dynamics of baleen whale populations recovering
from low levels.

Fin whale
  Fin whales ranked 5th for DIW among the ten species sighted in the research area. A total of 1,268
schools (5,209 individuals), including 20 calves, were sighted (Table 2). Observed mean school size

Cetacean Population Studies (CPOPS)
Vol. 2, 2020, 15-38                                                                                   21
MATSUOKA AND HAKAMADA

was 4.11 individuals. This species was more frequently encountered in Areas V and VIW than in Areas
IIIE and IV in both northern and southern strata. High density areas were observed in Areas IIIE and
IV, particularly between 55°E and 80°E, and in Area V between 163°E and 170°W (Figs. 5a and 6a).
Fin whales tended to be distributed more northerly than blue whales (Fig. 7a). The DIW of this species
was 1.475 for the whole period and the indices increased from December to March (Fig. 9).
   In the summer feeding grounds in the Antarctic, fin whales occur year-round, but a higher density
is found from November to May (Kasamatsu et al., 1996; Mackintosh, 1966). These whales can be
found as far south as 65 – 70°S, but most of the population seems to occur north of 60°S (Miyashita
et al., 1995). Catches occurred throughout the Antarctic, but most whales (~73%) were taken in IWC
Management Areas II and III (Kasamatsu et al., 1996). Sighting data of this study suggest that the fin
whale’s spatial distribution varies across ocean basins. In this study, no formal analysis has been con-
ducted but it is probable that there is an increasing trend of DIW (Fig. 8). Historically more blue
whales were caught than fin whales in the earlier years of pelagic whaling, and thus fin whales are
likely less depleted than blue whales now, given their much higher sighting rates. There have been a
couple of genetic studies on population structure for fin whales in the management Areas III, IV, V
and VI (e.g. Goto and Taguchi, 2019), but these studies did not find any genetic structure in the
research area.

Sei whale
  The sei whale was rarely sighted in the research area. A total of 36 schools (59 individuals) were
sighted south of 60°S (Table 2), with no calves observed. Observed mean school size was 1.64 indi-
viduals. Sei whales occurred more frequently in Areas V and VIW than in Areas IIIE and IV in the
northern strata (Fig. 5a). High density areas were observed in Area VW, particularly between 150°E
and 160°E (Fig. 6a). Sei whales were tended to distribute more northerly between 40°S and 45°S
compared to fin and blue whales (Fig. 7a). The DIW of this species was 0.017 for the whole research
period.
  In summer, sei whales do not venture into higher latitude waters near the Antarctic continent as much
as some other baleen whales. Most of the population occurs between 40°S and 60°S, usually north of
the Antarctic Convergence (Miyashita et al., 1995). Juveniles are found further north than mature
individuals. Occurrence in low latitude wintering grounds has been recorded from March to December,
but abundance peaks from June/July to August/September (Horwood, 1987). In late spring and sum-
mer, abundance peaks in November between 30°S and 50°S. As the seasons progress, relatively more
whales are observed south of 40°S and abundance between 50°S and 60°S increases consistently until
March (Horwood, 1987). The results in the present study are consistent with those of previous studies.

Antarctic minke whale
  The Antarctic minke whale was the most frequently sighted species throughout the surveys. A total
of 25,507 schools (69,076 individuals) were sighted south of 60°S (Table 2). No calves were observed.
Observed mean school size was 2.71 individuals. High density areas were observed along the ice-edge,
especially between 140°E and 160°E, in the Ross Sea and the Prydz Bay (Fig. 5b). Antarctic minke
whales were widely and evenly distributed in the area south of 60°S (Figs. 6a and 7a). The DIW of
this species for the whole research period was the highest of all recorded species (19.561). The indices
increased from December to February and decreased in March (Fig. 9).
  In the austral summer, the majority of Antarctic minke whales congregate in the Southern Ocean,
with the greatest densities being close to and within the pack ice, and lower densities with increasing
distance from the ice (Kasamatsu et al., 2000; Hakamada and Matsuoka, 2014a; Herr et al., 2019),
including some north of 60°S. Antarctic minke whales are noticeably well adapted to living within the
ice (Ainley et al., 2007), but the exact proportion of these whales found within the pack ice, and in
polynyas, is currently a source of debate. It is possible that a large proportion of the population exists

                                                                      Cetacean Population Studies (CPOPS)
22                                                                                      Vol. 2, 2020, 15-38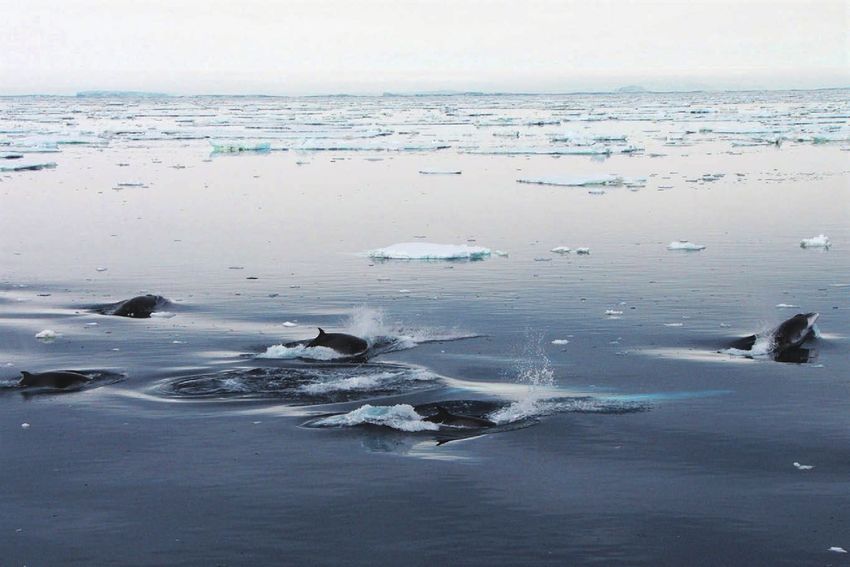
DENSITY DISTRIBUTION OF ANTARCTIC WHALES

   Fig. 5a. DIW of blue, fin and sei whales in the Indo-Pacific region of the Antarctic, based on one degree
     squares (whole research period).

Cetacean Population Studies (CPOPS)
Vol. 2, 2020, 15-38                                                                                            23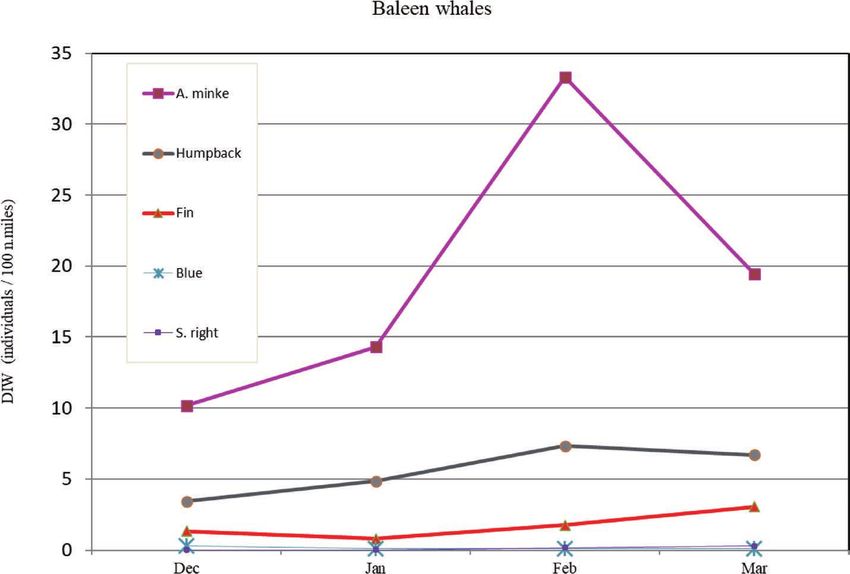
MATSUOKA AND HAKAMADA

within the pack ice, out of reach of ship-based sighting surveys (Murase et al., 2005; 2014; Shimada
and Kato, 2007; Williams et al., 2014).
  There have been a couple of genetic studies reporting some population structure in Antarctic minke
whales which indicated at least two stocks in the research areas: P-stock originating from breeding
grounds in the western South Pacific and I-stock originating in the Indian Ocean. The study also sug-
gested that the two stocks overlap geographically in a wide area of the Antarctic located at 130°E–165°E,
which changes by year and sex depending on the krill availability (Pastene and Goto, 2016).

Dwarf minke whale
   Distribution of dwarf minke whale was limited within the research area. There were two separate
areas of distribution between 120°E and 147°E, and between 165°E and 170°W in the northern stratum
(mainly between 48°S and 63°S), south of Australia and New Zealand (Figs. 5b, 6a and 7a). The dwarf
minke whale has a white band on the flipper that distinguishes it from the Antarctic minke whale, but
it was only recently identified as separate from Antarctic minke whales (Best, 1985; Rice, 1998;
Pastene et al., 2010). Based on previous information, only a small percentage of minke whales in the
Antarctic (south of 60°S) are dwarf minke whales. For example, in the IDCR/SOWER surveys from
1993/94–1997/98, only 0.2% of the identified sightings were dwarf minke whales (2 out of 906)
(Branch and Butterworth, 2001). Based on this, no formal analysis has been conducted but it is prob-
able that less than 0.2% of the minke whales south of 60°S are dwarf minke whales. In this study, only
0.129 % (85 out of 66,031) of the identified sightings were dwarf minke whales south of 60°S. Kato
et al. (in press) further examined this aspect by a more extended data set.

Humpback whale
   The humpback whale held the 3rd rank among the ten species sighted in the research area. A total
of 10,036 schools (18,770 individuals), including 137 calves, were sighted (Table 2). Observed mean
school size was 1.87 individuals. Humpbacks were widely distributed in the research area in both
northern and southern strata. They were rarely found within Prydz Bay and no sightings occurred south
of 73°S in the Ross Sea. This is a very curious difference in their distribution compared to blue whales
and Antarctic minke whales. The current distribution map of this species suggests that humpback
whales are encountered more frequently in the sector 80°E – 110°E from the ice-edge to 60°S because
of its high productivity (Figs. 5b and 6a). A high density area was observed in the north between 58°S
and 65°S (Fig. 7a). In the 80°E – 110°E sector, large scale distribution changes and a “Shift in baleen
whale dominance” from Antarctic minke to humpback whales was observed between 85°E and 110°E
(Matsuoka et al., 2011; Matsuoka and Hakamada, 2014; Murase et al., 2014; Hakamada and Matsuoka,
2014b). The DIW of this species was 5.315 for the whole survey period. Indices increased from
December to February and decreased in March (Fig. 9).
   There have been a couple of genetic studies reporting some population structure of humpback
whales in the Antarctic (Pastene et al., 2019), which suggested the core distribution areas for each of
the ‘D: western Australia stock’ and ‘E1: eastern Australia stock’ and possible mixing areas around
130°E.
   IDCR/SOWER circumpolar cruises encountered humpback whales more frequently in the sectors
20°E–40°E, 80°E – 100°E and 150°E – 180° (Branch, 2011). It has been suggested that such changes
are related to changing oceanographic and krill environment conditions such as the effect of regime
shift in global sea-surface temperatures in relation to El Nino-southern oscillation events (Watanabe
et al., 2014; Naganobu et al., 2014). This suggestion should be further investigated in the future.

Southern right whale
  A total of 235 schools (298 individuals), including six calves, were sighted (Table 2). Distribution
area of this species was limited at certain longitudes of the sector 80°E – 135°E, south of Western

                                                                     Cetacean Population Studies (CPOPS)
24                                                                                     Vol. 2, 2020, 15-38
DENSITY DISTRIBUTION OF ANTARCTIC WHALES
Fig. 5b. DIW of Antarctic minke, dwarf minke and humpback whales in the Indo-Pacific region of the
Antarctic, based on one degree squares (whole research period).
Cetacean Population Studies (CPOPS)
Vol. 2, 2020, 15-38 25MATSUOKA AND HAKAMADA
Australia (Figs. 5c and 6a). Sighting rate of mother and calf pairs was 2.54% (6 out of 235 schools)
which is highest number compared to other baleen whale species in the Antarctic. Southern right
whales tended to be distributed more northerly between 40°S and 45°S and more southerly between
62°S and 65°S (Fig. 7a).
The DIW of this species was 0.084 for the whole survey period. Indices increased from December
to March (Fig. 9). In summer, southern right whales migrate south, but generally not as far south as
other baleen whale species. Southern right whales appear to occur near the subtropical convergence in
summer (January to March) at around 40°S – 50°S (Ohsumi and Kasamatsu, 1985), but there are
records of these animals much further south, for example, around 60°S – 65°S, south of Australia
(Bannister et al., 1999; 2008). The population estimate for the coastal area of Western Australia was
2,400 in 2006 (Bannister, 2008). A current estimate in Area IV south of 60°S is 1,557 individuals (95%
CI, 871–2,783), based on JARPAII data for the 2007/08 season (Matsuoka and Hakamada, 2014). This
indicates that southern right whales migrate and make the Antarctic region an important feeding
ground in the Austral summer.
Sperm whale
The sperm whale held the 6th rank among the ten species sighted in the research area. A total of
3,810 schools (3,926 individuals) were sighted. No calves were observed (Table 2). Of these sightings,
most were single large males (96.5%) and, consequently, the observed mean school size was 1.03.
Sperm whales were widely distributed in the research area with high density values being recorded
between 35°E and 100°E and between 170°E and 170°W, in the mouth of the Ross Sea (Figs. 5c and
6b). These whales tended to be concentrated on the Antarctic continental slope, on the southern
Kerguelen Plateau, and around the mouth of the Ross Sea, where the depth was usually between 1,000
and 4,000 m. This species was rarely found within Prydz Bay or in the Ross Sea (Fig. 5c). Latitudinally,
sperm whales tended to be distributed between 40°S and 45°S and between 61°S and 73°S (Fig. 7b).
There were no sightings south of 74°S in the Ross Sea. In this study, no formal analysis has been
conducted but it is probable that the trend of DIW was stable (Fig. 8). The DIW of this species was
1.081 for the whole research period. The indices decreased from December to March (Fig. 9).
Southern bottlenose whales
The southern bottlenose whale was ranked 7th among the ten species sighted in the research area.
A total of 1,666 schools (3,045 individuals), including three calves, were sighted (Table 2). These
whales were widely distributed in the research area but were rarely sighted within Prydz Bay and in
the Ross Sea. High density values of this whale were observed between 35°E and 70°E (Figs. 5c and
6b). Southern bottlenose whales were latitudinally distributed between 47°S and 70°S (Fig. 7b).
Observed mean school size was 1.83 individuals. The DIW of this species was 0.862 for the whole
survey period. Indices decreased from December to March (Fig. 9).
Unidentified beaked whales
Unidentified beaked whales held the 4th rank among the ten species sighted in the research area. A
total of 3,175 schools (5,457 individuals), including three calves, were sighted (Table 2). The sightings
were recorded as unidentified species but confirmed as beaked whales. These ‘unidentified beaked
whales’ possibly included the southern bottlenose whale (Hyperoodon planifrons), Arnoux’s beaked
whale (Berardius arnuxii), strap-toothed whale (Mesoplodon layardii), Grey’s beaked whale (M. grayi)
and Cuvier’s beaked whale (Ziphius cavirostris). The distribution pattern of the unidentified beaked
whales was consistent with that of southern bottlenose whales (Fig. 5d).
Killer whale
Killer whales held the 2nd rank among the ten species sighted in the research area. A total of 1,472
Cetacean Population Studies (CPOPS)
26 Vol. 2, 2020, 15-38DENSITY DISTRIBUTION OF ANTARCTIC WHALES
Fig. 5c. DIW of southern right, sperm and southern bottlenose whales in the Indo-Pacific region of the
Antarctic, based on Lat.1° × Long.1° squares (whole research period).
Cetacean Population Studies (CPOPS)
Vol. 2, 2020, 15-38 27MATSUOKA AND HAKAMADA
Unid. beaked whale
Fig. 5d. DIW of unidentified beaked and killer whales in the Indo-Pacific region of the Antarctic, based
on Lat.1° × Long.1° squares (whole research period).
schools (20,569 individuals), including 59 calves, were sighted (Table 2). Observed mean school size
was 13.97 individuals. The DIW of this species was 5.825 for the whole study period (Table 2). These
whales were widely distributed in the research area longitudinally and latitudinally (Figs. 6b and 7b),
and were more frequently sighted in the southern stratum. High density areas were observed near the
ice-edge or within Prydz Bay and in the Ross Sea where the pack-ice had melted on the continental
shelf slope in February (Figs. 5d, 6b, 7b and 9). Killer whale abundance in the Antarctic was estimated
by Branch and Butterworth (2001), and appears to be far higher than in any other ocean in the world.
In this study, no formal analysis has been conducted but it is probable that the trend of DIW was
stable (Fig. 8). The large school size of killer whales considered to be fish eaters were often sighted
in the Prydz Bay and the Ross Sea. Further analyses will be required to definitively identify the killer
whale type (fish eater or marine mammal eater etc.) as part of ongoing Antarctic ecosystem research.
Cetacean Population Studies (CPOPS)
28 Vol. 2, 2020, 15-38DENSITY DISTRIBUTION OF ANTARCTIC WHALES
Blue whale Fin whale
Sei whale Antarctic minke whale
Dwarf minke whale Humpback whale
Southern right whale
Fig. 6a. The longitudinal band of DIW for blue, fin, sei, Antarctic minke, dwarf minke, humpback and southern
right whales in the Indo-Pacific region of the Antarctic, based on Lat.1° × Long.1° squares (whole research
period).
Sperm whale Southern bottlenose whale
Unidentified beaked whale Killer whale
Fig. 6b. The longitudinal band of DIW for sperm, southern bottlenose, unidentified beaked and killer whales in
the Indo-Pacific region of the Antarctic, based on Lat.1° × Long.1° squares (whole research period).
Cetacean Population Studies (CPOPS)
Vol. 2, 2020, 15-38 29MATSUOKA AND HAKAMADA
Blue whale Fin whale
Sei whale Antarctic minke whale
Dwarf minke whale Humpback whale
Southern right whale
Fig. 7a. The latitudinal band of DIW for blue, fin, sei, Antarctic minke, dwarf minke, humpback and southern
right whales in the Indo-Pacific region of the Antarctic, based on Lat.1° × Long.1° squares (whole research
period).
Sperm whale Southern bottlenose whale
Unidentified beaked whale Killer whale
Fig. 7b. The latitudinal band of DIW for sperm, southern bottlenose, unidentified beaked and killer whales in the
Indo-Pacific region of the Antarctic, based on Lat.1° × Long.1° squares (whole research period).
Cetacean Population Studies (CPOPS)
30 Vol. 2, 2020, 15-38DENSITY DISTRIBUTION OF ANTARCTIC WHALES
Blue whale Fin whale Sei whale
0.45 4.00 0.05
0.40 3.50 0.04
0.35 0.04
3.00
0.30 0.03
2.50
0.25 0.03
2.00
DIW
DIW
DIW
0.20 0.02
1.50
0.15 0.02
1.00
0.10 0.01
0.05 0.50 0.01
0.00 0.00 0.00
1987 1991 1995 1999 2003 2007 1987 1991 1995 1999 2003 2007 1987 1991 1995 1999 2003 2007
Season Season Season
Ant. minke whale Dwarf minke whale Humpback whale
35.00 0.08 14.00
0.07 12.00
30.00
0.06
25.00 10.00
0.05
20.00 8.00
DIW
0.04
DIW
DIW
15.00 6.00
0.03
10.00 4.00
0.02
5.00 0.01 2.00
0.00 0.00 0.00
1987 1991 1995 1999 2003 2007 1987 1991 1995 1999 2003 2007 1987 1991 1995 1999 2003 2007
Season Season Season
S. right whale Sperm whale S. bottlenose whale
0.35 1.60 1.80
1.40 1.60
0.30
1.40
1.20
0.25
1.20
1.00
0.20 1.00
0.80
DIW
DIW
DIW
0.15 0.80
0.60
0.60
0.10
0.40
0.40
0.05 0.20 0.20
0.00 0.00 0.00
1987 1991 1995 1999 2003 2007 1987 1991 1995 1999 2003 2007 1987 1991 1995 1999 2003 2007
Season Season Season
Unid. beaked whales Killer whale
3.50
10.00
3.00 9.00
8.00
2.50
7.00
2.00 6.00
DIW
5.00
DIW
1.50
4.00
1.00 3.00
2.00
0.50
1.00
0.00 0.00
1987 1991 1995 1999 2003 2007 1987 1991 1995 1999 2003 2007
Season Season
Fig. 8. Plot with time trends in DIW for each species and unidentified beaked whales in the Indo-Pacific region
of the Antarctic (south of 60°S) during 1987/88 to 2008/09 seasons.
Cetacean Population Studies (CPOPS)
Vol. 2, 2020, 15-38 31MATSUOKA AND HAKAMADA
Fig. 9. Yearly trend in DIW for baleen (top) and toothed (bottom) whales in
the the Indo-Pacific region of the Antarctic (south of 60°S) during 1987/88
to 2008/09 seasons.
Conclusions
Importance of monitoring whale populations
Most large whales were heavily exploited during the past century and most of the stocks in the
Southern Hemisphere were substantially depleted. In the Antarctic Ocean, catches of southern right,
humpback, blue, fin and sei whales were prohibited in 1932, 1963, 1964, 1976 and 1978, respectively.
Eighty years have passed since the southern right whale has been protected, and more than 50 years
have passed since the humpback whale and blue whale have been protected. In the coastal waters of
South America, South Africa and along the east and west coasts of Australia, significant recovery of
southern right whales and humpback whales in these breeding areas has been recently reported. On
the other hand, the information on the present status of pelagic species, such as blue, fin and sei whales
was limited. The IWC/IDCR-SOWER cruises have covered the same area every year for 6 years
however this is insufficient for monitoring the ecosystem. On the other hand, JARPA and JARPAII
have been monitoring baleen whale species populations by large-scale and long-term line transect
surveys for over 30 years in Areas IV and V. However, the survey years is still not enough to detect
Cetacean Population Studies (CPOPS)
32 Vol. 2, 2020, 15-38DENSITY DISTRIBUTION OF ANTARCTIC WHALES
precise yearly trends for whale populations. For this reason, the JASS-A (Japanese Abundance and
Stock structure Surveys in the Antarctic) was started from the 2019/2020 season as a successor to the
Japanese Antarctic survey programs such as JARPAII and NEWREP-A (New Scientific Whale
Research Program in the Antarctic Ocean), in order to continue to provide additional information about
the recovery of whale stocks (Government of Japan, 2019).
Relationship between distribution and oceanographic conditions
There was a common pattern for several whale species to concentrate mainly in the sector
80°E–110°E, south of 60°S. This area is characterised by a large meander (rise to 61°S and slow-
moving down to 63°S) of the southern boundary of the Antarctic Circumpolar Current (ACC), which
seems to be caused by large-scale upwelling with nutritious bottom waters, resulting from the bottom
shape of the southern Kerguelen Plateau (Watanabe et al., 2014; Naganobu et al., 2014). The BROKE
Australian Antarctic survey previously indicated the possibility of large-scale upwelling between 80°E
and 100°E (Bindoff et. al., 2000). In the JARPA 1999/2000 cruise, a high density of Euphausiids was
reported between 100°E and 120°E (Murase et al., 2002). Humpback, southern right, large male sperm
and southern bottlenose whales used this longitudinal section between 80°E and 100°E as their key
feeding area from December to March. It is necessary to further investigate the relationship between
whale distribution and oceanographic condition shifts such as the effect of regime shift in global sea-
surface temperatures in relation to El Nino-southern oscillation events (Matsuoka et al., 2003;
Watanabe et al., 2014; Naganobu et al., 2006; 2014).
Acknowledgements
We are grateful to all successive cruise leaders, researchers, captain and crew members for their hard
works under difficult conditions in the JARPA and JARPAII surveys from which the data used in the
present study were collected. We also would like to express our gratitude to Drs. Seiji Ohsumi
(deceased), Hiroshi Hatanaka, Hidehiro Kato, Yoshihiro Fujise and Luis Pastene of the Institute of
Cetacean Research, Dr. Tomio Miyashita, the National Research Institute of Far Seas Fisheries
(Shimizu), Dr. Hiroto Murase, Tokyo University of Marine Science and Technology, for their useful
comments on earlier versions of this paper. We also thank to Mr. Nishiwaki Shigetoshi, secretary and
other members of the Institute of Cetacean Research (ICR) for their contribution for the database. All
photographs are provided by ICR. The manuscript benefited from helpful comments from three
anonymous reviewers. Finally, we are deeply grateful for the fair and constructive reviews of anony-
mous reviewers.
References
Ainley, D. G., Dugger, K. M., Toniolo, V. and Gaffney, I. 2007. Cetacean occurrence patterns in the Amundsen and South-
ern Bellingshausen Sea sector, Southern Ocean. Marine Mammal Science 23(2): 287 – 305.
Attard, C. R. M., Beheregaray, L. B. and Möller, L. M. 2016. Towards population-level conservation in the critically
endangered Antarctic blue whale: the number and distribution of their populations. Scientific Report 6, 22291. DOI:
10.1038/srep22291.
Bannister, J. L., Pastene, L. A. and Burnell, S. R. 1999. First record of movement of a southern right whale (Eubalaena
australis) between warm water breeding grounds and the Antarctic Ocean, south of 60°S. Marine Mammal Science
15(4): 1337–1342.
Bannister, J. L. 2008. Population trend in right whales off Southeastern Australia 1993 – 2007. Paper SC/60/BRG14 pre-
sented to the IWC Scientific Committee, June 2008 (unpublished). 13 pp. [Available from the Secretariat of IWC].
Best, P. B. 1985. External characters of southern minke whales and the existence of a diminutive form. Scientific Reports
of the Whales Research Institute 36: 1–33.
Bindoff, N. L., Rosenburg, M. A. and Warner, M. J. 2000. On the circulation and water masses over the Antarctic conti-
nental slope and rise between 80E and 150E. Deep-Sea Research II: Tropical Studies in Oceanography 47: 2299–2326.
Cetacean Population Studies (CPOPS)
Vol. 2, 2020, 15-38 33MATSUOKA AND HAKAMADA
Branch, T. A. and Butterworth, D. S. 2001. Estimates of abundance south of 60oS for cetacean species sighted frequently
on the 1978/79 to 1997/98 IWC/IDCR-SOWER sighting surveys. Journal of Cetacean Research and Management
3(3): 251 –270.
Branch, T. A., Matsuoka, K. and Miyashita, T. 2004. Evidence for increases in Antarctic blue whales based on Bayesian
modelling. Marine Mammal Science 20(4): 726 – 754.
Branch, T. A. 2007. Abundance of Antarctic blue whales south of 60°S from three complete circumpolar sets of surveys.
Journal of Cetacean Research and Management 9(3): 87 – 96.
Branch, T. A., Stafford, K. M., Palacios, D. M., Allison, C., Bannister, J. L., Burton, C. L. K., Cabrera, E., Carlson, C. A.,
Galletti Vernazzani, B., Gill, P. C., Hucke-Gaete, R., Jenner, K. C. S., Jenner, M.-N. M., Matsuoka, K., Mikhalev, Y.
A., Miyashita, T., Morrice, M. G., Nishiwaki, S., Sturrock, V. J., Tormosov, D., Anderson, R. C., Baker, A. N., Best,
P. B., Borsa, P., Brownell Jr, R. L., Childerhouse, S., Findlay, K. P., Gerrodette, T., Ilangakoon, A. D., Joergensen,
M., Kahn, B., Ljungblad, D. K., Maughan, B., Mccauley, R. D., Mckay, S., Norris, T. F., Oman Whale and Dolphin
Research Group, Rankin, S., Samaran, F., Thiele, D., Van Waerebeek, K. and Warneke, R. M. 2007. Past and present
distribution, densities and movements of blue whales Balaenoptera musculus in the Southern Hemisphere and north-
ern Indian Ocean. Mammal Review 37(2): 116 – 175.
Branch, T. A. 2011. Humpback abundance south of 60°S from three completed sets of IDCR/SOWER circumpolar sur-
veys. Journal of Cetacean Research and Management (Special Issue) 3: 53 – 69.
Goto, M. and Taguchi, M. 2019. Genetic analyses on stock structure of fin whales in the Indo Pacific region of the Ant-
arctic feeding grounds. Paper SC/68a/SH02 submitted to the IWC Scientific Committee. May 2019. (unpublished).
13 pp. [Available from the Secretariat of IWC].
Government of Japan, 2019. Outline of a research program to investigate the abundance, abundance trends and stock
structure of large whales in the Indo-Pacific region of the Antarctic, including a survey plan for the 2019/20 austral
summer season. Paper SC/68a/ASI08 submitted to the IWC Scientific Committee. May 2019. (unpublished). 16 pp.
[Available from the Secretariat of IWC].
Hakamada, T., Matsuoka, K. and Nishiwaki, S. 2006. An update of Antarctic minke whales abundance estimate based on
JARPA data. Paper SC/D06/J6 presented to the JARPA Review Meeting, December 2006 (unpublished). 34 pp. +
Addendum 2 pp. [Available from the Secretariat of IWC].
Hakamada, T. and Matsuoka, K. 2014a. Estimates of abundance and abundance trend of the Antarctic minke whale in
Areas IIIE-VIW, south of 60°S, based on JARPA and JARPAII sighting data (1989/90 – 2008/09). Paper SC/F14/J3
presented to the IWC/SC Review Workshop of the Japanese Whale Research Program under Special Permit in the
Antarctic-Phase II (JARPAII), February 2014 (unpublished). 41 pp. [Available from the Secretariat of IWC].
Hakamada, T. and Matsuoka, K. 2014b. Estimates of abundance and abundance trend of the humpback whale in Areas
IIIE-VIW, south of 60°S, based on JARPA and JARPAII sighting data (1989/90–2008/09). Paper SC/F14/J4 presented
to the IWC/SC Review Workshop of the Japanese Whale Research Program under Special Permit in the Antarctic-
Phase II (JARPAII), February 2014 (unpublished). 36 pp. [Available from the Secretariat of IWC].
Herr, H., Kelly, N., Dorschel, B., Huntemann, M., Kock, K. H., Lehnert, L. S., Siebert, U., Viquerat, S., Williams, R. &
Scheidat, M. 2019. Aerial surveys for Antarctic minke whales (Balaenoptera bonaerensis) reveal sea ice dependent
distribution patterns. Ecology and Evolution 9(10): 5664 – 5682. doi: 10.1002/ece3.5149
Horwood, J. 1987. The Sei Whale: Population Biology, Ecology and Management. Croom Helm, London. 375 pp.
Ichihara, T. 1966. The pygmy blue whale, Balaenoptera musculus brevicauda, a new subspecies from the Antarctic. pp.
79 – 113. In: K. S. Norris (ed.) Whales, dolphins, and porpoises. University of California Press, Berkeley, CA. 789
pp.
Kasamatsu, F., Joyce, G., Ensor, P. and Mermoz, J. 1996. Current occurrence of baleen whales in Antarctic waters. Report
of the International Whaling Commission 46: 293 – 304.
Kasamatsu, F., Matsuoka, K. and Hakamada, T. 2000. Interspecific relationships in density among the whale community
in the Antarctic. Polar Biology 23: 466–473.
Kato, H., Miyashita, T. and Shimada, H. 1995. Segregation of the two subspecies of the blue whale in the Southern Hemi-
sphere. Rep. int. Whal. Commn 45: 273–283.
Kato, H., Matsuoka, K., Nakamura, G. and Best, P. B. In press. A note on sightings of dwarf minke whales in the South-
ern Hemisphere made under the IWCʼs IDCR/SOWER Programme. J. Cetacean Res. Manage.
Kishino, H., Kato, H., Kasamatsu, F. and Fujise, Y. 1991. Detection heterogeneity and estimation of population charac-
teristics from the field survey data: 1987/88 Japanese feasibility study of the Southern Hemisphere minke whales.
Annals of the Institute of Statistical Mathematics 43: 435 – 453.
Mackintosh, N. A. 1966. Distribution of southern blue and fin whales. pp. 125 – 144. In: K. S. Norris (ed.) Whales, dol-
phins, and porpoises. University of California Press, Berkeley, CA. 789 pp.
Matsuoka, K., Ensor, P., Hakamada, T., Shimada, H. Nishiwaki, S., Kasamatsu, F. and Kato, H. 2003a. Overview of minke
whale sightings surveys conducted on IWC/IDCR and SOWER Antarctic cruises from 1978/79 to 2000/01. Journal
of Cetacean Research and Management 5: 173 – 201.
Matsuoka, K., Watanabe, T., Ichi, T., Shimada, H. and Nishiwaki, S. 2003b. Large whale distributions (south of 60°S,
35°E – 130°E) in relation to the southern boundary of the ACC. pp. 26 – 30. In: A. H. L. Huiske, W. W. C. Gieskes, J.
Rozema, R. M. L. Schrno, S. M. van der Vies and W. J. Wolff (eds.) Antarctic Biology in a Global Context. Backhuys
Publishers, Leiden, The Netherlands. 338 pp.
Matsuoka, K., Hakamada, T., Kiwada, H., Murase H. and Nishiwaki, S. 2011. Abundance estimates and trends for hump-
Cetacean Population Studies (CPOPS)
34 Vol. 2, 2020, 15-38DENSITY DISTRIBUTION OF ANTARCTIC WHALES
back whales (Megaptera novaeangliae) in the Antarctic Areas IV and V based on JARPA sighting data. Journal of
Cetacean Research and Management (Special Issue) 3: 75 – 94.
Matsuoka, K. and Hakamada, T. 2014. Estimates of abundance and abundance trend of the blue, fin and southern right
whales in Areas IIIE-VIW, south of 60°S, based on JARPA and JARPAII sighting data (1989/90 – 2008/09). Paper
SC/F14/J5 presented to the IWC/SC Review Workshop of the Japanese Whale Research Program under Special
Permit in the Antarctic-Phase II (JARPAII), February 2014 (unpublished). 27 pp. [Available from the Secretariat of
IWC].
Miyashita, T., Kato, H. and Kasuya, T. (eds.) 1995. Worldwide Map of Cetacean Distribution based on Japanese Sighting
Data (Volume 1). National Research Institute of Far Seas Fisheries, Shimizu, Japan. 140 pp.
Murase, H., Matsuoka, K., Ichii, T. and Nishiwaki, S. 2002. Relationship between the distribution of euphausiids and
baleen whales in the Antarctic (35°E–145°W). Polar Biology 25: 135 – 145.
Murase, H., Shimada, H. and Kitakado, T. 2005. Alternative estimation of Antarctic minke whale abundance taking
account of possible animals in the unsurveyed large polynya using GAM-based spatial analysis: A case study in Area
II in 1997/98 IWC/SOWER. Paper SC/57/IA6 presented to the IWC Scientific Committee, May-June 2005 (unpub-
lished). 20 pp. [Available from the Secretariat of IWC].
Murase, H., Matsuoka, K., Hakamada, T. and Kitakado, T. 2014. Preliminary analysis of changes in spatial distribution
of Antarctic minke and humpback whales in Area IV during the period of JARPA and JARPAII from 1989 to 2006.
Paper SC/F14/J18 presented to the IWC/SC Review Workshop of the Japanese Whale Research Program under Spe-
cial Permit in the Antarctic-Phase II (JARPAII), February 2014 (unpublished). 17 pp. [Available from the Secretariat
of IWC].
Naganobu, M., Nishiwaki, S., Yasuma, H., Matsukura, R., Takao, Y., Taki, K., Hayashi, T., Watanabe, Y., Yabuki, T., Yoda,
Y., Noiri, Y., Kuga, M., Yoshikawa, K., Kokubun, N., Murase, H., Matsuoka, K. and Ito, K. 2006. Interactions
between oceanography, krill and baleen whales in the Ross Sea and Adjacent Waters: An overview of Kaiyo Maru-
JARPA joint survey in 2004/05. Paper SC/D06/J23 presented to the JARPA Review Meeting, December 2006 (unpub-
lished). 33 pp. [Available from the Secretariat of IWC].
Naganobu, M., Matsuoka, K. and Kutsuwada, K. 2014. Consideration on the Kerguelen-Davis Oscillation Index (KDOI)
influencing variability on environmental ecosystem in the Prydz Bay Region, east Antarctic: data exploration. Paper
SC/F14/J21 presented to the IWC/SC Review Workshop of the Japanese Whale Research Program under Special
Permit in the Antarctic-Phase II (JARPAII), February 2014 (unpublished). 12 pp. [Available from the Secretariat of
IWC].
Nishiwaki, S., Ishikawa, H., Goto, M., Matsuoka, K. and Tamura, T. 2014. Review of general methodology and survey
procedure under the JARPA II. Paper SC/F14/J2 presented to the IWC/SC Review Workshop of the Japanese Whale
Research Program under Special Permit in the Antarctic-Phase II (JARPAII), February 2014 (unpublished). 34 pp.
[Available from the Secretariat of IWC].
Ohsumi, S. and Kasamatsu, F. 1985. Recent off-shore distribution of the southern right whale in summer. Report of the
International Whaling Commission (Special Issue) 10: 177 – 185.
Pastene, L. A., Acevedo, J., Goto, M., Zerbini, A. N., Acuna P. and Aguayo-Lobo, A. 2010. Population structure and pos-
sible migratory links of common minke whales, Balaenoptera acutorostrata, in the Southern Hemisphere. Conserv
Genet (2010) 11: 1553–1558. DOI: 10.1007/s10592-009-9944-7
Pastene, L. A. and Goto, M. 2016. Genetic characterization and population genetic structure of the Antarctic minke whale
Balaenoptera bonaerensis in the Indo-Pacific region of the Southern Ocean. Fish. Sci. 82, 873 – 886.
Pastene, L. A., Goto, M., Taguchi, M. and Matsuoka, K. 2019. Distribution and possible areas of spatial mixing of two
stocks of humpback whales, a krill predator, in the Indo-Pacific region of the Antarctic revealed by genetic analyses.
Paper WG-EMM-2019/67 presented to the CCAMLR WG-EMM-19, July 2019 (unpublished). 10 pp.
Rice, D. W. (ed.) 1998. Marine mammals of the world: systematics and distribution. Society for Marine Mammalogy,
Lawrence, KS. 231 pp.
Shimada, H. and Kato, A. 2007. Population assessment of the Antarctic minke whale within and out ice field using a
sighting data by the Ice Breaker and the IWC SOWER vessels in 2004/2005. Paper SC/59/IA16 presented to the IWC
Scientific Committee, May 2007 (unpublished). 8 pp. [Available from the Secretariat of IWC].
Sremba, A. L., Hancock-Hanser, B., Branch, T. A., LeDuc, R. L. and Baker, C. S. 2012. Circumpolar diversity and geo-
graphic differentiation of mtDNA in the critically endangered Antarctic blue whale (Balaenoptera musculus interme-
dia). PLoS One 7(3): e32579. doi: 32510
Watanabe, T., Okazaki, M. and Matsuoka, K. 2014. Results of oceanographic analyses conducted under JARPA and
JARPAII and possible evidence of environmental changes. Paper SC/F14/J20 presented to the IWC/SC Review
Workshop of the Japanese Whale Research Program under Special Permit in the Antarctic-Phase II (JARPAII), Feb-
ruary 2014 (unpublished). 10 pp. [Available from the Secretariat of IWC].
Williams, R., Kelly, N., Boebel, O., Friedlaender, A. S., Herr, H., Kock, K. H., Lehnert, L. S., Maksym, T., Roberts, J.,
Scheidat, M., Siebert, U. and Brierley, A. S. 2014. Counting whales in a challenging, changing environment. Sci. Rep.
4. DOI: 10.1038/srep04170
Received: October 17, 2019
Accepted: March 31, 2020
Cetacean Population Studies (CPOPS)
Vol. 2, 2020, 15-38 35MATSUOKA AND HAKAMADA
© ICR
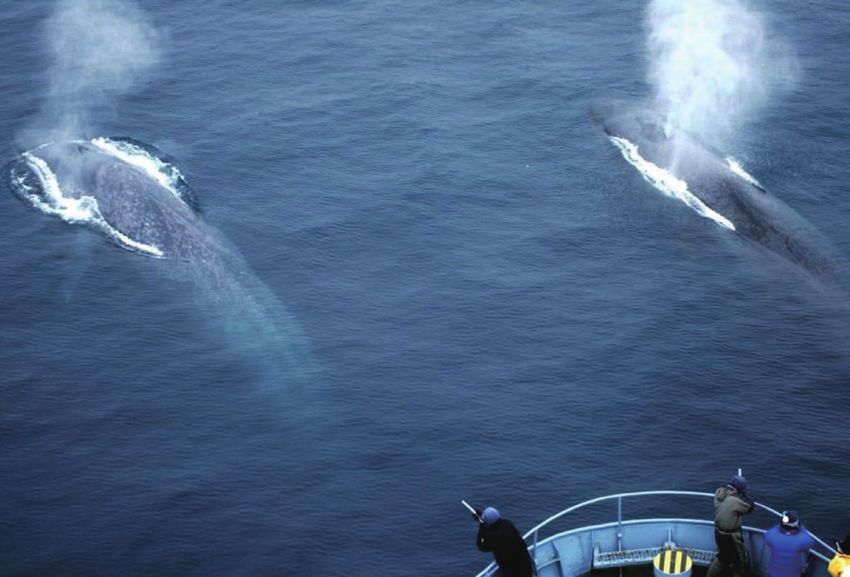
Photo 1. Two surfacing Antarctic blue whales during biopsy experiment in the Antarctic.
© ICR
Photo 2. Five fin whales surfacing in the Antarctic.
© ICR
Photo 3. Surfacing sei whale.
Cetacean Population Studies (CPOPS)
36 Vol. 2, 2020, 15-38DENSITY DISTRIBUTION OF ANTARCTIC WHALES
© ICR
Photo 4. Seven Antarctic minke whales surfacing near pack-ice.
© ICR
Photo 5. Surfaced humpback whale in the Antarctic.
© ICR
Photo 6. Surfacing southern right whale during biopsy experiment in the Antarctic.
Cetacean Population Studies (CPOPS)
Vol. 2, 2020, 15-38 37MATSUOKA AND HAKAMADA
© ICR
Photo 7. Surfacing sperm whales near pack-ice in the Antarctic.
© ICR
Photo 8. Surfacing southern bottlenose whales in the Antarctic.
© ICR
Photo 9. Killer whales in the Antarctic.
Cetacean Population Studies (CPOPS)
38 Vol. 2, 2020, 15-38You can also read