ASSESSMENT OF SNOW CRAB (CHIONOECETES OPILIO) IN THE SOUTHERN GULF OF ST. LAWRENCE (AREAS 12, 19, 12E AND 12F) TO 2018 AND ADVICE FOR THE 2019 FISHERY
←
→
Page content transcription
If your browser does not render page correctly, please read the page content below
Canadian Science Advisory Secretariat
Gulf Region                                                    Science Advisory Report 2019/010

  ASSESSMENT OF SNOW CRAB (CHIONOECETES OPILIO)
IN THE SOUTHERN GULF OF ST. LAWRENCE (AREAS 12, 19,
12E AND 12F) TO 2018 AND ADVICE FOR THE 2019 FISHERY

 Snow crab (Chionoecetes opilio)
 Credit: Fisheries and Oceans Canada

                                                       Figure 1. Map of the southern Gulf of St. Lawrence
                                                       showing the Crab Fishing Areas (12, 12E, 12F,
                                                       and 19), the 2018 static closure zone (box) to
                                                       minimize fishery interactions with North Atlantic
                                                       right whales, fishing grounds, and management
                                                       buffer zones (shaded area). Fishing grounds are
                                                       labeled as follows: 1) Chaleur Bay, 2) Shediac
                                                       Valley, 3) Orphan Bank, 4) Bradelle Bank, 5)
                                                       Magdalen Channel, 6) Cape Breton Corridor, 7)
                                                       Laurentian Channel, and 8) American Bank.

 Context:
 Snow crab, Chionoecetes opilio, has been commercially exploited in the southern Gulf of St. Lawrence
 since the mid-1960s. There are four individually managed fishing areas among which Area 12 (Figure 1)
 is the largest fishery in terms of its fishable surface, number of participants and landings. In Areas 12,
 12E and 12F, the fishing season generally starts in April or May as soon as the Gulf is clear of ice
 and continues into early summer. In Area 19, the fishery opens after June 30 and typically ends in mid-
 September. The landing of females is prohibited and only hard-shelled males ≥ 95 mm of carapace width
 are commercially exploited.
 DFO Gulf Region Fisheries and Aquaculture Management requested an assessment of the resource
 status in 2018 and catch advice for the 2019 fishery. This document provides an overview of the
 assessment results and the science advice. Catch rates and other fishery performance indicators are
 reported. The assessment of the status of the southern Gulf snow crab resource (Areas 12, 19, 12E and
 12F) is based on fishery independent trawl surveys that provide indicators of: abundance (commercial
 biomass), reproductive potential (abundance of mature females), and recruitment. A science peer
 review meeting was conducted January 23-24, 2019 in Moncton, New Brunswick. Participants at the
 science review were from DFO Science, DFO Fisheries and Aquaculture Management, fishing industry,
 Indigenous organizations, and provincial governments.

February 2019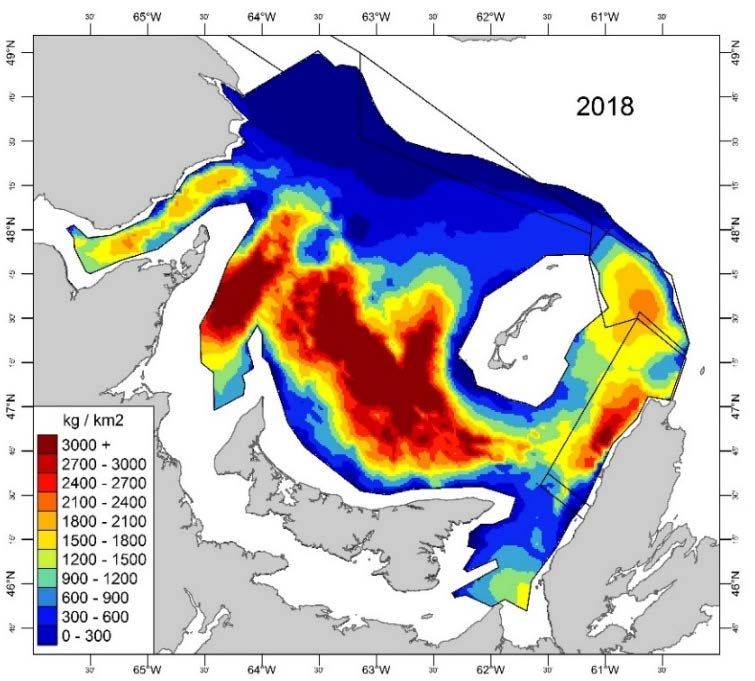
Snow Crab
    Gulf Region                                                  Southern Gulf of St. Lawrence

SUMMARY
•       Snow crab in the southern Gulf of St. Lawrence (sGSL) is considered as a single stock
        unit for assessment purposes. This stock unit comprises of fishing areas 12, 19, 12E, and
        12F.
•       The landings of snow crab from the sGSL in 2018 were 24,260 tonnes (t) from a revised
        quota of 24,439 t.
•       The exploitation rate of the 2018 fishery in the sGSL was estimated at 36.9%.
•       The 2018 post-fishery survey biomass of commercial-sized adult male crabs (carapace
        width (CW) >= 95mm) was estimated at 80,746 t (95% confidence interval of 70,984 to
        91,467 t), an increase of 22.8% from 2017. The estimated biomass for the 2019 fishery,
        derived from the 2018 survey, is within the healthy zone of the Precautionary Approach
        (PA) framework.
•       Total commercial biomass in the 2018 survey was composed 74% of new recruitment
        (59,609 t) and 26% of residual biomass (21,432 t). The estimated recruitment to the
        commercial biomass increased by 16.6% relative to the previous year.
•       Based on the agreed harvest decision rule which has been assessed as compliant with
        the PA, the point estimate of the biomass in the 2018 survey of 80,746 t corresponds to
        an exploitation rate of 40.9% and a Total Allowable Catch (TAC) of 33,025 t for the 2019
        fishery.
•       The risk analysis indicates that the 2019 TAC derived from the harvest decision rule would
        result in a near 100% chance of the biomass for the 2020 fishery being above BUSR and in
        the healthy zone of the PA.
Fishery performance in 2018 in Area 12:
•       The 2018 landings in Area 12 were 20,769 t from a revised quota of 20,909 t.
•       The catch per unit effort (CPUE; expressed as kg per trap haul, kg/th) in 2018 (44.2 kg/th)
        decreased compared to 2017 (72.0 kg/th).
•       The incidence of soft-shelled crab was low in 2018 (4.4%), a decrease compared to 2017
        (6.0%).
Fishery performance in 2018 in Area 19:
•       The 2018 landings in Area 19 were 2,048 t from a revised quota of 2,046 t.
•       The CPUE in 2018 (156.1 kg/th) increased compared to 2017 (142.8 kg/th).
•       The incidence of white-crab decreased from 11.6% in 2017 to 8.8% in 2018.
Fishery performance in 2018 in Area 12E:
•       In Area 12E, the landings were 260 t from a revised quota of 266 t.
•       The CPUE in 2018 (46.6 kg/th) decreased compared to 2017 (60.9 kg/th).
•       The incidence of soft-shelled crab in 2018 remained low, at 4.6% compared to 2.0% in
        2017.
Fishery performance in 2018 in Area 12F:
•       The 2018 landings in Area 12F were 1,183 t from a revised quota of 1,218 t.

                                                  2
Snow Crab
    Gulf Region                                                  Southern Gulf of St. Lawrence

•       The CPUE remained high in 2018 (69.1 kg/th), comparable to 2017 (72.6 kg/th).
•       The incidence of soft-shelled crab was low in 2018 (1.3%), comparable to 2017 (1.9%).

BACKGROUND
Species Biology
Snow crab (Chionoecetes opilio) is a crustacean with a flat, almost circular body and five
pairs of legs. The hard outer shell is periodically shed in a process called molting. After
molting, crabs have a soft shell for a period of 8 to 10 months. Soft-shelled crab is defined by
shell hardness (< 68 durometer units) and includes both new-soft (condition 1) and clean hard-
shelled crab (condition 2). The term white-crab is used in the summer fishery of Area 19 because
the newly-molted crabs have reached a relatively harder carapace than those observed during
the spring fishery (Areas 12, 12E and 12F). White crab is defined by shell hardness < 78
durometer units and includes both new soft (condition 1) and clean hard-shelled crab
(condition 2).
Snow crab do not continue to molt throughout their lifespan. Females stop growing when they
acquire a wide abdomen for carrying eggs, occurring at carapace widths (CWs) less than 95
mm. Males stop growing when they acquire large claws on the first pair of legs, which can
occur at CWs between 40 and 150 mm. Females produce eggs that are carried beneath the
abdomen for approximately two years in the southern Gulf of St. Lawrence (sGSL). The eggs
hatch in late spring or early summer and the newly-hatched crab larvae spend 12-15 weeks in
the water column. At the end of this period, they settle on the bottom. It takes at least 8-9 years
(post-settlement) for males to reach legal commercial size.

Fishery
Until 1994, the snow crab fishery in Area 12 (Figure 1) involved 130 mid-shore crab harvesters
from New Brunswick, Québec, and Nova Scotia. Since 1997, the Prince Edward Island (PEI)
coastal fishery, (formerly Areas 25/26) has been integrated into Area 12. In 2003, a portion of
the coastal fishery off Cape Breton (formerly Area 18) was also integrated into Area 12. For the
purpose of this assessment, Area 12 refers to the management unit that includes snow crab
fishing zones 12, 18, 25, and 26 (as defined in regulation) (Figure 1). The number of allocation
shares in Area 12 was 245 in 2018.
Area 19 (Figure 1) was established in 1978 for the exclusive use of Cape Breton inshore fish
harvesters with vessels less than 13.7 metres (45 feet) in length. There were 158 allocation
shares in Area 19 in 2018.
Areas 12E and 12F were introduced in 1995 as exploratory fisheries. In 2002, the status of
Areas 12E and 12F was changed from exploratory to commercial fishing areas. There were four
snow crab allocation shares in Area 12E (from New Brunswick, PEI and Québec) in 2018. In
Area 12F, there were 16 allocations for regular licenses and 28 temporary allocations in 2018
(from Nova Scotia and Québec). For 2018, harvesters in Area 12F requested a lower Total
Allowable Catch (TAC) than the value originally assigned for the area based on the decision rule.
The minimum legal CW for this male only fishery is 95 mm, soft-shelled and white crab are not
targeted by the fishery. Baited traps, constructed of wire or tubular steel, are used to catch crab,
mainly on mud or sand-mud bottoms and at depths ranging from 50 to 280 m. The fishery takes
place from spring to early summer in Areas 12, 12E and 12F and after June 30 in Area 19.

                                                 3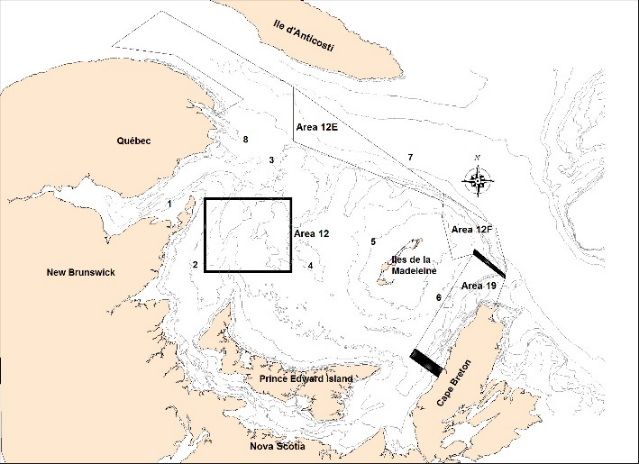
Snow Crab
 Gulf Region                                                          Southern Gulf of St. Lawrence

Management of these fisheries is based on quotas and effort controls (trap allocations, trap
dimensions, and seasons). At-sea soft-shelled and white crab catch monitoring protocols allow
for the closure of portions of fishing areas when the proportion of these males exceeds 20% in
the catch. The protocols are in place to maximize the yield and the reproductive potential of the
resource. In 2018, in order to minimize fishery interactions with North Atlantic right whales, a
closure zone (static) was implemented in Area 12 (Figure 1) which represented 28 fishing grids
measuring 6,490 km2 (DFO 2018). Temporary closures were also implemented, affecting 36
additional grids in the area adjacent to the static closure zone (DFO 2018), at different times
during the fishing season, based on confirmed observations of North Atlantic right whales.
These closures displaced some of the fishing effort from traditional grounds in 2018.

Table 1. Number of allocation shares, vessels, traps, revised quotas, opening dates, and dates of the last
landing of the snow crab fishery by management area in the southern Gulf of St. Lawrence in 2018.
  Characteristics             Area 12         Area 12E        Area 12F         Area 19       Southern Gulf
  Allocation shares 1           245               4               44             158               451
  Number of active
                                322               4               23             108               457
  vessels
  Total number of traps
                               36,534            475            2,152           1,699            40,860
  allowed
  Opening date                April 29         April 26        April 19        July 11               -
  Date of the last
                               July 1         June 30          June 27        August 1               -
  landing
  Revised quota (t) 2          20,909            266            1,218           2,046           24,439 3
  Landings (t)                 20,769            260            1,183           2,048            24,260
1 The number of quota allocations among which the Total Allowable Catch (TAC) is divided (Source: DFO

Administrative List for Snow Crab Areas 12, 12E, 12F, and 19).
2 For reasons of interannual quota adjustments, reconciliations, and re-distribution of the scientific quota

among areas, the revised quota does not necessarily correspond to the TAC in the notice to harvesters.
3 Quota includes 459 t set aside to finance the trawl survey in 2018 (under Section 10 of the Fisheries

Act).
The landings from the sGSL were low in the 1970s and increased with four periods of high
landings: 1981-1986, 1994-1995, 2002-2009, and more recently 2012 to 2018 (Figure 2). Snow
crab landings from the sGSL in 2018 were 24,260 t from a revised quota of 24,439 t.

                                                     4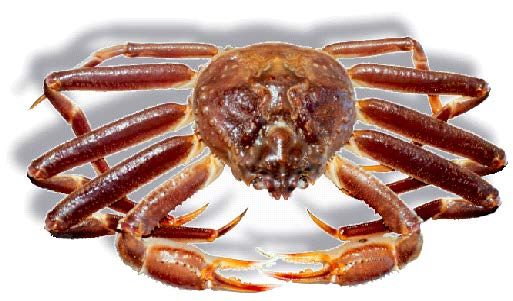
Snow Crab
 Gulf Region                                                                   Southern Gulf of St. Lawrence

Figure 2. Landings (tonnes; t) in the southern Gulf of St. Lawrence snow crab fishery by fishing area from
1969 to 2018.

The 2018 fishing season in Area 12 opened on April 29 and the last landings were recorded
on July 1 with reported landings of 20,769 t from a revised quota of 20,909 t (Tables 1 and 2;
Figure 2). In accordance with the soft-shelled crab protocol, four grids that were open to fishing
were closed during the 2018 fishing season compared to 57 in 2017. The fishing effort
estimated from logbooks has varied from 161,148 to 553,125 trap hauls between 1987 and
2018, with the lowest effort in 2010 and the highest effort in 2017 (Hébert et al. 2018). The
fishing effort was 469,887 trap hauls in 2018, a decrease from 2017 (553,125 trap hauls) (Table
2).

Table 2. Quota and landings (tonnes; t), catch per unit of effort (CPUE; kg/trap-haul), fishing effort (trap
hauls), soft-shelled crab percentages, and associated closed grids for the snow crab fishery in Area 12,
2010 to 2018.
Fishery descriptor          2010       2011      2012         2013    2014       2015       2016      2017       2018
Quota (t)   1                7,700     8,585     18,143     22,548    19,409     23,021    19,393     39,651    20,909
Landings (t)                 7,719     8,618     18,159     22,645    19,633     23,080    19,499     39,825    20,769
CPUE (kg/trap-haul)   2      47.9       53.0      68.0        76.4     61.8       67.9      64.0       72.0      44.2
 Effort (trap hauls)         161,148 162,604 267,044 296,398 317,689 339,912 304,624 553,125 469,887
 Soft-shelled crab
                               6.5        6.2       3.7          2.8      4.4       4.9        5.3        6.0        4.4
 (%) in catches 3
 Grids closed
                               74        233         7            5        8        41          5         57          44
 (total of 323)
1 Since 2012, quotas were revised for interannual quota adjustments, reconciliations, and re-distribution of the

scientific quota among areas, the revised quotas do not necessarily correspond to the TAC in the notice to
harvesters.
2 CPUE values are not standardized and do not account for changes in management measures.
3 The percentages are based on durometer readings < 68. Catches are defined as male crabs of all sizes.
4 Grids closed according to the soft-shelled crab protocol. Additional closures to minimize fishery interactions with

North Atlantic right whales are not accounted for in this table.

The 2018 fishing season in Area 19 opened on July 11 and the last date of landings was
August 1 with reported landings of 2,048 t from a revised quota of 2,046 t (Tables 1 and 3;
Figure 2). In accordance with the white crab protocol, one sector within Area 19 was closed

                                                          5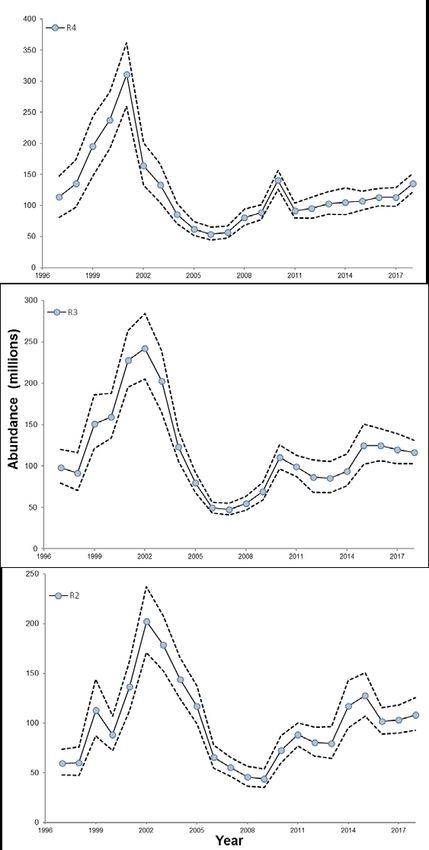
Snow Crab
 Gulf Region                                                                    Southern Gulf of St. Lawrence

during the 2018 fishing season. Since 2011 and as per industry request, the white crab protocol
in Area 19 is based on a durometer reading of < 72 units instead of < 78 durometer units as per
the original white crab definition (Hébert et al. 2012). The fishing effort in Area 19 has varied
from 11,138 to 56,517 trap hauls between 1987 and 2018, with the lowest effort in 2010 and the
highest effort in 2004 (Hébert et al. 2018). The effort in 2018 was 13,120 trap hauls, a decrease
from 2017 (Table 3).

Table 3. Quota and landings (tonnes; t), catch per unit of effort (CPUE; kg/trap-haul), fishing effort (trap
hauls), white crab percentages, and associated closed sectors for the snow crab fishery in Area 19, 2010
to 2018.
Fishery descriptor           2010       2011      2012         2013     2014      2015       2016       2017        2018
Quota (t)   1
                             1,360     1,703      2,907      2,654     3,745      2,130      1,701      2,945       2,046
Landings (t)                 1,360     1,701      2,906      2,657     3,745      2,129      1,701      2,944       2,048
CPUE (kg/trap-haul)   2
                             122.1     133.3      178.1      148.5     147.4      144.8      142.5      142.8       156.1
Effort (trap hauls)         11,138     12,761    16,317     17,890     25,407     14,703    11,937     20,616       13,120
White crab
                              6.4       11.5       4.5         3.0       1.0       5.5        8.2        11.6        8.8
(%) in catches 3
Sectors closed 4              4/9        0/9       0/9         0/9       0/9       2/9        4/9        3/9         1/9
1 Since  2012, quotas were revised for interannual quota adjustments, reconciliations, and re-distribution of the
scientific quota among areas, the revised quotas do not necessarily correspond to the TAC in the notice to
harvesters.
2 CPUE values are not standardized and do not account for changes in management measures.
3 The percentages are based on durometer readings < 72. Catches are defined as male crabs of all sizes.

4 Total number of sectors was changed from 4 to 9 in 2009.

The 2018 fishing season in Area 12E began on April 26 and the date of last landings was
June 30 with reported landings of 260 t from a revised quota of 266 t (Tables 1 and 4; Figure 2).
The fishing effort in Area 12E has varied from 1,825 to 10,074 trap hauls between 1995 and
2018, with the lowest effort in 2010 and the highest effort in 2006 (Hébert et al. 2018). The
fishing effort in Area 12E increased from 3,333 trap hauls in 2017 to 5,579 trap hauls in 2018. In
accordance with the soft-shelled protocol, no grids within Area 12E were closed during the 2018
fishing season.

Table 4. Quota and landings (tonnes; t), catch per unit of effort (CPUE; kg/trap-haul), fishing effort (trap
hauls), soft-shelled crab percentages, and associated closed grids for the snow crab fishery in Area 12E,
2010 to 2018.
Fishery descriptor           2010       2011      2012         2013     2014      2015       2016       2017        2018
Quota (t) 1                   67         75        251         204       170       189        144       199          266
Landings (t)                  50         76        185         204       178       192        144       203          260
CPUE (kg/trap-haul)   2      27.4       31.5       32.9        40.1     47.3       65.8       51.5      60.9         46.6
 Effort (trap hauls)        1,825      2,413     5,623      5,097     3,765      2,918      2,796      3,333     5,579
 Soft-shelled crab
                             14.7       8.4       3.3        15.9      7.8        9.8        1.1        2.0       4.6
 (%) in catches 3
 Grids closed
                               0         0         0          0         0          0          0          0         0
 (total of 8)
1 Since 2012, quotas were revised for interannual quota adjustments, reconciliations, and re-distribution of the

scientific quota among areas, the revised quotas do not necessarily correspond to the TAC in the notice to
harvesters.
2 CPUE values are not standardized and do not account for changes in management measures.
3 The percentages are based on durometer readings < 68. Catches are defined as male crabs of all sizes.

                                                           6
Snow Crab
Gulf Region Southern Gulf of St. Lawrence
In Area 12F, the fishery in 2018 opened on April 19 and the last date of recorded landings was
June 27 with reported landings of 1,183 t from a revised quota of 1,218 t (Tables 1 and 5; Figure
2). The fishing effort in Area 12F has varied from 4,437 to 23,163 trap hauls between 1995 and
2018, with the lowest effort in 2002 and the highest effort in 2014 (Hébert et al. 2018). The
fishing effort increased from 9,421 trap hauls in 2017 to 17,120 trap hauls in 2018. In
accordance with the soft-shelled protocol, no sector within Area 12F was closed during the 2018
fishing season.
Table 5. Quota and landings (tonnes; t), catch per unit of effort (CPUE; kg/trap-haul), fishing effort (trap
hauls), soft-shelled crab percentages, and associated closed sectors for the snow crab fishery in Area
12F, 2010 to 2018.
Fishery descriptor 2010 2011 2012 2013 2014 2015 2016 2017 2018
Quota (t) 1 420 314 706 543 906 516 373 680 1,218
Landings (t) 420 313 706 543 882 510 381 684 1,183
CPUE (kg/trap-haul) 2 29.3 32.5 41.8 49.0 38.1 38.2 43.9 72.6 69.1
Effort (trap hauls) 14,335 9,631 16,890 11,086 23,163 13,351 8,667 9,421 17,120
Soft-shelled crab
8.6 2.6 9.4 2.4 1.7 3.3 10.4 1.9 1.3
(%) in catches 3
Sectors closed
2 0 0 0 0 0 0 0 0
(total of 3)
1 Since 2012, quotas were revised for interannual quota adjustments, reconciliations, and re-distribution of the
scientific quota among areas, the revised quotas do not necessarily correspond to the TAC in the notice to
harvesters.
2 CPUE values are not standardized and do not account for changes in management measures.
3 The percentages are based on durometer readings < 68. Catches are defined as male crabs of all sizes.
Catch per unit of effort (CPUE), an index of fishery performance, expressed as kilogram (kg) per
trap-haul (kg/th), is calculated directly from logbook data, as the ratio of total landings (kg) to total
effort (trap-hauls). CPUE values are not standardized and do not account for changes in
management measures and fishing practices and as a result may not be directly proportional to
biomass. In Area 12, the annual mean CPUE decreased in 2018 (44.2 kg/th) compared to 2017
(Table 2; Figure 3). In Area 19, the CPUE (156.1 kg/th) in 2018 increased compared to 2017
(Table 3, Figure 3). The CPUE decreased in Area 12E (46.6 kg/th) in 2018 compared to 2017
while in Area 12F, the CPUE (69.1 kg/th) in 2018 is comparable to 2017 (Tables 4 and 5;
Figure 3).
7Snow Crab Gulf Region Southern Gulf of St. Lawrence Figure 3. Catch per unit effort (CPUE; kg / trap-haul) in the southern Gulf of St. Lawrence snow crab fishery, Areas 12 (black squares), 19 (open squares), 12E (black circles) and 12F (open circles), based on logbooks, 1997 to 2018. The percentage of soft-shelled crab and white crab is calculated using data collected from the at-sea observer program. The incidence of soft-shelled crab and white crab in catches is strongly influenced by the fishing strategy used by harvesters during the season, as well as the abundance of hard-shell commercial-sized adult crab in the area. The percentage of soft-shelled crab in Area 12 in 2018 was 4.4%, a decrease from 2017, and has remained low since 2008 (Hébert et al. 2018; Table 2). In Area 19, the percentage of white crab was 8.8% in 2018, a decrease from 2017 (Table 3). The percentage of soft-shelled crabs in Area 12E in 2018 was 4.6%, comparable to 2017 (Table 4). In Area 12F, the percentage of soft- shelled crabs in 2018 was 1.3%, comparable from 2017 (Table 5). ASSESSMENT Snow crab in the sGSL is considered as a single stock unit for assessment purposes. This stock unit comprises fishing areas 12, 19, 12E, and 12F. The survey in 2018 was financed through a collaborative agreement with the fishing industry under Section 10 of the Fisheries Act. The survey design and biomass estimation polygon cover the entire area of the sGSL defined by the 20 to 200 fathoms depth contours (which approximately corresponds to the areal extent of bottom temperatures
Snow Crab
 Gulf Region                                                       Southern Gulf of St. Lawrence

successfully trawl the area. The survey was conducted between July 19 and September 16,
2018. Sampling protocols were identical to previous years.
Small adjustments were made to the 2018 polygons used for kriging. The sGSL survey polygon
has been revised to 57,842.8 km2 compared to the previous value of 57,840 km2. An error in the
coding, which resulted in incorrect sill and nugget parameters used in the kriging, was
corrected. The entire time series of snow crab biomass and abundance estimates since 1997
was re-estimated. The consequences to the annual estimated commercial biomass values are
minor; with differences ranging from -2.0% to 1.2%. Adjustments to the PA reference points
(and associated harvest decision rule) were not considered to be required.

Figure 4. The survey and estimation polygon of 57,842.8 km2 used for the 2018 snow crab stock
assessment in the southern Gulf of St. Lawrence (all of the coloured areas) and corresponding estimation
polygons for the four crab fishing areas (12, 12E, 12F, and 19). The unassigned zone north of areas 12E
and 12F (label A) and buffer zones (labels B and C) are also shown.

Stock Trends and Current Status in the sGSL
Interpretation of stock status is based on inferences from abundance data from the snow crab
trawl surveys usually conducted from July to October, over the entire area of snow crab
distribution in the sGSL. The surveys provide estimates of commercial biomass which are
comprised of residual biomass (hard-shelled adult males of legal size remaining after the
fishery) and recruitment biomass (soft-shelled adult males >= 95 mm CW defined as R-1 that
will be available to the fishery the following fishing season). The snow crab trawl survey also
provides indices of future male recruitment to the fishery (pre-recruits defined as R-4, R-3 and
R-2). The pre-recruits R-4, R-3 and R-2 represent adolescent male crabs with a CW range of
56-68, 69-83, and larger than 83 mm, respectively. A portion of these crabs could be available
to the fishery in 4, 3 and 2 years, respectively. An index of abundance of small male crabs (34-
44 mm CW) is also presented as an indicator of potential long-term recruitment. It takes at least
six years for these small male crabs to reach the commercial size of 95 mm CW.

                                                   9
Snow Crab
Gulf Region Southern Gulf of St. Lawrence
Spawning stock abundance consists of females (pubescent and mature). The term pubescent
refers to females that will molt to maturity and mate the following year and become primiparous
females (first brood). The term multiparous refers to females which are carrying a brood for the
second time or more. The term mature females, includes primiparous and multiparous females.
The biomass of commercial-sized adult males in the sGSL from the 2018 trawl survey was
estimated at 80,746 t (95% confidence interval (CI) range of 70,984 t to 91,467 t) (Table 6;
Figure 5). The 2018 commercial biomass in the sGSL increased by 22.8% relative to the 2017
estimate.
The recruitment to the fishery at the time of the 2018 survey was 59,609 t (95% CI 51,755 t to
68,310 t), comprising 74% of the commercial biomass (Table 6; Figure 5). The recruitment to
the fishery in 2018 increased by 16.6% compared to the 2017 estimate. The residual biomass
(carapace conditions 3 to 5) of commercial-sized adult male crabs after the 2018 fishery was
estimated at 21,432 t (95% CI 17,270 t to 26,291 t), an increase of 46.3% compared to the 2017
estimate (Table 6; Figure 5).
Figure 5. Total commercial biomass (black triangles), recruitment commercial biomass (open circles), and
residual commercial biomass (open squares; in 1,000 tonnes, t; means with 95% confidence intervals) in
the southern Gulf of St. Lawrence, 1997 to 2018.
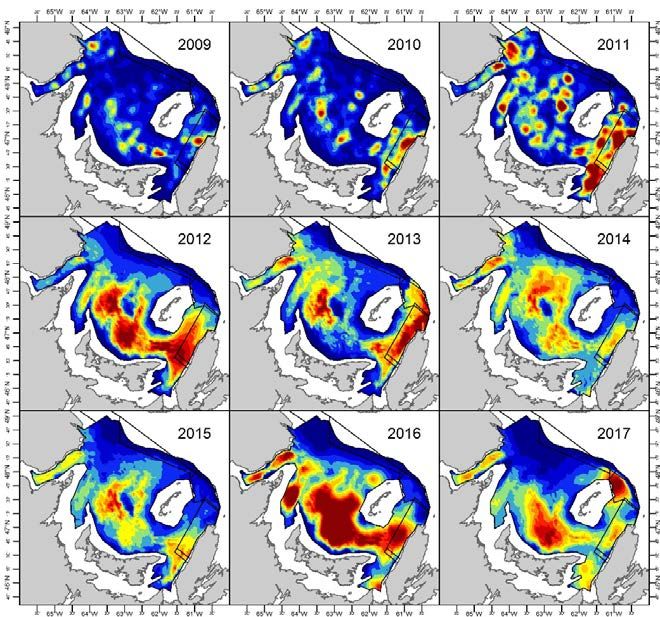
In the 2018 trawl survey, geographic concentrations of commercial-sized adult males were
located in Bradelle Bank, in Chaleur Bay, in the central and southern parts of the Magdalen
Channel and in the southeastern part of the sGSL (Figure 6). The spatial distributions of
commercial-sized adult males have varied annually during increasing and decreasing phases of
the commercial biomass (Figure 7).
The exploitation rate in the sGSL is calculated as the ratio between the catch of the fishery in
the year of the assessment and the commercial biomass estimated from the trawl survey in the
previous year. Exploitation rates have varied between 21.0% and 44.7% from 1998 to 2018
(Figure 8). In 2018, the exploitation rate was 36.9% as specified with the use of the approved
harvest decision rule.
10Snow Crab
Gulf Region Southern Gulf of St. Lawrence
Table 6. Total commercial, recruitment, and residual biomass (in tonnes, t; means with 95 % confidence
intervals) of commercial-sized adult male crabs (>= 95 mm carapace width) in the southern Gulf of St.
Lawrence, 2008 to 2018.
Year of the Commercial Recruitment Residual
survey Biomass (t) Biomass (t) Biomass (t)
52,921 32,241 20,981
2008
47,167-59,178 27,929-37,027 17,989-24,327
31,015 20,618 10,454
2009
27,519-34,829 17,747-23,818 8,687-12,474
35,929 20,477 15,490
2010
32,049-40,147 17,815-23,423 13,022- 18,289
62,841 29,643 33,679
2011
55,985-70,299 25,676-34,045 28,430-39,613
74,778 49,010 25,615
2012
64,881-85,748 40,382-58,931 21,607-30,147
66,709 39,988 27,092
2013 54,294-81,108 31,504-50,055 22,041-32,952
67,990 44,285 23,863
2014 59,802-76,978 37,440-52,014 20,356-27,799
58,927 34,982 24,108
2015 51,368-67,278 29,145-41,643 20,290-28,429
98,394 74,124 24,309
2016 87,150-110,677 64,811-84,392 20,876-28,143
65,738 51,127 14,650
2017 57,221-75,157 43,976-59,103 12,134-17,534
80,746 59,609 21,432
2018 70,984-91,467 51,755-68,310 17,271-26,291
Figure 6. Density (kg per km2) contours of commercial-sized adult male crabs with a carapace width equal
to or larger than 95 mm in the southern Gulf of St. Lawrence in 2018, based on the snow crab trawl
survey.
11Snow Crab
Gulf Region Southern Gulf of St. Lawrence
Figure 7. Density (kg per km2) contours of commercial-sized adult male crabs with a carapace width equal
to or larger than 95 mm in the southern Gulf of St. Lawrence, 2009 to 2017.
Total annual mortality is calculated as one minus the proportion of the residual biomass
estimated from the survey in the year of the assessment divided by the biomass available to the
fishery as estimated in the previous year’s survey. In 2018, total mortality was estimated at
67.4% (Figure 8). The total mortality has varied between 46.1% and 85.1% from 1998 to 2018,
except for 2011 when it was estimated at 6.3% (Figure 8).
Over the time series, the estimated commercial biomass from the survey was 29.5% higher than
the sum of the residual biomass and the landings of the following year. This difference (termed
non-fishing directed mortality) and the associated inter-annual variability could be attributed to a
number of factors including misattribution of recruitment and residual groups, variability in
survey estimates, natural mortality, by-catch mortality, unreported landings, as well as crab
movement in and out of the sampling area.
12Snow Crab
Gulf Region Southern Gulf of St. Lawrence
Figure 8. Exploitation rates (open squares; means and 95% confidence intervals) by the fishery and total
mortality (black circles) of commercial-sized adult male snow crab (≥ 95 mm carapace width) in the
southern Gulf of St. Lawrence, 1998 to 2018. The 2011 total mortality point (open circle) is isolated from
the series due to uncertainties.
The 2018 commercial biomass estimates in snow crab fishing areas (12, 19, 12E and 12F), two
buffer zones (between Areas 12F and 19, between Areas 12 and 19) and the unassigned zone
(north of Areas 12E and 12F), as shown in Figure 4, are summarized in Table 7. The majority of
biomass was found in Area 12, followed by Area 19, 12F, 12E, buffer zones, and the
unassigned zone (Table 7). Estimating the commercial biomass by fishing area results in values
with larger confidence intervals. This situation of high uncertainty is more pronounced in small
fishing areas, as they contain fewer sampling stations.
Table 7. Estimates of commercial biomass (in tonnes, t; means and 95% confidence intervals) in 2018 for
the southern Gulf of St. Lawrence estimation polygon of 57,842.8 km2 and for each of the snow crab
fishing areas 12, 19, 12E, 12F, the buffer zones, and the unassigned zone. Labels refer to those in
Figure 4.
Surface area Commercial biomass (t)
Area (km 2) Mean 95% confidence intervals
Southern Gulf 1 57,842.8 80,746 70,984 – 91,467
Area 12 48,074 68,953 60,344 – 78,439
Area 19 3,813 6,825 4,955 – 9,173
Area 12E 2,436.9 425 21 – 2,155
Area 12F 2,426.8 3,883 2,452 – 5,855
Subtotal of crab fishing areas 56,750.7 80,086 na
Unassigned zone
667.9 214 11 – 1,074
above 12E and 12F (label A)
Buffer zone
134.2 234 84 - 523
19 / 12F (label B)
Buffer zone
289.5 255 35 – 923
12 / 19 (label C)
Total of all individual area
57,842.7 80,789 na
estimates 1
1 Small difference in the sum of all individual area estimates compared to the southern Gulf estimates is due to
rounding of intermediate calculations.
13Snow Crab
Gulf Region Southern Gulf of St. Lawrence
Based on abundances of adolescent males of R-4, R-3 and R-2 from recent surveys, the
predicted recruitment of commercial-sized adult male crabs for the 2019 survey, available for
the 2020 fishery, was estimated at 49,820 t (95% CI 33,790 to 70,970 t) (Figures 9 and 10).
Figure 9. Estimated (black circles are the means with 95% confidence interval vertical bars) and predicted
(open squares are the means with the 95% confidence interval bands as dashed lines) biomasses of R-1
(adult male crabs >= 95 mm carapace width of carapace condition 1 and 2) snow crab in the year of the
survey, 1997 to 2018. The predicted abundances are based on a relationship to the estimated
abundances of R-2 (adolescent male crabs with a carapace width larger than 83 mm) in the previous
year. Prediction of R-1 biomass for 2019 is based on abundances of R-2 estimated in 2018 and shown in
Figure 10.
14Snow Crab
Gulf Region Southern Gulf of St. Lawrence
Figure 10. Estimated abundances (in millions; means and 95% confidence intervals) of R-4 (upper panel),
R-3 (middle panel) and R-2 (lower panel) adolescent male crabs in the southern Gulf of St. Lawrence for
the survey years 1997 to 2018.
The index of abundance of small male crabs (34-44 mm of CW) from the trawl survey in 2018
remained at the same level to the index estimated in 2017 (Figure 11).
15Snow Crab
Gulf Region Southern Gulf of St. Lawrence
Figure 11. Index of abundance (in millions; means with 95% confidence intervals) of small male crabs of
34 to 44 mm of carapace width, based on the trawl surveys conducted in the southern Gulf of St.
Lawrence, 1997 to 2018.
Female abundance
The abundance of mature females is showing an increasing trend since 2006 (Figure 12). The
abundance of pubescent females remained high in 2018 compared to the lowest value
observed in the time series(Figure 12).
Figure 12. Estimated abundances (in millions; means and 95% confidence intervals) of mature female
(black circles) and pubescent females (open squares) in the southern Gulf of St. Lawrence based on the
trawl surveys from 1997 to 2018.
Environmental Considerations
In September 2018, near-bottom temperatures were near the mean value of the period 1981 to
2010 in most of the northern portion of Area 12 as well as in Area 19. However, the bottom
waters in the southern portion in Area 12, in Area 12E, Area 12F and the northwestern portion
of the sGSL (channels connecting the slope of the Laurentian Channel to the Magdalen
Shallows) were warmer than normal. Bottom waters outside of Miramichi Bay were also warmer
than average. There was a band of cooler-than-normal bottom waters in the southwestern part
16Snow Crab
Gulf Region Southern Gulf of St. Lawrence
of Area 12 that was stretching down from Miscou Island to the east entrance of Northumberland
Strait including St. George’s Bay. Most of the snow crab fishing grounds in the northern portion
of Area 12 had similar temperatures, or slightly cooler, in 2018 compared to 2017 except at the
head of Chaleur Bay where cooler bottom waters were present. The southern portion of Area 12
had bottom waters that were significantly warmer in 2018 than in 2017. Area 19 bottom water
temperatures in 2018 were similar to those observed in 2017. Areas 12E and 12F had a
tendency to be cooler in 2018 than in 2017. The snow crab habitat index (bottom area with
temperatures from -1 to 3°C) for commercial-sized adult male crab was just below the 1981-
2010 average (1% below) in 2018 and decreased by 5% from 2017 and was similar to the 2016
value (Figure 13). In 2018, the mean temperature (1.2°C) within the defined snow crab habitat
area index (-1 to 3°C) increased by about 0.3°C compared to 2017 (0.9ºC), (Figure 13). The
mean temperature was at the highest of the 48 year time series in 2012, decreased in 2013 and
2014, and remained above the normal since then.
Snow crab is a stenothermic species with a preference for colder water temperatures. A
temperature regime shift from cold to warm may have impacts on population dynamics of snow
crab such as shortened reproductive cycles, increased per capita fecundity, and increased size
at maturity, greater natural mortality, spatial contraction of habitat, and skewed sex ratio for
reproduction. The outcome of climate change on snow crab population dynamics can be
relatively abrupt and even detrimental, and the direction of the effect may be difficult to predict
(Sainte-Marie et al. 2008).
Figure 13. Habitat area index (km²; square symbols) for commercial-sized adult male snow crab in the
southern Gulf of St. Lawrence (water temperatures of -1 to 3 ºC) and the mean temperature (ºC; circle
symbols) within the index area from 1971 to 2018.
Sources of Uncertainty
There have been changes in snow crab survey vessels over the 1997 to 2018 assessment
period, including a change in vessel in 2013 from the vessel which had been used from 2003 to
2012. There have never been any comparative experiments to assess if there were changes in
catchability between vessels. Changes in survey catch rates over time may not accurately
reflect changes in stock size if survey vessels have different catchabilities.
17Snow Crab
Gulf Region Southern Gulf of St. Lawrence
Swept areas, which are used to standardize survey catches, are calculated from trawl wing-
spread measurements. Uncertainty associated with swept area calculations for tows with
insufficient wing-spread data remains unknown.
The unstandardized catch per unit effort from the fishery is weakly correlated with the estimated
biomass from the assessment. This can result in differences in perception of stock abundance
from the fishing industry observations (catch per unit of effort variations within the season and
between years) from those of the commercial biomass estimate from the survey.
There was some discrepancy in the identification of carapace condition 2 during the 2018
survey, increasing the uncertainty in fishery recruitment and residual biomass estimates, as well
as the mortality rates and the prediction of future recruitment in the risk analyses. Development
and utilization of objective methods to assess carapace condition will ensure a comparable
standard in future surveys.
The distribution of snow crab within the sGSL and the proportions of the estimated abundance
of commercial sized adult male crabs in each of the management areas show high inter-annual
variations. The factors determining these relative distributions are not known but are seemingly
related to movements of crab and recruitment pulses rather than survival or exploitation.
Changes in the environment, particularly the size of the Cold Intermediate Layer, are likely
important factors but the influence of these factors on the movements and recruitment dynamics
of crab are presently not known.
In 2018, no snow crab fishing activities took place within the closed areas implemented to
minimize interactions with North Atlantic right whales. Consequently, snow crab located outside
of the closed areas were proportionally fished more intensively to catch the Area 12 fishery
allocation. As expected, the residual biomass in the static closure zone was higher in 2018 than
in recent years. However, the residual biomass estimates and proportions vary annually and the
2018 numbers are within the time series’ ranges. The potential effects of annual closures on the
production and recruitment of the sGSL snow crab population are unknown.
Predicting recruitment is uncertain because of a number of factors including variations in
mortality, growth among stages and the variation in the proportion of pre-recruits that molt in
any given year. In 2015, there was a high abundance and proportion of skip molters (crab that
did not molt that year) in the R-2 stage compared to previous years and it appears that this high
abundance of skip molters resulted in a much higher molting rate and/or survival rate to the
recruitment stage. The high incidence of skip molters (R-2) was not observed since 2015.
Additional information on the factors that lead to skip molting in snow crab, either through
density dependence (competition for resources) or annual variations in food availability, for
example, are needed.
Environmental conditions in the sGSL vary annually and these changes can affect a number of
life history processes including molting and growth, reproduction, and larval development.
Warming of the deep water of the Laurentian Channel may influence bottom temperatures in
adjacent areas and the impacts on the snow crab population remain uncertain.
CONCLUSIONS AND ADVICE
Within the PA framework (DFO 2009), the Limit Reference Point for biomass (Blim ) defines the
critical / cautious zones and an upper stock reference (BUSR) delimits the cautious / healthy
zones on the stock status axis. The upper stock reference point (BUSR) is 41,400 t of
commercial-sized adult males of all carapace conditions as estimated from the trawl survey
(Figure 14; DFO 2012b). The biomass limit reference point (Blim ) value is 10,000 t (Figure 14;
18Snow Crab
Gulf Region Southern Gulf of St. Lawrence
DFO 2012b). The biomass limit reference point was chosen as the lowest biomass of hard
shelled commercial sized adult males which produced good recruitment rates of small male
crabs of 34-44 mm CW (referred to as Instar VIII) (DFO 2010). The removal reference point
(Flim ) is 34.6% (Figure 14; DFO 2012b). The sGSL commercial biomass estimate from the trawl
survey is used for evaluating catch options relative to the defined reference points.
The trajectory of stock abundance (biomass of commercial-sized adult male crabs as estimated
from the trawl survey in the year before the fishery) versus exploitation rate in the fishery year
for snow crab from the sGSL is shown in Figure 14. The commercial biomass has varied
between 31,015 t and 103,146 t during 1997 to 2018. Over this same period, exploitation rates
have varied between 21.0% and 44.7%. The estimated biomass from the 2018 snow crab
survey, which would be available to the fishery in 2019, is 80,746 t (95% CI 70,984 – 91,467 t).
The 2018 survey biomass estimate is in the healthy zone.
Figure 14. Trajectory of stock abundance (biomass of commercial-sized adult male crabs as estimated
from the trawl survey in the year before the fishery) versus exploitation rate in the fishery year for snow
crab from the southern Gulf of St. Lawrence. Year of the fishery is labeled on the figure. Error bars are
95% confidence intervals. Circle symbols are biomass and exploitation rate levels used to define the
reference points. The squares are the years when the reference points were used within the PA to decide
on the fishery quota. The biomass estimate available for the 2019 fishery (with 95% confidence interval)
is also shown.
Harvest decision rules that conform to the PA have been developed (DFO 2014b). These PA
compliant harvest decision rules include rules for which the exploitation rate exceeds Flim when
the stock is in the healthy zone (DFO 2014b). The Snow Crab Advisory Committee agreed on
the proportional harvest decision rule (variant 4 in DFO 2014b, Figure 15) to derive the
exploitation rate and the TAC based on the estimated biomass from the sGSL snow crab
survey. This decision rule and the corresponding estimated commercial biomass from the 2018
survey of 80,746 t, results in a selected exploitation rate of 40.9% and corresponding to a TAC
of 33,025 t for the 2019 fishery (Figure 15).
A risk analysis was developed for the decision rule TAC and relative to other catch levels in
2019 (Table 8). The risk analysis indicates that the TAC derived from the harvest decision rule
will result in a near zero chance of the residual biomass after the fishery being less than Blim and
a near 100% chance of the biomass for the next year’s fishery being above BUSR and in the
19Snow Crab
Gulf Region Southern Gulf of St. Lawrence
healthy zone of the PA (Table 8). The risk analysis also provides predictions of the commercial
biomass in the 2019 survey, assuming the corresponding catch level is taken in 2019. At the
decision rule TAC value of 33,025 t for the 2019 fishery, the commercial biomass predicted for
the 2019 post-fishery survey and for the 2020 fishery, is 83,850 t, with a 95% confidence
interval range of 72,820 to 94,870 t, comparable to the 2018 survey estimates, and in the
healthy zone of the PA framework.
Figure 15. Harvest decision rule (solid black line; proportional variant 4; DFO 2014b) for the southern Gulf
of St. Lawrence snow crab fishery and corresponding exploitation rate (0.409) for the 2019 fishery
resulting from the commercial biomass estimate of 80,746t (dashed-dotted line).
Table 8. Risk analysis of catch options in 2019 for the southern Gulf of St. Lawrence snow crab fishery
showing probabilities of the hard-shell commercial-sized adult male remaining biomass falling below Blim,
and of the total commercial-sized adult male biomass being equal to or above BUSR post-fishery in 2019.
The catch level of 33,025 t based on the agreed harvest decision rule is highlighted in the table. Also shown
is the predicted (mean; 95% confidence interval range) commercial biomass from the 2019 survey assuming
each corresponding catch level is fished.
Probability
< Blim >= BUSR Expected biomass for the
Catch level (t) (10,000 t) (41,400 t) 2019 post-fishery survey
30,000 0 1 86,880 (75,840-97,900)
31,000 0 1 85,880 (74,840-96,900)
32,000 0 1 84,880 (73,840-95,900)
33,000 0 1 83,880 (72,840-94,900)
33,025 0 1 83,850 (72,820-94,870)
34,000 0 1 82,880 (71,840-93,900)
35,000 0 1 81,880 (70,840-92,900)
36,000 0 1 80,880 (69,840-91,900)
37,000 0 1 79,880 (68,840-90,900)
38,000 0 1 78,880 (67,840-89,900)
39,000 0 1 77,880 (66,840-88,900)
40,000 0 1 76,880 (65,840-87,900)
41,000 0 1 75,880 (64,840-86,900)
47,326 0.5 1 69,550 (58,510-80,570)
75,518 1 0.5 41,360 (30,320-52,380)
20Snow Crab
Gulf Region Southern Gulf of St. Lawrence
LIST OF MEETING PARTICIPANTS
Name Affiliation
Adam Jerome Association de gestion halieutique autochtone Mi’kmaq et Malécite (AGHAMM)
Alan Dwyer DFO Fisheries and Aquaculture Management Gulf Region
Amélie Rondeau DFO Science Gulf Region
Basil MacLean Area 19 Snow Crab Fishermen’s Association
Bernard Morin DFO Fisheries and Aquaculture Management Quebec Region
Daniel Desbois Association des crabiers gaspésiens
Darrell Mullowney DFO Science Newfoundland and Labrador Region
David MacEwen Province of Prince Edward Island
Doug Cameron PEI Snow Crab Fishermen Inc.
Francis Parisé Association des crabiers de la baie
Frank Hennessey Association interprovinciale des crabiers zone 12E
Jean Lanteigne Association des pêcheurs professionnels crabiers acadiens Inc
Jean-François Landry DFO Science Gulf Region
Jean-Pierre Plourde Association des pêcheurs spécialistes de poisson de fond
Joël Chassé DFO Science Gulf Region
Joey Aylward PEI Snow Crab Fisherman Association
Kris Vascotto Area 19 Snow Crab Fishermen’s Association
Laura Ramsay PEI Fishermen’s Association
Lyne Morissette Association des crabiers acadiens (ACA)
Marcel Hébert DFO Science Gulf Region
Mark Boyd Area 18 Crab Fishermen’s Association
Mathieu Noël Maritime Fishermen’s Union
Martin Mallet Maritime Fishermen’s Union
Matthew Hardy DFO Science Gulf Region
Mikio Moriyasu DFO Science Gulf Region
Paul Anderson PEI Mobile Groundfish Fishermen’s Association
Pierre Dupuis Province of NB
Renée Allain DFO Science Gulf Region
Rita Cormier DFO Science Gulf Region
Robert Haché Association des crabiers acadiens (ACA)
Roger Sark Maliseet Nation Conservation Council
Ron Pumphrey DFO Fisheries and Aquaculture Management Gulf Region
Stephanie Boudreau DFO Science Gulf Region
Sylvie Leger DFO Fisheries and Aquaculture Management Gulf Region
Tobie Surette DFO Science Gulf Region
Tommy Campbell Area 19 Snow Crab Fishermen’s Association
SOURCES OF INFORMATION
This Science Advisory Report is from the regional advisory meeting of January 23-24, 2019
Stock assessment of the southern Gulf of St. Lawrence snow crab stock to 2018 and catch
advice for the 2019 fishery. Additional publications from this meeting will be posted on the
Fisheries and Oceans Canada (DFO) Science Advisory Schedule as they become available.
DFO. 2009. A fishery decision-making framework incorporating the Precautionary Approach.
DFO. 2010. Reference points consistent with the precautionary approach for snow crab in the
southern Gulf of St. Lawrence. DFO Can. Sci. Advis. Sec. Sci. Advis. Rep. 2010/014.
DFO 2012a. Proceedings of the Gulf Region Science Peer Review Framework Meeting of
Assessment Methods for the Snow Crab Stock of the southern Gulf of St. Lawrence;
November 21 to 25, 2011. DFO Can. Sci. Advis. Sec. Proceed. Ser. 2012/023.
21Snow Crab
Gulf Region Southern Gulf of St. Lawrence
DFO. 2012b. Revised reference points for snow crab to account for the change in estimation
area of the southern Gulf of St. Lawrence biological unit. DFO Can. Sci. Advis. Sec. Sci.
Advis. Rep. 2012/002.
DFO. 2014a. Assessment of snow crab in the southern Gulf of St. Lawrence (Areas 12, 19, 12E
and 12F) and advice for the 2014 fishery. DFO Can. Sci. Advis. Sec. Sci. Advis. Rep.
2014/008.
DFO. 2014b. Assessment of candidate harvest decision rules for compliance to the
Precautionary Approach framework for the snow crab fishery in the southern Gulf of St.
Lawrence. DFO Can. Sci. Advis. Sec. Sci. Advis. Rep. 2014/007.
DFO. 2018. Snow crab in the Southern Gulf of St. Lawrence – crab fishing areas 12, 12E, 12F
and 19. Date modified: 2018-04-19. Date accessed : 2019-01-31.
Hébert M., Wade, E., Biron, M., DeGrâce, P.,L andry, J.-F., and Moriyasu, M. 2012. Review of
the 2011 snow crab (Chionoecetes opilio) fishery performance in the southern Gulf of St.
Lawrence (Areas 12, 19, 12E and 12F). DFO Can. Sci. Advis. Sec. Res. Doc. 2012/086. v +
45p.
Hébert, M., Surette, T., Landry, J.-F., and Moriyasu, M. 2018. Review of the 2017 snow crab
(Chionoecetes opilio) fishery in the southern Gulf of St. Lawrence (Areas 12, 19, 12E and
12F). DFO Can. Sci. Advis. Sec. Res. Doc. 2018/045. iv + 44 p.
Sainte-Marie, B., Gosselin, T., Sévigny, J.-M., and Urbani, N. 2008. The snow crab mating
system: opportunity for natural and unnatural selection in a changing environment. Bulletin
of Marine Science 83: 131-161.
22Snow Crab
Gulf Region Southern Gulf of St. Lawrence
THIS REPORT IS AVAILABLE FROM THE :
Centre for Science Advice (CSA)
Fisheries and Oceans Canada
Gulf Region
P.O. Box 5030
Moncton, NB
E1C 9B6
Telephone: 506-851-6253
E-Mail: csas-sccs@dfo-mpo.gc.ca
Internet address: www.dfo-mpo.gc.ca/csas-sccs/
ISSN 1919-5087
© Her Majesty the Queen in Right of Canada, 2019
Correct Citation for this Publication:
DFO. 2019. Assessment of snow crab (Chionoecetes opilio) in the southern Gulf of
St. Lawrence (Areas 12, 19, 12E and 12F) to 2018 and advice for the 2019 fishery. DFO
Can. Sci. Advis. Sec. Sci. Advis. Rep. 2019/010.
Aussi disponible en français :
MPO. 2019. Évaluation du crabe des neiges (Chionoecetes opilio) du sud du golfe du Saint-
Laurent (zones 12, 19, 12E et 12F) jusqu’en 2018 et avis pour la pêche de 2019. Secr. can.
de consult. Sci. du MPO. Avis sci. 2019/010.
23You can also read