Individual Differences in Aesthetic Preferences for Multi-Sensorial Stimulation
←
→
Page content transcription
If your browser does not render page correctly, please read the page content below
vision
Article
Individual Differences in Aesthetic Preferences for
Multi-Sensorial Stimulation
Jie Gao 1, *     and Alessandro Soranzo 2
 1    Institute of Education, University College London, London WC1H 0AL, UK
 2    Department of Psychology, Sheffield Hallam University, Sheffield S10 2BP, UK; A.Soranzo@shu.ac.uk
 *    Correspondence: jie.gao@ucl.ac.uk

 Received: 30 October 2019; Accepted: 30 December 2019; Published: 6 January 2020

 Abstract: The aim of the current project was to investigate aesthetics in multi-sensorial stimulation
 and to explore individual differences in the process. We measured the aesthetics of interactive objects
 (IOs) which are three-dimensional objects with electronic components that exhibit an autonomous
 behaviour when handled, e.g., vibrating, playing a sound, or lighting-up. The Q-sorting procedure
 of Q-methodology was applied. Data were analysed by following the Qmulti protocol. The results
 suggested that overall participants preferred IOs that (i) vibrate, (ii) have rough surface texture,
 and (iii) are round. No particular preference emerged about the size of the IOs. When making an
 aesthetic judgment, participants paid more attention to the behaviour variable of the IOs than the
 size, contour or surface texture. In addition, three clusters of participants were identified, suggesting
 that individual differences existed in the aesthetics of IOs. Without proper consideration of potential
 individual differences, aesthetic scholars may face the risk of having significant effects masked by
 individual differences. Only by paying attention to this issue can more meaningful findings be
 generated to contribute to the field of aesthetics.

 Keywords: multi-sensorial stimulation; individual difference; aesthetic preference

1. Introduction
     Aesthetics play an important role in everyday life. We buy a mug because we admire its attractive
design; we choose a particular hotel room because we like the view or the decoration. Such aesthetic
experiences are rooted in our brain; yet, there is little scientific understanding of how we make these
aesthetic decisions.
     Research in experimental aesthetics faces different challenges, the two main ones being
that: (i) Aesthetics often arise from multi-sensorial stimulation; and (ii) aesthetic experience is
essentially subjective.

1.1. Aesthetics in Multi-Sensorial Stimulation
     In brand design, much attention is paid to a consumer’s whole experience rather than to a
single product feature [1,2]. The design builds upon the evidence that when multiple senses are
stimulated simultaneously, it leads to a richer and more immersive experience [3]. However, aesthetic
psychologists have been studying each sense in isolation and mainly focusing on the visual sense.
Just as Carbon and Janesch [4] pointed out, whilst vision is the sense that has been widely studied in
aesthetics, in many circumstances haptic and tactile features may overpower visual features in terms
of pleasure. They have, therefore, argued that any model which describes aesthetic responses must
consider more than one sense at a time (see also Muth et al. [5]). To explore how different senses
contribute to the overall aesthetic experience, Soranzo et al. [6] studied the aesthetic preference for
Interactive Objects (IOs). As shown in Figure 1, these are three-dimensional objects, which contain

Vision 2020, 4, 6; doi:10.3390/vision4010006                                     www.mdpi.com/journal/vision
Vision 2020, 4, 6 2 of 13
Vision 2020, 4, x FOR PEER REVIEW 2 of 14
electronic components that exhibit an autonomous behaviour when handled, e.g., vibrating, playing a
sound, or lighting-up.
a sound, or lighting-up. (It will be interesting,
(It will in the
be interesting, infuture, to manipulate
the future, additional
to manipulate dimensions,
additional such
dimensions,
as the as
such IO’s
thecolour
IO’s or their or
colour odour.)
their IOs are an
odour.) IOsideal
are device
an idealto device
investigate aesthetics as
to investigate they stimulate
aesthetics as they
more than one sense at a time. By employing the IOs which differ in size, surface
stimulate more than one sense at a time. By employing the IOs which differ in size, surface texture, contour and
texture,
behaviour (as illustrated in Table 1), the current project aimed to investigate individuals’
contour and behaviour (as illustrated in Table 1), the current project aimed to investigate individuals’aesthetics in
multi-sensorial stimulation. stimulation.
aesthetics in multi-sensorial
Figure1.1.Picture
Figure Pictureof
ofinteractive
interactiveobjects
objects(IOs)
(IOs)and
andthe
themotion
motionsensor.
sensor.
Table1.1.Variables
Table Variableswith
withcorresponding
correspondinglevels.
levels.
FormForm
Behaviour
Behaviour
Size Size Surface TextureContour
Surface Texture Contour
Small (7.5 cm) Small (7.5 cm) Smooth
Smooth (plastic) (plastic)
Round (sphere)(sphere)
Round Emit aEmit
light
a light
Large (15 cm) Large (15 cm) (fabric)
Rough Rough (fabric) Angular
Angular (cube) (cube) Play aPlay
sound
a sound
Vibrate
Vibrate
Quiescent
Quiescent
1.2.
1.2.Individual
IndividualDifferences
DifferencesininAesthetics
Aesthetics
The
TheLatin
Latinadage
adage“de “degustibus
gustibusnon nonest estdisputandum”
disputandum”(there (thereisisnonoaccounting
accountingfor fortaste)
taste)suggests
suggests
that
thatindividual
individualdifferences
differencesin inaesthetic
aestheticare areeither
eitherarbitrary
arbitraryor orotherwise
otherwiseinexplicable
inexplicable[7,8]. [7,8]. However,
However,
modern
modernbehavioural
behaviouralresearchresearchhas hasshown
shownthat thatmeaningful
meaningfulstatements
statementscan canbe bemade
madeabout aboutindividual
individual
differences
differencesinin aesthetics
aesthetics [9],[9],
which
whichactually generates
actually moremore
generates insights into the
insights study
into theofstudy
aesthetics. Appelt
of aesthetics.
etAppelt
al. [10]etunderlined that in situations
al. [10] underlined where no where
that in situations clear tendency
no clear emerges
tendencyfrom the overall
emerges from the sample, it
overall
issample,
not unlikely that individual differences have cancelled out the expected effect
it is not unlikely that individual differences have cancelled out the expected effect and that and that the effect
isthe
evident,
effect isbut only for
evident, buta only
subset forofa participants. This is why
subset of participants. Thispsychologists may wantmay
is why psychologists to explore
want to
individual differences
explore individual even wheneven
differences this when
is not their
this isprimary goal.
not their By investigating
primary individual differences
goal. By investigating individual
indifferences
aesthetics,in scholars found
aesthetics, stable and
scholars found statistically
stable androbust individual
statistically robustpreferences
individual which were masked
preferences which
by weak
were population
masked by weak preference
population [11,12].
preference [11,12].
While
Whilemany many studies
studieshave found
have a consistent
found aesthetic
a consistent preference
aesthetic for stimuli
preference forwith specific
stimuli properties
with specific
(e.g., simplicity
properties (e.g.,insimplicity
vision [13]; smoothness
in vision in touch [14]),
[13]; smoothness scholars
in touch are
[14]), reluctant
scholars areto use these
reluctant to findings
use these
to claim the
findings touniversal
claim thenature of these
universal aesthetic
nature appeals.
of these This isappeals.
aesthetic because individual
This is because differences have
individual
emerged in practically all studies. As long as a century ago, Thorndike
differences have emerged in practically all studies. As long as a century ago, Thorndike [15] pointed [15] pointed out that the
diversity
out that theamong people’s
diversity among preference
people’s is vast and isthat
preference and that any
vast“although one person
“although any onemay feel very
person may decided
feel very
preferences, these are never
decided preferences, shared
these are neverbyshared
enoughbyofenough
his fellows tofellows
of his make anything like universal
to make anything agreement”
like universal (p. 150).
agreement”
Aesthetic
(p. 150). response
Aestheticisresponse
an intrinsically subjective and
is an intrinsically whimsical
subjective andexperience.
whimsical There are probably
experience. There no are
other scientific
probably no field
otherwhere individual
scientific field differences are more relevant.
where individual differences Modern
are morebehavioural
relevant.research
Modernon
empirical
behavioural aesthetics
research has
onshown
empiricalthat aesthetics
scientifically hasmeaningful
shown thatstatements
scientifically of individual
meaningfuldifference
statements can
of
be made. For
individual example,can
difference McManus
be made. et al.
For[12] found that
example, people et
McManus canal.be[12]
categorised
found that intopeople
two clusters
can be
based on theirinto
categorised preferences
two clusters for rectangles:
based on One theircluster preferred
preferences forrectangles
rectangles: closer
Onetocluster
a square shape,
preferred
and the other
rectangles cluster
closer to apreferred
square shape,elongated and rectangles; Spehar,preferred
the other cluster Walker and Taylor [16]
elongated identified
rectangles; two
Spehar,
clusters
Walker of and participants
Taylor [16]based on their
identified two appreciation of fractal patterns:
clusters of participants based on Onetheir
cluster liked images
appreciation with
of fractal
extreme
patterns: values of the spectrum
One cluster liked images slope,with
andextreme
the othervalues
clusterofpreferred intermediate
the spectrum slope, and slope thevalues. These
other cluster
preferred intermediate slope values. These individual differences are worth further exploring. It
could be argued that an aesthetic appeal may only be shared within distinct clusters of individuals,
rather than universally.
1.3. The Qmulti Protocol
In order to incorporate the exploration of individual difference into the investigation of overall
aesthetic experiences, Gao and Soranzo [17] developed the Qmulti protocol which is based on Q-
methodology (see References [18,19] for more details). The key aspects of the Qmulti protocol are
Vision 2020, 4, 6 3 of 13
presented as the following, namely, the Q-sorting procedure and corresponding Q-factor analysis;
the distinction between preference and dominance; and the dedicated R script of Qmulti protocol.
individual differences are worth further exploring. It could be argued that an aesthetic appeal may
1.3.1.
only be The Q-Sorting
shared withinProcedure and Corresponding
distinct clusters Q-Factor
of individuals, Analysis
rather than universally.
The Q-sorting procedure proposed by Stephenson [18] requires participants to rank-order
1.3. The Qmulti Protocol
stimuli (e.g., statements, pictures, objects, etc.) into one single quasi-normal (i.e., bell-shaped)
In order
response gridtowhich
incorporate the exploration
represents a continuum of individual difference
of preference, into the investigation
or agreement, or importance, of etc.
overall
An
aesthetic experiences, Gao and Soranzo [17] developed the Qmulti protocol which is
example of the Q-sorting grid is presented in Figure 2. The shape of the grid depends on the research based on
Q-methodology
questions. Watts(see
and References
Stenner [19][18,19] for more details).
have provided effectiveThe key aspects
instructions of thetoQmulti
on how protocol
build the are
response
presented as the following, namely, the Q-sorting procedure and corresponding Q-factor
grid. While a quasi-normal distribution shape is commonly used in Q-sorting, researchers should analysis; the
distinction
design between
the grid based preference and dominance;
on their knowledge of theand the dedicated
research R script
topic under of Qmulti[19].
investigation protocol.
Q-factor analysis [18] is used to analyse the Q-sorting data. In contrast to conventional factor
1.3.1. The Q-Sorting Procedure and Corresponding Q-Factor Analysis
analysis, Q-factor analysis groups participants together instead of items. It enables researchers to
identify
The consensus and disagreement
Q-sorting procedure proposed by among participants.
Stephenson Each participants
[18] requires Q-factor represents the stimuli
to rank-order shared
aesthetic
(e.g., judgment
statements, amongobjects,
pictures, the participants
etc.) intowho
one are significantly
single quasi-normalloaded
(i.e.,on the Q-factor.
bell-shaped) In this way,
response grid
individual
which differences
represents can be explored
a continuum and informed
of preference, by the data.
or agreement, or importance, etc. An example of the
Aftergrid
Q-sorting Q-sorting, participants
is presented are2.asked
in Figure to clarify
The shape of thethe reasons
grid dependsfor on
their
theaesthetic
research judgments, such
questions. Watts
as
andwhy they prefer
Stenner one provided
[19] have stimuli over the other;
effective which stimuli
instructions on howfeature(s)
to builddraws their attention,
the response etc. Thea
grid. While
qualitative data
quasi-normal complements
distribution shapetheisQ-sorting
commonly data
usedto in
give an in-depth
Q-sorting, and comprehensive
researchers should design account of
the grid
how
baseddifferent clusters of of
on their knowledge participants
the research make
topicaesthetic judgments [19].
under investigation in a multi-sensorial stimulation
setting.
Least preferred Most preferred
-4 -3 -2 -1 0 +1 +2 +3 +4
Figure
Figure 2.
2. A
A q-sorting
q-sorting grid
grid for
for an
an experiment
experiment with
with 24
24 stimuli
stimuli (or
(or items).
items).
1.3.2.Q-factor
The Distinction
analysisbetween Preference
[18] is used and the
to analyse Dominance
Q-sorting data. In contrast to conventional factor
analysis, Q-factor analysis groups participants together
As mentioned earlier, people pay attention to a variety instead of items. It
of information enables
when researchers
making to
aesthetics
identify consensus
decisions. and disagreement
For example, when judgingamong
the participants.
aesthetics of Each Q-factorpolygon,
a coloured represents the shared
people aesthetic
may consider
judgment among the participants who are significantly loaded on the Q-factor. In this way,
variables, such as the shape or the colour or the combination. People may differ in their preferences individual
differences
within can be
a certain explored
variable, butand informed
agree by the data. of the variable. For example, individual A may
on the importance
preferAfter
red Q-sorting, participants
polygons whilst are asked
individual B mayto prefer
clarifyblue
the reasons
polygons;for but
theirboth
aesthetic
A andjudgments,
B may regard suchthe
as
why they prefer one stimuli over the other; which stimuli feature(s) draws their attention,
colour as the most important variable on which they base their aesthetic judgment. We refer to the etc. The
qualitative
importancedata of a complements
variable as itsthe Q-sorting The
dominance. data analysis
to give anofin-depth
dominance andhas
comprehensive
a similar meaningaccountinofa
how different
regression clusters
analysis ofoffinding
participants make aesthetic
out whether judgments
a variable in a multi-sensorial
can predict an outcome, but stimulation
it utilises setting.
the Q-
sorting data directly and provides a more straightforward means of addressing this issue [16].
1.3.2. The Distinction between Preference and Dominance
Mathematically, the dominance of a variable is a measure of the spread of its levels across the Q-
As grid:
sorting mentioned earlier,
The larger thepeople
spreadpay
(i.e.,attention
extreme to a varietyinofthe
positions information
grid, such when making
as very much aesthetics
liked and
decisions.
very much For example,
disliked), when judging
the higher the weight.the aesthetics of a coloured polygon, people may consider
variables, such as the shape or the colour or the combination. People may differ in their preferences
within a certain variable, but agree on the importance of the variable. For example, individual A may
prefer red polygons whilst individual B may prefer blue polygons; but both A and B may regard
the colour as the most important variable on which they base their aesthetic judgment. We refer to
the importance of a variable as its dominance. The analysis of dominance has a similar meaning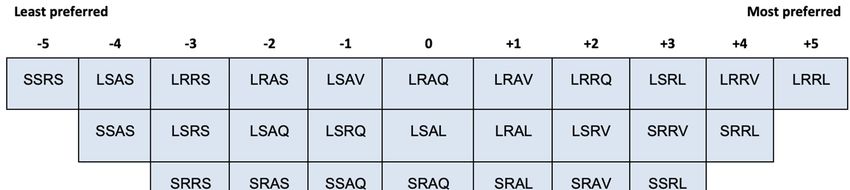
Vision 2020, 4, 6 4 of 13
in a regression analysis of finding out whether a variable can predict an outcome, but it utilises the
Q-sorting data directly and provides a more straightforward means of addressing this issue [16].
Mathematically, the dominance of a variable is a measure of the spread of its levels across the Q-sorting
grid: The larger the spread (i.e., extreme positions in the grid, such as very much liked and very much
disliked), the higher the weight.
1.3.3. The Dedicated R Script of Qmulti Protocol
A ready to use R script [20], the QmultiProtocol.R, has been developed to analyse the data
collected by the Q-sorting procedure. The QmultiProtocol.R makes use of the following packages:
‘qmethod’ [21]; ‘ordinal’ [22]; and ‘data.table’ [23]. The default version of the QmultiProtocol.R adopts
the frequentist approach and runs the ordered-probit model to analyse the Q-sorting data. It uses the
ordered-probit model to analyse the preferences whilst the dominance is tested via the analysis of
variance of the weight of each variable, calculated by measuring the spread across the grid of the levels
of each variable (see Reference [17] for more details).
1.4. Current Project
The aim of the current project was to investigate aesthetics in multi-sensorial stimulation and
to explore individual differences in the process. To achieve this aim, we measured the aesthetics of
IOs using the Q-sorting procedure. Data were analysed by applying the QmultiProtocol.R [17]. By
following the Qmulti protocol, we were able to address the following research questions:
• Which are the overall preferred characteristics of each variable of the IOs?
• Which are the important variables that influence people’s preference of the IOs?
• Do people systematically differ in their aesthetic judgement about the IOs?
• Do different clusters of people prefer different characteristics of a variable of the IOs?
• Are different clusters of people driven by different variables of the IOs?
2. Method
2.1. Participants
Eighteen participants (14 females and 4 males, aged 18–24 years old) took part in the Q-sorting
experiment of IOs.
2.2. Materials
Four variables of the IOs were manipulated, namely, Size, Surface texture, Contour and Behaviour
(see Figure 1). The variables differ in the number of levels, as indicate in Table 1. As a result, there are
32 IOs in total.
2.3. Procedure
Participants were first asked to play with the 32 IOs to familiarise themselves with the objects,
especially the behaviour that each IO exerts when picked up. Then participants were asked to
rank-order all the IOs into one single bell-shaped (i.e., quasi-normal) grid ranging from ‘the least
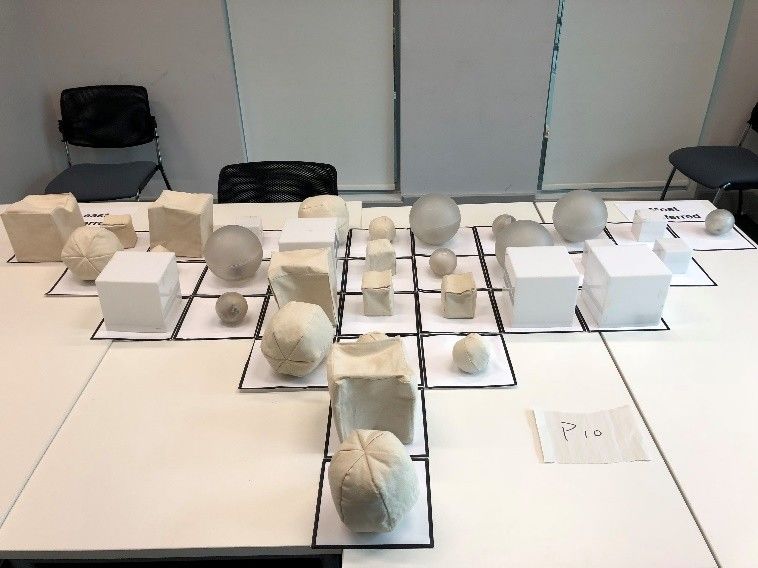
preferred’ (−5) to ‘the most preferred’ (+5) (see Figures 3 and 4). IOs that were sorted into one common
column were considered as equivalent. The grid was designed to (a) accommodate the 32 IOs and
(b) enable participants to differentiate their preferences of the IOs. After Q-sorting, participants were
asked to elaborate on their aesthetic judgement.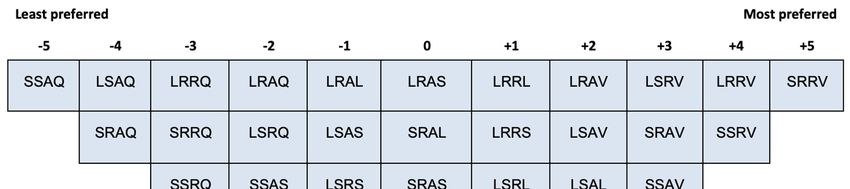
Vision 2020, 4, 6                                                                                                     5 of 13
 Vision 2020, 4, x FOR PEER REVIEW                                                                                    5 of 14

                                 Figure 3. The response grid of Q-sorting procedure.

3. Results
    The Q-sorting data were inserted into a spreadsheet to be read by the QmultiProtocol.R in R.
Detailed steps of the analysis performed by QmultiProtocol.R can be found in Reference [17]. An
example of data collected from a participant (P10) is shown in Figure 4. The results of the analysis are
                             Figure3.3.The
presented in the following Figure
                            sections.   Theresponse
                                            responsegrid
                                                     gridofofQ-sorting
                                                              Q-sortingprocedure.
                                                                        procedure.

 3. Results
     The Q-sorting data were inserted into a spreadsheet to be read by the QmultiProtocol.R in R.
 Detailed steps of the analysis performed by QmultiProtocol.R can be found in Reference [17]. An
 example of data collected from a participant (P10) is shown in Figure 4. The results of the analysis are
 presented in the following sections.

                                         Figure 4.
                                         Figure 4. Example
                                                   Example of
                                                           of Q-sorting
                                                              Q-sorting result.
                                                                        result.

3.1. Ethics
2.4. Research Question One: Overall Preference
      To find
     All        out the overall
           participants             preferred
                            gave their         characteristics
                                        informed    consent for of   each variable
                                                                   inclusion    beforeof  the IOs, the in
                                                                                        participation   QmultiProtocol.R
                                                                                                           the experiment.
runsstudy
The   an ordered-probit
               was conducted     model   on the ranks
                                    in accordance     with that
                                                             theeach    of the IOs
                                                                  Declaration         received by
                                                                                   of Helsinki.      all theapproval
                                                                                                  Ethical     participants.
                                                                                                                        was
Specifically,
obtained    fromthetheresult  of Wald
                          Ethics        chi-square
                                 Committee           test suggested
                                              of Sheffield    Hallam that     in general,
                                                                        University    (Ref:participants
                                                                                            ER6377599).preferred rough
to smooth surface texture (Χ2 = 6.44,      Figure
                                               df =4.1,Example   of Q-sorting
                                                        p = 0.004),  round toresult.
                                                                                  angular shape (Χ2 = 10.38, df = 1, p =
3. Results
0.001) and lighting/vibrating to sounding/quiescent objects (Χ = 206.74, df = 3, p < 0.001). However,
                                                                                2
 3.1. Research Question One: Overall Preference
thereThe
       wasQ-sorting
              no significant
                           data difference   in preference
                                 were inserted                 between big
                                                  into a spreadsheet       to beand  small
                                                                                   read  by objects (Χ2 = 2.05, df = 1,inpR.
                                                                                             the QmultiProtocol.R           =
0.15). To
DetailedFigure
            find
            steps5out
                    illustrates
                     of the      the preferred
                         theoverall
                             analysis overall preference
                                       performed             of each
                                                characteristics     of variable.
                                                                       each variable
                                                      by QmultiProtocol.R         can beoffound
                                                                                           the IOs,
                                                                                                  inthe  QmultiProtocol.R
                                                                                                     Reference    [17]. An
 runs anofordered-probit
example        data collected frommodela participant
                                          on the ranks      that
                                                         (P10) is each
                                                                  shown  ofinthe  IOs received
                                                                               Figure            by all
                                                                                       4. The results   of the analysis
                                                                                                               participants.
                                                                                                                         are
 Specifically,    the  result  of Wald
presented in the following sections.     chi-square    test suggested    that  in general,  participants    preferred  rough
 to smooth surface texture (Χ2 = 6.44, df = 1, p = 0.004), round to angular shape (Χ2 = 10.38, df = 1, p =
3.1. Research
 0.001)         Question One: Overall
          and lighting/vibrating            Preference
                                       to sounding/quiescent        objects (Χ2 = 206.74, df = 3, p < 0.001). However,
 there
     Towasfindnooutsignificant
                      the overalldifference
                                   preferredin   preference between
                                               characteristics    of each big    and small
                                                                            variable   of theobjects
                                                                                              IOs, the(ΧQmultiProtocol.R
                                                                                                         2 = 2.05, df = 1, p =

 0.15).anFigure
runs               5 illustratesmodel
           ordered-probit         the overall
                                         on thepreference
                                                  ranks that  of each
                                                                 each variable.
                                                                        of the IOs received by all the participants.
Specifically, the result of Wald chi-square test suggested that in general, participants preferred rough
to smooth surface texture (X2 = 6.44, df = 1, p = 0.004), round to angular shape (X2 = 10.38, df = 1,
Vision 2020, 4, 6                                                                                                      6 of 13

 Vision 2020, 4, x FOR PEER REVIEW                                                                                     6 of 14
p = 0.001) and lighting/vibrating to sounding/quiescent objects (X2 = 206.74, df = 3, p < 0.001). However,
there was no significant difference in preference between big and small objects (X2 = 2.05, df = 1,
  = 0.15).
p Vision 2020, 4, x FOR
            Figure      PEER REVIEW
                      5 illustrates the overall preference of each variable.                         6 of 14

                                    Figure5.5.The
                                   Figure     Theoverall
                                                  overallpreference
                                                         preferenceof
                                                                    ofeach
                                                                       eachvariable.
                                                                            variable.

 3.2. Research
3.2.  Research Question
               QuestionTwo:
                        Two:Overall
                            OverallDominance
                                    Dominance
                                     Figure 5. The overall preference of each variable.
       Tofind
      To   findout
                 outwhich
                     whicharearethe
                                  theimportant
                                      importantvariables
                                                    variablesthatthatinfluence
                                                                       influencepeople’s
                                                                                    people’spreference
                                                                                                 preferenceof  ofthe
                                                                                                                  theIOs,
                                                                                                                      IOs,the
                                                                                                                            the
  3.2. Research
 QmultiProtocol.R Question
QmultiProtocol.R conducts   Two:
                       conducts    Overall
                                   an      Dominance
                                      analysis  of  variance     on  the  weights    of variables    that
                                      analysis of variance on the weights of variables that are calculated are  calculated   by
 thethe
by    analysis
        To  findprocedure
        analysis  out which(see
                    procedure   (see
                              are   Reference
                                   theReference[17]
                                       important  [17] forformore
                                                     variablesmore details).
                                                                  thatdetails).The
                                                                         influenceTheresult
                                                                                       resultsuggested
                                                                                     people’s   suggested
                                                                                                  preferencethatofthere
                                                                                                              that there
                                                                                                                   the   was
                                                                                                                          was
                                                                                                                        IOs,   a
                                                                                                                             the
asignificant
   significant difference
                difference between
                             between  the
                                        thevariables
                                            variables   in  terms
                                                           in termsof  how
                                                                       of how important
                                                                                 important  they   were
                                                                                                they
  QmultiProtocol.R conducts an analysis of variance on the weights of variables that are calculated by   considered
                                                                                                      were    considered by the
                                                                                                                            by
 participants
the    analysiswhen
  theparticipants       making
                     when
                  procedure   (seean
                            making     aesthetic
                                      an aesthetic
                                     Reference     judgment
                                                [17]  judgment
                                                        for more  (F(F(3,
                                                                        (3,68)
                                                                     details).   = 28.34,
                                                                            68) =The28.34, pp <
                                                                                      result
Vision 2020, 4, 6                                                                                                               7 of 13

3.3. Research Question Three: Individual Differences
      Q factor
     Vision       analysis
            2020, 4, x FOR PEERwas  conducted with the Q-sorting data (see Reference [24] for a detailed
                                  REVIEW                                                                                  7 ofQ14factor
analysis procedure). We compared different factor solutions (i.e., two Q-factors, three Q-factors and four
Q-factors)Qbased
               factor on analysis  was conducted
                            the variance    that thewith     theaccount
                                                       factors    Q-sorting    data
                                                                            for,  the(see   Referenceand
                                                                                       Eigenvalue       [24]the
                                                                                                              formeaningfulness
                                                                                                                  a detailed Q       of
     factor  analysis     procedure).   We  compared     different  factor  solutions   (i.e.,
the factor scores. As a result, a three-factor solution was chosen, which accounted for 70% of two Q-factors,   three Q-factors
                                                                                                                         the variance
     and four Q-factors) based on the variance that the factors account for, the Eigenvalue and the
in total. Eight participants were significantly loaded on Q-Factor1 (Eigenvalue = 5.4, variance= 30%),
     meaningfulness of the factor scores. As a result, a three-factor solution was chosen, which accounted
six on Q-Factor 2 (Eigenvalue = 4.1, variance = 23%) and three on Q-Factor 3 (Eigenvalue = 3.1, variance
     for 70% of the variance in total. Eight participants were significantly loaded on Q-Factor1 (Eigenvalue
= 17%).
     = 5.4,This   suggested
             variance=      30%),that
                                  six onthere  were2three
                                           Q-Factor           clusters= of
                                                        (Eigenvalue       4.1,participants
                                                                               variance = 23%)  whoandmade
                                                                                                         threea on
                                                                                                                 different
                                                                                                                     Q-Factoraesthetic
                                                                                                                                3
judgment     of  the    IOs.
     (Eigenvalue = 3.1, variance = 17%). This suggested that there were three clusters of participants who
      Figures
     made        7–9 illustrate
             a different           thejudgment
                             aesthetic  shared aesthetic     judgments among the participants who were significantly
                                                    of the IOs.
loaded on     each Q-factor.
            Figures                 The the
                        7–9 illustrate    firstshared
                                                letter in   each cell
                                                         aesthetic       represents
                                                                     judgments          the IO’s
                                                                                     among      the size  (L = Large,
                                                                                                    participants             = Small);
                                                                                                                     who Swere
the second is the surface texture (R = Rough, S = Smooth); the third is the contour (A = Angular,
     significantly     loaded   on  each  Q-factor.  The  first letter in each   cell represents   the IO’s  size  (L = Large,  S
     = Small);    the    second  is  the surface  texture   (R  =  Rough,    S =  Smooth);
R = Round); and the forth is the behaviour (Q = Quiescent, V = Vibrate, L = Light, S = Sound). the third  is the  contour   (A  = The
     Angular,    R   = Round);   and   the forth is the  behaviour   (Q  = Quiescent,    V  =  Vibrate,
following paragraphs elaborate on the patterns of the shared aesthetic judgment, which help readers     L  = Light, S = Sound).
     The following paragraphs elaborate on the patterns of the shared aesthetic judgment, which help
to read the figures.
      readers to read the figures.

                         Figure
     Vision 2020, 4, x FOR PEER 7. The
                                REVIEW
                            Figure 7. Theshared
                                          sharedQ-sorting resultofofparticipants
                                                Q-sorting result     participants  loaded
                                                                                 loaded    on Q-factor
                                                                                        on Q-factor 1.       1.       8 of 14

            As can be seen, participants loaded on Q-factor 1 ranked the small smooth angular object which
      lights up as the most preferred one (+5) and the small rough, angular object which makes a sound
      like the least preferred one (−5). By examining the pattern of the ranks of IOs, we can see that
      participants of Q-factor 1 tended to prefer smooth surface to rough surface, and they dislike the IOs
      that make a sound. To be more specific, the three most preferred IOs are all smooth lighting up
      objects, whereas, the three least preferred objects are all rough sounding objects. No clear pattern is
      identified for the size or the contour variable. The qualitative data of post-sorting interview provide
      further evidence to support this shared aesthetic judgment. For example, participant P10 reported, “I
      prefer the smooth than the fabric texture because it feels clean, smooth and easy to clean stuff like that; I don’t
      really have a preference of the circles or the squares, but I like lighting up”.

                        Figure8.8.The
                      Figure       Theshared  Q-sortingresult
                                       shared Q-sorting resultofof participants
                                                                 participants    loaded
                                                                              loaded     on Q-factor
                                                                                     on Q-factor 2.  2.

     As On
         can the other participants
              be seen,  hand, participants
                                      loadedloaded    on Q-factor
                                               on Q-factor          2 preferred
                                                             1 ranked            rough
                                                                         the small      round
                                                                                   smooth       IOs, just
                                                                                             angular       like which
                                                                                                       object
    participant
lights up as theP09 pointed
                  most      out “[the
                       preferred   onefabric
                                        (+5)balls]
                                             andfeel
                                                   thecomfortable to hold”.
                                                       small rough,         Meanwhile,
                                                                        angular object they
                                                                                       whichseemed
                                                                                               makes to aprefer
                                                                                                          sound like
    vibrating
the least     and lighting-up
          preferred  one (−5).IOs
                               By to  sounding the
                                   examining      IOs.pattern
                                                      For example,
                                                              of theparticipant  P03 we
                                                                       ranks of IOs, saidcan
                                                                                          in the
                                                                                              seepost-sorting
                                                                                                  that participants
     interview “I found the sound ones are quite harsh”. Similar to Q-factor 1, no clear pattern for the size
     variable is identified.
Vision 2020, 4, 6 8 of 13
of Q-factor 1 tended to prefer smooth surface to rough surface, and they dislike the IOs that make a
sound. To be more Figurespecific, theshared
8. The threeQ-sorting
most preferred IOs are all
result of participants smooth
loaded lighting
on Q-factor 2. up objects, whereas,
the three least preferred objects are all rough sounding objects. No clear pattern is identified for the
Oncontour
size or the the other hand, participants
variable. loaded
The qualitative data onofQ-factor 2 preferred
post-sorting rough
interview round further
provide IOs, justevidence
like to
participant P09 pointed out “[the fabric balls] feel comfortable to hold”. Meanwhile, they seemed to prefer
support this shared aesthetic judgment. For example, participant P10 reported, “I prefer the smooth than
vibrating and lighting-up IOs to sounding IOs. For example, participant P03 said in the post-sorting
the fabric texture because it feels clean, smooth and easy to clean stuff like that; I don’t really have a preference of
interview “I found the sound ones are quite harsh”. Similar to Q-factor 1, no clear pattern for the size
the circles or is
variable theidentified.
squares, but I like lighting up”.
Figure
Figure 9. 9.The
Theshared
shared Q-sorting
Q-sorting result
resultofofparticipants
participantsloaded on Q-factor
loaded 3. 3.
on Q-factor
On As thefor participants
other loaded on Q-factor
hand, participants loaded 3, they ranked quiescent
on Q-factor 2 preferredobjects as theround
rough least preferred
IOs, just like
because “they are just boring” (P11). They liked vibrating IOs the most, just as participant
participant P09 pointed out “[the fabric balls] feel comfortable to hold”. Meanwhile, they seemed to prefer P12 indicated
“I prefer
vibrating vibration
and to everything
lighting-up IOs toelse. It’s like IOs.
sounding massage”. While participants
For example, participantloaded
P03on Q-factor
said in the1post-sorting
and 2
ranked sounding IOs as the least preferred, participants loaded on Q-factor 3 preferred sounding IOs
interview “I found the sound ones are quite harsh”. Similar to Q-factor 1, no clear pattern for the size
to quiescent ones. Participant P17 explained that “I never heard a ball making a sound, it’s quite cool”.
variable is identified.
To further explore which variable(s) each cluster of participants paid more attention to, the
As for participants
dominance loaded on
weights of variables wereQ-factor
calculated3, they ranked
separately for quiescent
each clusterobjects as the (see
of participants leastTable
preferred
because
2). By“they are justthese
inspecting boring” (P11).weThey
weights, likedthat:
can infer vibrating IOs the
Participants whomost,
werejust as participant
significantly loaded P12
onindicated
Q-
“I prefer
factorvibration
1 mainlyto everything
based else. It’s
their aesthetic like massage”.
judgement While participants
on the behaviour loaded
and the surface on participants
texture; Q-factor 1 and 2
ranked sounding
loaded IOs as
on Q-factor the least
2 mainly preferred,
considered theparticipants
behaviour, butloaded on Q-factor
still paid 3 preferred
certain attention to thesounding
surface IOs
texture and
to quiescent contour;
ones. and participants
Participant P17 explainedloadedthat
on Q-factor 3 mainly
“I never heard focused
a ball making ona the behaviour
sound, with
it’s quite cool”.
To further explore which variable(s) each cluster of participants paid more attention to, the
dominance weights of variables were calculated separately for each cluster of participants (see Table 2).
By inspecting these weights, we can infer that: Participants who were significantly loaded on Q-factor
1 mainly based their aesthetic judgement on the behaviour and the surface texture; participants loaded
on Q-factor 2 mainly considered the behaviour, but still paid certain attention to the surface texture and
contour; and participants loaded on Q-factor 3 mainly focused on the behaviour with little attention
paid to the other variables. Figure 10 illustrates the dominance of variables for each factor.
Table 2. Dominance weights of variables for each Q-factor.
Q-Factor 1 Q-Factor 2 Q-Factor 3
Size 0.093 0.038 0.049
Surface texture 0.410 0.248 0.024
Contour 0.037 0.210 0.146
Behaviour 0.459 0.504 0.780Q-Factor 1 Q-Factor 2 Q-Factor 3
Size 0.093 0.038 0.049
Surface texture 0.410 0.248 0.024
Contour 0.037 0.210 0.146
Vision 2020, 4, 6 9 of 13
Behaviour 0.459 0.504 0.780
Figure 10. The dominance of variables for each Q-factor.
3.4. Research Question Four:Figure
Interaction between
10. The Individual
dominance Differences
of variables andQ-factor.
for each Preferences
The aim of this analysis is to find out whether participants of different clusters differ in their
3.4. Research Question Four: Interaction between Individual Differences and Preferences
preference for IOs. Table 3 illustrates the results of Wald chi-square tests for the interaction between
The differences
individual aim of thisand analysis is to find
preferences. Asout
can whether participants
be seen, there was no of differentinteraction
significant clusters differ
among in the
their
preference
four variablesfor of IOs. Table
the IOs when 3 illustrates the were
all Q-factors results of Wald chi-square
considered together. Intests forofthe
terms interaction
selected between
comparison,
individual differences and preferences. As can be seen, there was no significant
Figure 11 shows that Q-factor 1 and Q-factor 2 mainly differed in their preferences of surface texture, interaction among
theis,four
that variablesloaded
participants of the on IOs when all
Q-factor Q-factorssmooth
1 preferred were considered together.
texture, whereas, In terms loaded
participants of selected
on
Q-factor 2 preferred rough texture. Meanwhile, Q-factor 3 mainly differed from Q-factor 1 and 2 inof
comparison, Figure 11 shows that Q-factor 1 and Q-factor 2 mainly differed in their preferences
surface
respect
Vision of 4,texture,
2020, the thatREVIEW
behaviour
x FOR PEER is, participants
variable, as shownloaded on Q-factor
in Figure 11. 1 preferred smooth texture, whereas,10 of 14
participants loaded on Q-factor 2 preferred rough texture. Meanwhile, Q-factor 3 mainly differed
from Q-factor 1 and 2 in respect of the behaviour variable, as shown in Figure 11.
Table 3. Result of Wald chi-square test for the Preference per Q-factor interactions.
Variable df Chi-Square p
Factor * Size 2 0.13 0.935
Factor * Texture 2 1.98 0.372
Factor * Contour 2 3.52 0.172
Factor * Behaviour 6 5.32 0.503
Note: * indicates interaction.
Figure 11. The preference of variables for each Q-factor.
Figure 11. The preference of variables for each Q-factor.
3.5. Research Question Five: Interaction between Individual Differences and Dominance
The aim of this analysis is to find out whether participants of different clusters differ in the
variable(s) they mostly consider when ranking the IOs. An analysis of variance was conducted on the
dominance weights of each Q-factor.
The result of analysis of variance suggested that participants loaded on Factor 3 were
significantly different from the participants loaded on Q-factor 1 and 2 in terms of the variables that
they paid attention to when making an aesthetic judgment (F (6, 56) = 8.02, p < 0.001). Figure 12
illustrates the interaction between individual differences and dominance weights of the variables ofVision 2020, 4, 6 10 of 13
Table 3. Result of Wald chi-square test for the Preference per Q-factor interactions.
Variable df Chi-Square p
Factor * Size 2 0.13 0.935
Factor * Texture 2 1.98 0.372
Factor * Contour 2 3.52 0.172
Factor * Behaviour Figure 11. 6The preference of variables5.32
for each Q-factor. 0.503
Note: * indicates interaction.
3.5. Research Question Five: Interaction between Individual Differences and Dominance
The aim
3.5. Research of this
Question analysis
Five: is to between
Interaction find out whetherDifferences
Individual participants
andof different clusters differ in the
Dominance
variable(s) they mostly consider when ranking the IOs. An analysis of variance was conducted on the
The aim of
dominance this analysis
weights is to find out whether participants of different clusters differ in the
of each Q-factor.
variable(s)
The result of analysis when
they mostly consider rankingsuggested
of variance the IOs. Anthat
analysis of variance
participants was conducted
loaded on Factoron 3 the
were
dominance weights
significantly of each
different fromQ-factor.
the participants loaded on Q-factor 1 and 2 in terms of the variables that
Thepaid
they result of analysis
attention of variance
to when makingsuggested that participants
an aesthetic judgment loaded on =Factor
(F (6, 56) 8.02, 3pwere significantly
< 0.001). Figure 12
different
illustrates the interaction between individual differences and dominance weights of thethey
from the participants loaded on Q-factor 1 and 2 in terms of the variables that paid of
variables
the IOs.to when making an aesthetic judgment (F (6, 56) = 8.02, p < 0.001). Figure 12 illustrates the
attention
interaction between individual differences and dominance weights of the variables of the IOs.
Figure 12. The interaction between individual differences and dominance.
4. Discussion
Figure 12. The interaction between individual differences and dominance.
In this project, we examined aesthetics in multi-sensorial stimulation and explored individual
differences in the process. By adopting the Q-sorting procedure, we investigated participants’ aesthetics
of Interactive Objects (IOs), which stimulate more than one sense at once. Data were analysed using
the QmultiProtocol.R [17] which distinguishes between preference (i.e., the preferred characteristic of a
stimulus) and dominance (i.e., the most important variable(s) in aesthetic judgment). By following
the Qmulti protocol [17], it was possible to examine (i) the overall preferred characteristics of the IOs,
(ii) the overall dominance, (iii) the individual differences; and the interactions between (iv) individual
differences and preference and (v) individual differences and dominance.
4.1. Overall Preferences
The analysis of overall preference revealed that participants preferred IOs that (i) vibrate, (ii) have
rough surface texture, and (iii) are round. No particular preference emerged about the size of the IOs.Vision 2020, 4, 6 11 of 13
4.1.1. Vibration
Among the variables studied in this project, “behaviour” was the dominant one (see detailed
discussion below). Among the different behaviours of the IOs, the vibration was preferred by most
of the participants. This result supports Carbon and Janesch’s [4] argument that haptic and tactile
features enhance overall aesthetic experience.
4.1.2. Roughness
In respect of the preference of surface texture, the findings of this study and previous research are
controversial. On the one side, Ekman, Hosman and Lindstrom [14], and Etzi, Spence, and Gallace [25]
found that smooth surfaces were preferred over rough ones; on the other side, Soranzo et al. [6]; Rowell
and Ungar [26], and Jehoel, Ungar, Mccallum, and Rowell [27] reported the opposite findings.
The degree of roughness might lead to a certain extent account for the inconsistent findings. In
addition, psychophysics studies (e.g., Reference [28]) suggest that there exists an interaction between
vibration and the perception of roughness. Therefore it can be argued that rough texture may be
preferred over smoothness in multi-sensorial stimulation. However, the present study also found
that one cluster of participants preferred smooth IOs whilst the other cluster preferred rough IOs.
It is, therefore, possible that the discrepancies emerged in previous studies may be partially due to
individual differences.
4.1.3. Roundness
The result that participants preferred round IOs over squared ones is in line with previous literature
(e.g., see the “smooth curvature effect”, [29]) which mainly focussed on 2D visual representations of
static objects. The present study extended the findings, suggesting that this preference is very powerful
and can be applied to 3D objects in multi-sensorial stimulation settings.
4.1.4. Size
Silvera, Josephs and Giesler [30] suggested that larger stimuli are usually preferred to smaller ones.
This effect was not replicated in the present study. However, it should be noted that Silvera et al. [30]
presented their stimuli pictorially rather than using physical objects. It is, therefore, possible that this
preference is confined to the visual sense. Nonetheless, the lack of effect should be taken cautiously,
considering the limited size range of our stimuli.
4.2. Overall Dominance
With regard to the dominance of the variables, we found that the most important variable
considered by overall participants was the behaviour. This suggests that participants paid more
attention to the behaviour than the size, surface texture or shape of the IOs. This is also supported
by the qualitative data collected from the post-sorting interview. The behaviours exerted by the IOs
were the most commonly mentioned reasons when participants were asked about the reasons, they
preferred an IO to another.
This finding leads to the issue of aesthetic primitives. Latto [31] defined an aesthetic primitive
as a primary or fundamental “stimulus or property of a stimulus that is intrinsically interesting . . . ”
(p. 68). Such aesthetic primitives, if they exist, may be hard-wired in the cognitive system, and may
have an evolutionary basis. Although several stimuli features have been suggested to be primitives
(e.g., golden ratio, symmetry, roundness, etc.); there is inconsistent evidence that they undoubtedly are
primitives. Soranzo et al. [6] found that participants across various age groups, genders and cultural
backgrounds preferred behaving objects over quiescent objects. Similar findings were found by the
current study. Thus, we suggest that “behaviour” could be an aesthetic primitive.Vision 2020, 4, 6 12 of 13
4.3. Individual Differences
In addition to overall preference and dominance, we considered individual differences and the
interaction between individual difference and preference and dominance, respectively.
Q-factor analysis suggested that participants could be clustered into three Q-factors. Participants
of Q-factor 1 preferred smooth Ios and disliked the Ios that make a sound. Participants of Q-factor 2
preferred rough round Ios and also disliked the sounding Ios. In contrast, participants of Q-factor 3
ranked the quiescent ones least preferred. By analysing the interactions between individual differences
and preference, we found that participants loaded on Factor 1 preferred smooth surface texture,
whereas, participants loaded on Factor 2 preferred rough surface texture. The analysis of the interaction
between individual differences and dominance revealed that different clusters of participants laid
emphasis on different variables when making an aesthetic judgement. Participants of Q-factor 1
and 2 pay attention to variables, such as surface texture and contour together with behaviour whilst
participants of Q-factor 3 were mainly driven by the behaviour of IOs. These findings have highlighted
the relevance of exploring and discussing individual differences in the field of aesthetics. Without
proper consideration of potential individual differences, aesthetic scholars may face the risk of having
significant effects masked by these individual differences. Only by paying attention to this issue can
more meaningful findings be generated to contribute to the field of aesthetics.
5. Conclusions
By employing the Q-multi protocol, this research examined the aesthetics preference and
dominance and the individual differences of multi-sensorial stimuli. The preferred characteristics
of the stimuli were vibration, roughness and roundness. The dominance variable was behaviour,
suggesting that “behaviour” could be an aesthetics primitive in Latto’s [31] terms. Findings have also
highlighted the relevance of exploring and discussing individual differences in aesthetics.
Author Contributions: Both authors contributed to the design of experiment, data collection, data analysis,
interpretation of results, writing-up and revision of the manuscript. All authors have read and agreed to the
published version of the manuscript.
Funding: This research received no external funding.
Conflicts of Interest: The authors declare no conflict of interest.
References
1. Backer, D. Did You Know Bmw’s Door Click Had a Composer? It’s Emar Vegt, an Aural Designer. Wired
Magazine. 13 April 2013. Available online: http://www.wired.co.uk/article/music-to-drive-to (accessed on
5 March 2019).
2. Parizet, E.; Guyader, E.; Nosulenko, V. Analysis of car door closing sound quality. Appl. Acoust. 2008, 69,
12–22. [CrossRef]
3. Schifferstein, H.N.J.; Spence, C. Product Experience; Elsevier: Berlin, Germany, 2008.
4. Carbon, C.C.; Jakesch, M. A model for haptic aesthetic processing and its implications for design. Proc. IEEE
2013, 101, 2123–2133. [CrossRef]
5. Muth, C.; Ebert, S.; Marković, S.; Carbon, C.C. “Aha” ptics: Enjoying an Aesthetic Aha During Haptic
Exploration. Perception 2019, 48, 3–25. [CrossRef] [PubMed]
6. Soranzo, A.; Petrelli, D.; Ciolfi, L.; Reidy, J. On the perceptual aesthetics of interactive objects. Q. J. Exp.
Psychol. 2018, 71, 2586–2602. [CrossRef] [PubMed]
7. Chandler, A.R. Recent experiments on visual aesthetics. Psychol. Bull. 1928, 25, 720–732. [CrossRef]
8. Woodworth, R.S. Experimental Psychology; H. Holt and Company: New York, NY, USA, 1938.
9. Palmer, S.E.; Griscom, W.S. Accounting for taste: Individual differences in preference for harmony. Psychon.
Bull. Rev. 2013, 20, 453–461. [CrossRef] [PubMed]
10. Appelt, K.C.; Milch, K.F.; Handgraaf, M.J.; Weber, E.U. The decision making individual differences inventory
and guidelines for the study of individual differences in judgment and decision-making research. Judgm.
Decis. Mak. 2011, 6, 252–262.Vision 2020, 4, 6 13 of 13
11. McManus, I.C. The aesthetics of simple figures. Br. J. Psychol. 1980, 71, 505–524. [CrossRef] [PubMed]
12. McManus, I.C.; Cook, R.; Hunt, A. Beyond the Golden Section and normative aesthetics: Why do individuals
differ so much in their aesthetic preferences for rectangles? Psychol. Aesthet. Creat. Arts 2010, 4, 113–126.
[CrossRef]
13. Birkhoff, G.D. Aesthetic Measure; Harvard University Press: Cambridge, MA, USA, 1933.
14. Ekman, G.; Hosman, J.; Lindstrom, B. Roughness, smoothness, and preference: A study of quantitative
relations in individual subjects. J. Exp. Psychol. 1965, 70, 18–26. [CrossRef]
15. Thorndike, E.L. Individual differences in judgments of the beauty of simple forms. Psychol. Rev. 1917, 24,
147–153. [CrossRef]
16. Spehar, B.; Walker, N.; Taylor, R.P. Taxonomy of Individual Variations in Aesthetic Responses to Fractal
Patterns. Front. Hum. Neurosci. 2016, 10, 350. [CrossRef] [PubMed]
17. Gao, J.; Soranzo, A. Applying Q-methodology to experimental aesthetics. Methods Psychol.. Submitted.
18. Stephenson, W. Technique of Factor Analysis. Nature 1935, 136, 297. [CrossRef]
19. Watts, S.; Stenner, P. Doing Q Methodological Research: Theory, Method and Interpretation; SAGE Publications:
London, UK, 2012.
20. Team, R.C. R: A Language and Environment for Statistical Computing; R Foundation for Statistical Computing:
Vienna, Austria, 2018.
21. Zabala, A. qmethod: A Package to Explore Human Perspectives Using Q Methodology. R J. 2014, 6, 163–173.
[CrossRef]
22. Christensen, R.H.B. Ordinal-Regression Models for Ordinal Data. R Package Version. 25 August 2018.
Available online: http://www.cran.r-project.org/package=ordinal/ (accessed on 5 March 2019).
23. Dowle, M.; Srinivasan, A.; Gorecki, J.; Chirico, M.; Stetsenko, P.; Short, T.; Steve Lianoglou, S.; Eduard
Antonyan, E.; Bonsch, M.; Parsonage, H.; et al. Package ‘Data. Table’. 2019. Available online: https:
//cran.r-project.org/web/packages/data.table/data.table.pdf (accessed on 1 August 2019).
24. Zabala, A.; Pascual, U. Bootstrapping Q-methodology to improve the understanding of human perspectives.
PLoS ONE 2016, 11, e0148087. [CrossRef]
25. Etzi, R.; Spence, C.; Gallace, A. Textures that we like to touch: An experimental study of aesthetic preferences
for tactile stimuli. Conscious. Cognit. 2014, 29, 178–188. [CrossRef]
26. Rowell, J.; Ungar, S. Feeling your way—A tactile map user survey. In Proceedings of the 21st International
Cartographic Conference, Durban, South Africa, 10–16 August 2003. [CrossRef]
27. Jehoel, S.; Ungar, S.; McCallum, D.; Rowell, J. An Evaluation of Substrates for Tactile Maps and Diagrams:
Scanning Speed and Users’ Preferences. J. Vis. Impair. Blind. 2005, 99, 85–95. [CrossRef]
28. Tiest, W.M.B. Tactual perception of material properties. Vis. Res. 2010, 50, 2775–2782. [CrossRef]
29. Bertamini, M.; Palumbo, L.; Gheorghes, T.N.; Galatsidas, M. Do observers like curvature or do they dislike
angularity? Br. J. Psychol. 2015, 107, 154–178. [CrossRef]
30. Silvera, D.H.; Josephs, R.A.; Giesler, R.B. Bigger is better: The influence of physical size on aesthetic preference
judgments. J. Behav. Decis. Mak. 2002, 15, 189–202. [CrossRef]
31. Latto, R. The brain of the beholder. In The Artful Eye; Gregory, R.L., Harris, J., Heard, P., Rose, D., Eds.;
Oxford University Press: Oxford, UK, 1995; pp. 66–94.
© 2020 by the authors. Licensee MDPI, Basel, Switzerland. This article is an open access
article distributed under the terms and conditions of the Creative Commons Attribution
(CC BY) license (http://creativecommons.org/licenses/by/4.0/).You can also read