Experimental Reflection Evaluation for Attitude Monitoring of Space Orbiting Systems with NRL Arch Method
←
→
Page content transcription
If your browser does not render page correctly, please read the page content below
applied
              sciences
Article
Experimental Reflection Evaluation for Attitude Monitoring of
Space Orbiting Systems with NRL Arch Method
Andrea Delfini 1, *, Roberto Pastore 2 , Fabrizio Piergentili 1 , Fabio Santoni 2 and Mario Marchetti 2

                                           1   Department of Mechanical and Aerospace Engineering, Sapienza Università di Roma, Via Eudossiana 18,
                                               00184 Rome, Italy; fabrizio.piergentili@uniroma1.it
                                           2   Department of Astronautics, Electric and Energy Engineering, Sapienza Università di Roma, Via Eudossiana
                                               18, 00184 Rome, Italy; roberto.pastore@uniroma1.it (R.P.); fabio.santoni@uniroma1.it (F.S.);
                                               mario.marchetti@uniroma1.it (M.M.)
                                           *   Correspondence: andrea.delfini@uniroma1.it

                                           Abstract: The increasing number of satellites orbiting around Earth has led to an uncontrolled increase
                                           in objects within the orbital environment. Since the beginning of the space age on 4 October 1957
                                           (launch of Sputnik I), there have been more than 4900 space launches, leading to over 18,000 satellites
                                           and ground-trackable objects currently orbiting the Earth. For each satellite launched, several other
                                           objects are also sent into orbit, including rocket upper stages, instrument covers, and so on. Having
                                           a reliable system for tracking objects and satellites and monitoring their attitude is at present a
                                           mandatory challenge in order to prevent dangerous collisions and an increase in space debris. In this
                                           paper, the evaluation of the reflection coefficient of different shaped objects has been carried out by

                                    means of the bi-static reflection method, also known as NRL arch measurement, in order to evaluate
                                           their visibility and attitude in a wide range of frequencies (12–18 GHz). The test campaign aims to
Citation: Delfini, A.; Pastore, R.;
Piergentili, F.; Santoni, F.; Marchetti,
                                           correlate the experimental measures with the hypothetical reflection properties of orbiting systems.
M. Experimental Reflection
Evaluation for Attitude Monitoring of      Keywords: attitude monitoring; NRL arch; reflection coefficient; EM characterization
Space Orbiting Systems with NRL
Arch Method. Appl. Sci. 2021, 11,
8632. https://doi.org/10.3390/
app11188632                                1. Introduction
                                                 The determination of the attitude (i.e., the orientation with respect to a given frame of
Academic Editors: Jérôme Morio and
                                           reference) of satellites and orbiting objects is one of the most important tasks for present-
Theodore E. Matikas
                                           day space safety [1–3]. The ever-increasing quantity of space debris, therefore, imposes
                                           an increasingly pressing need to evaluate the trajectory and effects of these potentially
Received: 19 July 2021
                                           dangerous objects. Regarding this critical issue, it is essential to remember that in 2014 the
Accepted: 15 September 2021
                                           European Commission, conscious of the present urgency, undertook the development of
Published: 16 September 2021
                                           a European network of sensors for the surveillance and tracking of orbiting objects and
                                           initiated a specific SST (Space Surveillance and Tracking) support framework program. Italy,
Publisher’s Note: MDPI stays neutral
with regard to jurisdictional claims in
                                           Germany, the U.K., France, and Spain joined the program and constituted, with SatCent,
published maps and institutional affil-
                                           the front desk for SST services, the EUSST Consortium.
iations.
                                                 In this frame, with several thousand objects orbiting around Earth, having a tool
                                           similar to a radar system that could help to track objects and determine their attitude and
                                           re-entry trajectory is therefore of primary importance. In order to envisage the trajectory of
                                           these objects, one has to know their attitude to evaluate the effects of the atmospheric drag
                                           on the trajectory itself, also associating radar measurements with other tracking systems
Copyright: © 2021 by the authors.
                                           such as the optical system, for example, LED (Light Emission Diodes) [4–7], or light-curve
Licensee MDPI, Basel, Switzerland.
                                           acquisition systems [8–10] or magnetometer data [11]. Knowing the attitude using radar
This article is an open access article
distributed under the terms and
                                           systems, therefore, becomes one of the fundamental tasks for the detection of space debris,
conditions of the Creative Commons
                                           as demonstrated by the recent case of the Chinese Space Station Tiangong-1 [12].
Attribution (CC BY) license (https://
creativecommons.org/licenses/by/
4.0/).

Appl. Sci. 2021, 11, 8632. https://doi.org/10.3390/app11188632                                                https://www.mdpi.com/journal/applsci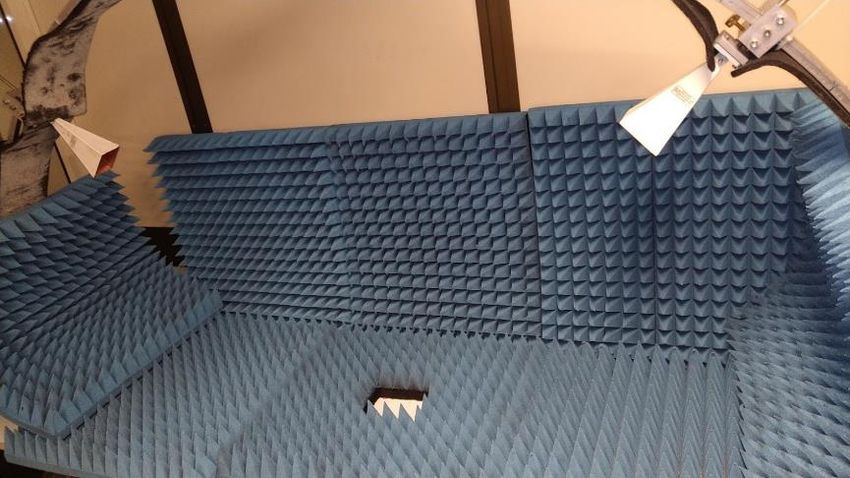
Appl. Sci. 2021, 11, 8632                                                                                            2 of 12

                                  To this aim, the bi-static reflection method, also known as NRL arc measurement,
                            was used in order to determine the reflectivity of several objects that can be assimilated
                            to space debris or to an orbiting satellite, relating the reflectivity to the object’s attitude.
                            NRL arch is the industry standard for testing the reflectivity of materials. Originally
                            designed at the Naval Research Laboratory (NRL), the NRL arch enables fast, repeatable,
                            and non-destructive testing over a wide range of frequencies [13–15]. The experimental
                            reflection results have been related to real radar tracking conditions. The reference radar
                            for tracking orbiting satellites has a frequency of 400 MHz.
                                  In the NRL system, two antennas are used, one for transmitting and the other for
                            receiving signals, from a vector network analyzer (VNA), and microwave reflectivity can be
                            measured at different angles of incidence, simulating different attitude positions. Several
                            objects were built in aluminum, in scale with respect to a real satellite, in order to evaluate
                            the reflection in different conditions of attitude and over a wide range of frequencies,
                            between 12 and 18 GHz, relating the results to the real frequencies and dimensions of use.

                            2. Materials and Methods
                                  The objects under investigation are aluminum-covered models created in order to
                            evaluate their reflection properties in different attitude positions and over a wide range
                            of frequencies. In this case, the attitude is the orientation of the object with respect to
                            its hypothetical orbit. The test campaign, thus, aims to correlate the real experimental
                            measures with the reflection properties of hypothetical orbiting objects.
                                  This aim is carried out considering a reference radar working at 400 MHz, with a
                            wavelength of 75 cm. The experimental frequency range for measurements was set to
                            12–18 GHz with wavelengths of a maximum of 2.5 cm and a minimum of 1.7 cm.
                                  The relation between the real experimental data and the predicted reflection properties
                            is thus given by a simple proportion between the samples’ size, the experimental wave-
                            length, and the reference radar wavelength: a given experimental frequency (12 GHz as an
                            example) corresponds to a given wavelength (2.5 cm), with a precise ratio to the sample
                            size. The same ratio is considered when a 400 MHz, 75 cm wavelength is applied, finding
                            the hypothetical real object size, which is different for every frequency in the 12–18 GHz
                            span. In other words, as the frequency of the reference radar is 400 MHz, with a wavelength
                            of 75 cm, the scaling process of the samples, as a first approximation (i.e., considering only
                            geometry and shape, without considering the effects of the atmosphere such as reflection,
                            refraction, diffraction and interference that are anyway present in a ground tracking),
                            allows to correlate the reflection properties of tested objects, shown in Table 1, to real size
                            objects. In Figure 1, the experimental setup is shown.
                                  The choice of an experimental campaign based on a frequency span measure method
                            and not on a single frequency can be explained with the flexibility of such a methodology,
                            which allows a wider relation between samples and hypothetical real objects. Moreover,
                            the size of the samples was chosen considering the incident wavelength: in real track-
                            ing, at 400 MHz, the wavelength is approximately of the same order of magnitude of
                            the satellite; thus, the same relation was considered for the samples. The shape of the
                            samples was chosen considering the most common shapes of satellites. In future works,
                            a complete satellite model will be manufactured, with more complex geometries, such as
                            parabolic antennas.
                                  The NRL arch method was chosen for the experimental campaign for its capability to
                            perform free space measures: the incident signal wavelength is extremely lower than the
                            distance between antennas and the target, simulating the real signal transmission in the
                            best possible way.
Appl. Sci. 2021, 11, 8632 3 of 12
Appl. Sci. 2021, 11, 8632
Appl. Sci. 2021, 11, 8632
Appl. Sci. 2021, 11, 8632
Appl. Sci. 2021, 11, 8632
Table 1. Pictures and characteristics of the samples under investigation, having a different geometry
Table 1. Pictures and characteristics of the samples under investigation, having a different geometry in order
Table 1. Pictures
in order anddifferent
to evaluate characteristics of the samples
hypothetical under investigation,
orbiting objects. Wavelengths ofhaving a different
a maximum geometry
of 2.5 cm and in order
Table 1. Pictures
different and characteristics of Wavelengths
the samples under investigation,
of 2.5having a different geometry in order
Table 1. hypothetical
different
a minimumPictures and
hypothetical
of 1.7 cm
orbiting
orbiting
were
objects.
characteristics ofWavelengths
objects.
considered the
for samples
the
of a maximum
under investigation,
of a maximum
measurements and scaling
cm and
of 2.5having
cm
process.
a minimum
anda different
a minimum
of 1.7 cm
geometry
of 1.7 cm
were
in order
were
different
for the hypothetical and
measurements orbiting objects.
scaling Wavelengths of a maximum of 2.5 cm and a minimum of 1.7 cm were
process.
different
for hypothetical and
the measurements orbiting objects.
scaling Wavelengths of a maximum of 2.5 cm and a minimum of 1.7 cm were
process.
for the measurements and scaling process.
for the measurements and scaling process.
Specimen Dimensions Dimensions
Specimen
Specimen Dimensions
Specimen Dimensions
Specimen Dimensions
Cubesat
Cubesat Characteristics
Cubesat Characteristics Characteristics
Cubesat Characteristics
Dimensions of
Cubesat
Dimensions of Dimensions
0.1 m per side, of 0.1
0.1 m
m per
per side,
Characteristicsside,
attributable respectively
attributable to Dimensions
a satellite
respectively to of
a 3 of
m 0.1
per
satellite m per
side
of at side,side a
attributable Dimensions
respectively toata 18 of 0.1
satellite of 3 m per
m 3 m
per side,
per side a
attributable
12 GHz andrespectively
to one ofto to of
4.4one
m a satellite
GHz. of 3 m
4.4 m at 18 GHz. per side a
attributable respectively to of
to one a satellite
4.4 m atof
183GHz.
m per side
to one of 4.4 m at 18 GHz.
to one of 4.4 m at 18 GHz.
Cylinder
Cylinder Characteristics
Characteristics
Cylinder
Cylinder Characteristics Characteristics
Dimensions:
Cylinder Characteristics
Dimensions: Dimensions:
Dimensions:
Height:
Height: 0.075 m, Diameter:
Diameter: 0.065
Dimensions:
0.075 m, m 0.065 mm
Height: 0.075 m, Diameter: 0.065
attributable Height:
respectively 0.075
to a m, Diameter:
satellite of 0.065
2.25 m m
attributable respectively
attributable Height: 0.075
to a satellite
respectively toof m,
a 2.25 Diameter:
m in of
satellite height m in
2.250.065 heig
in m
heig
attributable
at 12 GHz andrespectively
to oneand
of to
3.3 to
m a satellite
one
at of
18 3.3
GHz.m of
at 2.25
18 m in heig
GHz.
attributable respectively to a satellite of 2.25 m in hei
and to one of 3.3 m at 18 GHz.
and to one of 3.3 m at 18 GHz.
and to one of 3.3 m at 18 GHz.
Parallelepiped
Parallelepiped Characteristics
Characteristics
Parallelepiped Characteristics
Dimensions:
Parallelepiped
Parallelepiped Characteristics Characteristics
Dimensions:
Dimensions:
Height: 0.08 m, Dimensions:
Width: 0.06 m,
Height: 0.08 Dimensions:
m, Thickness:
Width: 0.06 m,mThickness:
Thickness: 0.0
0.0
Height: 0.08 Height:
m,
attributable Width: 0.08
0.06 m,
m,
respectively Width:
to a 0.06 m,
0.04
satellite 2.4 Thickness:
m high at 0.0
12
attributableHeight: 0.08 m,
respectively Width:
to a2.4 0.06
satellite m, Thickness: 0.
attributable respectively
attributable to a satellite
respectively to a m high2.4
satellite 2.4
m high at 12
at 12
m high at 12
attributable
GHz and one of 3.5 high
of
respectively 3.5
to
of at a high at 18
satellite
3.518high GHz.
2.4
GHz.at 18 GHz. m high at 12
of 3.5 high at 18 GHz.
of 3.5 high at 18 GHz.
Parallelepiped
Parallelepiped Characteristics
Characteristics
Parallelepiped Characteristics
plus
Parallelepiped
Parallelepiped Characteristics plusCharacteristics
plus plus size:
Appendices
plus size:
Appendices
0.12 × 0.02 Appendices
each, the whole Appendices
size: object size:
0.12 ×0.12
0.02× 0.02 each,
each, the whole
the whole object corresponding
Appendices size:
corresponding
object corresponding to
to
to sa
sa
0.12
body × 0.02
2.4 meach,
high the
at whole
12 GHz object
and a corresponding
body 3.5 to sa
0.12
body
satellites ×
with2.40.02 each,
m high
a body 2.4 mthe whole
athigh
12 GHz object
at 12and
GHzaandbody 3.5 m hightoat
a body
m
corresponding high atsa
body 2.4 m high at spanning
appendices 12 GHz and 3.6a body 3.5 m high at
body
3.5 m high 2.4
at 18 m high
GHz, withatappendices
appendices 12 GHz and
spanning 3.6 am
spanningand
and3.65.3
mbody m m,
3.5
5.3 respect
m high
m, at
respect
appendices
and spanning 3.6 m and 5.3 m, respect
5.3 m, respectively.
appendices spanning 3.6 m and 5.3 m, respec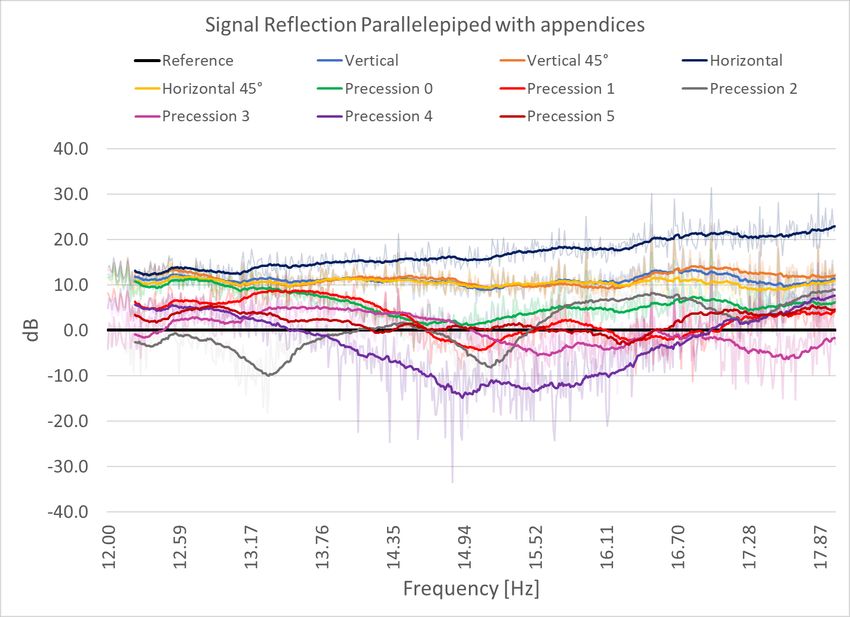
Appl. Sci. 2021, 11, 8632 4 of 12
Appl. Sci. 2021, 11, 8632 4 of 13
Figure1.1.NRL
Figure NRLARCH
ARCHsetup,
setup,with
withhorn
hornantennas
antennasand
andanechoic
anechoicpanels.
panels.
Reflectivityisisdefined
Reflectivity definedasasthe thereduction
reduction inin reflected
reflected power
power caused
caused by by
thethe introduction
introduction of
aofmaterial
a material [16–18].
[16–18]. ThisThis
power power reduction
reduction is compared
is compared to a “perfect”
to a “perfect” reflection,
reflection, which comeswhich
comes
very very
close to close to the reflection
the reflection of a flat
of a flat metal metal
plate. Theplate.
antennasThecan antennas can be positioned
be positioned anywhere
anywhere
on the arc to onallow
the arc to allow performance
performance measurements measurements
with angleswith angles ofnot
of incidence incidence
normal not to
normal
the sample.to the sample.
Thevector
The vectornetwork
networkanalyzer
analyzerisisusedusedto to provide
provide both both stimulus
stimulus andand measurement
measurement [19]. [19].
In
Inthethepresent
presentcase, case,considering
consideringthat thatthe
theaim
aimisisto toevaluate
evaluatethe thereflection
reflectionofofmetal
metalobjects
objects
in
infree
freespace,
space,the thecalibration
calibrationisisperformed
performedby bymeasuring
measuringthe theresulting
resultingpower
powerreflecting
reflectingoff off
aametal
metalplateplateoveroveraawide widefrequency
frequencyrange rangeand andthenthenoveroverthe
thesame
samefrequency
frequencyrangerangeon onaa
radar
radarabsorbing
absorbingmaterialmaterial(ECCOSORB
(ECCOSORB HPY-60, HPY-60,with reflectivityofof−−50
withaareflectivity 50 dB).
dB).TheThelatter
latter
measure will
measure will be be the “zero” or 0 dB level (i.e., the reference level), considering
0 dB level (i.e., the reference level), considering the net the net
of
of errors in the NRL measurement setup, in order to simulate
errors in the NRL measurement setup, in order to simulate a radio wave that is lost in a radio wave that is lost
in spacewithout
space withoutencountering
encounteringany anyreflecting
reflectingbody body[20].[20]. The
The material
material under test test isis then
then
placed
placedon onthetheradar
radarabsorbing
absorbingmaterial
material(RAM)
(RAM)plate,plate,and andthe
thereflected
reflectedsignal
signalisismeasured
measured
in
indB.dB.TheThetime-domain
time-domaingate gateandandanechoic
anechoicpanels
panelsare areused
usedto toeliminate
eliminateantenna
antennacross-talk
cross-talk
and
and clear the error otherwise introduced by room reflections as well as noise. Usingthis
clear the error otherwise introduced by room reflections as well as noise. Using this
configuration,
configuration,ititisispossible possible to to
characterize
characterize thetheproperties
propertiesof systems
of systemsin different directions.
in different direc-
The
tions. measurement
The measurement system is basedisonbased
system Agilent on8571E
Agilent software
8571E (material
software measurement)
(material measure- and
the Agilent PNA-L N5230C vector analyzer. The antennas
ment) and the Agilent PNA-L N5230C vector analyzer. The antennas are Q-par Angus are Q-par Angus Ltd. and are
active
Ltd. and in the
are 12–18
activeGHz in therange.
12–18The GHzsample
range.rating was set
The sample at 512
rating points,
was set atwith a power
512 points, of
with
− 15 dBm and a 1 kHz bandwidth, and the TE polarization
a power of −15 dBm and a 1 kHz bandwidth, and the TE polarization of antennas was of antennas was considered.
The measurements’ reliability lies within the 2 dB range with respect to the reflection
considered.
properties declared in the reliability
The measurements’ ECCOSORB liesdatasheet.
within theMeasurements
2 dB◦ range with of respect
the fabricated samples
to the reflection
are then performed. The antennas are placed at a 45 angle
properties declared in the ECCOSORB datasheet. Measurements of the fabricated samples with respect to the sample
(Figure 1). Every measure has been smoothed with a polynomial (for CubeSat and cylinder)
are then performed. The antennas are placed at a 45° angle with respect to the sample
and a mobile average (for parallelepiped and parallelepiped with appendices) trend line
(Figure 1). Every measure has been smoothed with a polynomial (for CubeSat and cylin-
for a better comprehension of the VNA response.
der) and a mobile average (for parallelepiped and parallelepiped with appendices) trend
3.line for a better
Results comprehension of the VNA response.
and Discussion
3.1. Cubesat
3. Results and Discussion
As reported in Table 1, the sample considered is 0.1 m per side, with a minimum
3.1. Cubesat of 0.025 m and a maximum of 0.017 m that refers to a satellite of 3 m per side
wavelength
As reported
at 12 GHz and to onein Table
of 4.4 m1, at
the18sample
GHz. Theconsidered
positioningis 0.1 m per
of the side, and
CubeSat withthe
a measures
minimum
are shown, respectively, in Figures 2 and 3. Figure 2 shows only one antenna, the per
wavelength of 0.025 m and a maximum of 0.017 m that refers to a satellite of 3 m side
sender,
at order
in 12 GHzto and to one
indicate ofdirection
the 4.4 m at 18ofGHz. The positioning
the signal; of the
the receiving CubeSat
antenna andshown
is not the measures
in the
are shown,
sketch respectively,
(the whole system incanFigures 2 and
be visible in 3. Figure
Figure 1).2 shows only one antenna, the sender,
in order to indicate the direction of the signal; the receiving antenna is not shown in the
sketch (the whole system can be visible in Figure 1).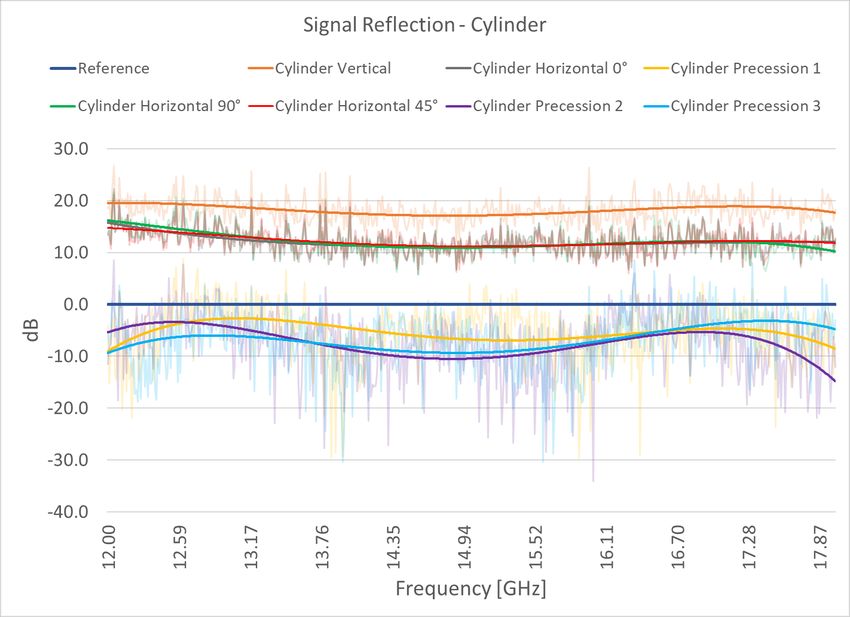
Appl. Appl.
Sci. 2021,
Sci.
Appl. 11, 8632
2021,
Sci. 11,11,8632
2021, 8632 5 of 5135ofof13
12
Figure 2. Cubesat positioning in respect to wave incidence direction.
FigureFigure 2. Cubesat
2. Cubesat positioning
positioning in respect
in respect to wave
to wave incidence
incidence direction.
direction.
Figure3.3.Cubesat
Cubesat signal reflection:
reflection: TE
TE polarization
polarization reflection vs.
vs. frequency.
Figure 3. Cubesat signalsignal
Figure reflection: TE polarization reflection
reflection frequency.
vs. frequency.
Theconfiguration
The configuration of of the
the greatest
greatest reflection
reflection is is the
the “flat”
“flat” one.
one. ForForthe
theother
othermeasure-
measure-
The configuration
ments,ititcan
canbebe seenof the
seen that greatest
that the
the CubeSat reflection
CubeSat 45° ◦ is the “flat” one. For the other measure-
ments, 45 configuration
configurationreflects
reflectsbetween
between12 12and
and13.8
13.8GHz.
GHz.
ments, it canThebe seen that
results leadthe CubeSat
to the
the 45° configuration
consideration that scaled reflects between 12 and 13.8 GHz.
The results lead to consideration that scaled objects
objects in
in the
the flat
flatposition
positionandandwithin
within
The results lead range
thedimensions
dimensions to the aforementioned
consideration that arescaled
visibleobjects
with in the flat position and within
the range aforementioned are visible with aa 400
400MHz
MHzradarradarsystem.
system.Moreover,
Moreover,
the dimensions range aforementioned are visible with a 400 MHz radar system. Moreover,
that means that satellites between 3 and 3.8 m can be seen when they are in theCubeSat
that means that satellites between 3 and 3.8 m can be seen when they are in the CubeSat
that means that satellites
◦ attitude
45° attitude between
configuration. The3 and 3.8 mofcan be seen when (meaning
they are in the CubeSat
45 configuration. The presence
presence of negative
negative curves
curves (meaningmore moreabsorption)
absorption)
45° attitude
testifiesconfiguration.
testifies thatin
that inthose The presencethe
those configurations,
configurations, of signal
the negative
signal is curves (meaning
is diverted
diverted toward
toward thethemore absorption)
absorbing
absorbing plane
planeand
and
testifies that
thereforein those
does configurations,
not reach the the
receiving
therefore does not reach the receiving antenna. signal is
antenna. diverted toward the absorbing plane and
therefore does not reach the receiving antenna.
3.2.Cylinder
3.2. Cylinder
3.2. CylinderThe sample
The sample has has the
thefollowing
followingparameters.
parameters. Height: 0.0750.075
Height: m, Diameter: 0.065 m,
m, Diameter: mini-
0.065 m,
The
mum sample
minimum has the
frequency
frequency following
0.025 m, and
0.025 parameters.
m,maximum
and maximum Height:
0.017 m 0.075
that
0.017 m canm,beDiameter:
that referred
can to0.065 m,
to mini-
a satellite
be referred of 2.25
a satellite
mumof frequency
m2.25
in height 0.025 m,
at 12 GHz
m in height and
at 12and maximum
GHzto one
and of 0.017
to 3.3 m that
onemofat3.3
18 mcan
GHz. be referred
at 18Three to a satellite
GHz.configurations of 2.25
were
Three configurations consid-
were
m inconsidered.
height at 12
ered. The GHz
first,
The andcylinder
cylinder
first, toinone ofin3.3
a vertical m at 18 position;
position;
a vertical GHz. Three
the configurations
the second, cylinder werein aconsid-
in a horizontal
second, cylinder position
horizontal
ered.position
The first, cylinder
and rotatinginaround
a vertical
theposition; the second,
vertical axis; cylinder
the third, cylinderinin
a horizontal
precession,position
according to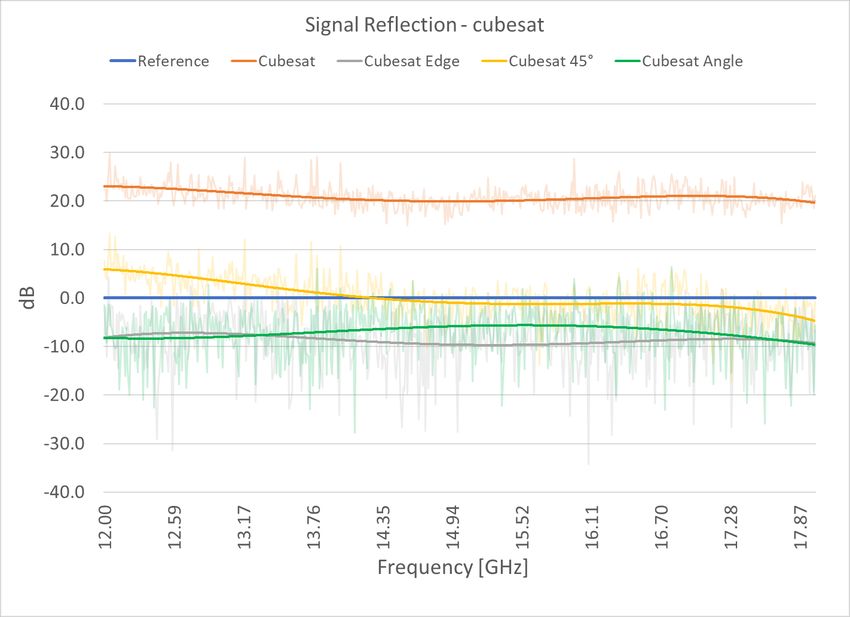
Appl. Sci. 2021, 11, 8632 6 of 13
Appl.
Appl. Sci.
Sci. 2021,
2021, 11,11,8632
8632 6 6ofof13
12
and rotating around the vertical axis; the third, cylinder in precession, according to a cone
of
and45° with respect
rotating around tothe
thevertical
verticalaxis;
axis.the
In this configuration,
third, the 0° angle
cylinder in precession, is the onetoina which
according cone
a cone of 45◦ with respect to the vertical axis. In this configuration, the 0◦ angle is the one
the satellite is aligned with the incident wave. The positions 45°, 90°, 315° have been
of 45° with respect to the vertical axis. In this configuration, the 0° angle is the one in which con-
in which the satellite is aligned with the incident wave. The positions 45◦ , 90◦ , 315◦ have
sidered. In Figure 4, the positioning of the samples is shown, while in Figure 5,
the satellite is aligned with the incident wave. The positions 45°, 90°, 315° have been con-the reflec-
been considered. In Figure 4, the positioning of the samples is shown, while in Figure 5,
tion plotsInare
sidered. given.
Figure 4, the positioning of the samples is shown, while in Figure 5, the reflec-
the reflection plots are given.
tion plots are given.
(a) (b)
(a) (b)
Figure4.4.Cylinder
Figure Cylinderpositioning
positioningininrespect
respectto
towave
waveincidence
incidencedirection.
direction.(a)
(a)Horizontal
Horizontaland
andvertical
verticalpositions;
positions;(b)
(b)precession
precession
Figure 4. Cylinder positioning in respect to wave incidence direction. (a) Horizontal and vertical positions; (b) precession
positions.
positions.
positions.
Figure
Figure5.5. Cylinder
5.Cylinder signal reflection:
Cylinder signal
signal reflection: TE
TE polarization
polarization reflectionvs.
vs. frequency.
Figure reflection: TE polarization reflection
reflection vs. frequency.
frequency.
In this
Inthis case,
thiscase, too, the
case, too,
too, the greatest
greatest reflection
reflectionoccurs
occursin inthe
thevertical
vertical configuration,followed
followed
In the greatest reflection occurs in the vertical configuration,
configuration, followed
by the
bythe
by three
thethree horizontal
three horizontal configurations.
horizontal configurations.
configurations. The The object
The object is clearly
object isis clearly visible
clearlyvisible throughout
visiblethroughout
throughoutthe thefre-
the fre-
fre-
quency range.
quencyrange.
quency The precession
range. The
The precession configurations,
precession configurations,on
configurations, onthe
on theother
the otherhand,
other hand,are,
hand, are,at
are, atthese
at thesefrequencies,
these frequencies,
frequencies,
completely invisible to the radar, as their reflection does not occur
completely invisible to the radar, as their reflection does not occur in the directionof
completely invisible to the radar, as their reflection does not occur in
in the
the direction
direction ofthe
of the
the
receiving
receiving antenna.
antenna.
receiving antenna.
Regarding the
Regarding the scaled
scaledobjects,
scaled objects,the
objects, theresult
the resultalso
result alsoleads
also leadsto
leads tothe
to theconsideration
the considerationthat
consideration thatsatellites
that satellites
satellites
with the dimensions
withthe dimensions range
with range aforementioned
range aforementioned
aforementioned are are visible
are visible with
visible with a 400
with aa 400 MHz
400 MHz
MHzradarradar system
radarsystem
systemwhen when
when
in
inaa vertical
in vertical or horizontal
or horizontal attitude,
horizontalattitude, while
attitude,while
while the
the precession
precession
the precession configurations
configurations
configurations areare
are completely
completely
completely in-in-
visible
visible to the radar.
invisible to the radar.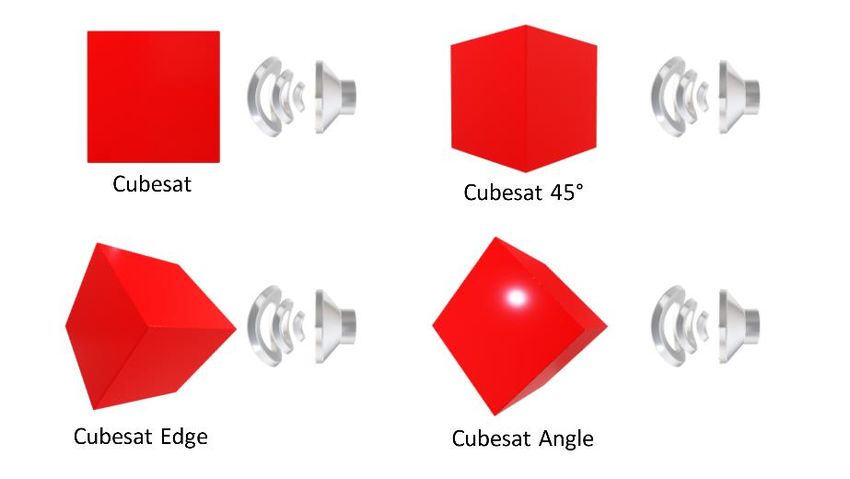
Appl. Sci. 2021, 11, 8632 7 of 13
Appl. Sci. 2021, 11, 8632 7 of 12
3.3. Parallelepiped
The sample has the following parameters. Sample size: 0.08 × 0.06 × 0.04 m, minimum
3.3. Parallelepiped
frequency 0.025 m, and maximum 0.017 m attributable to a satellite 2.4 m high at 12 GHz
and Theone sample
of 3.5 at has18the following
GHz. Three parameters.
configurations Sample
weresize: 0.08 × 0.06
considered. × 0.04
The first,m, minimum
satellite in a
frequency 0.025 m,the
vertical position; and maximum
second, 0.017
satellite in amhorizontal
attributable to a satellite
position 2.4 m high
and rotating aroundat 12 GHz
the ver-
and
ticalone
axis;ofthe
3.5 third,
at 18 GHz.
satelliteThree
in aconfigurations
precession, according were considered.
to a 45° coneThewith
first,respect
satellitetointhe
a
vertical position; the second, satellite in a horizontal position and rotating
vertical axis. In this configuration, the 0° angle is the one in which the satellite is perpen- around the vertical
axis; the to
dicular third, satellite in
the incident a precession,
wave. The positions according
45°, 225°, 45◦ cone
to a 270°, 180°,with
andrespect
225° wereto the vertical
considered
axis. In this configuration, the 0 ◦ angle is the one in which the satellite is perpendicular to
with an anticlockwise rotation of 45° around the longitudinal satellite axis. In Figure 6, the
the incident wave.
positioning The positions
of the sample is shown; 45◦ ,in225 ◦ , 270◦ , 180◦ , and 225◦ were considered with an
Figure 7, the reflectivity plots are depicted.
anticlockwise rotation ◦
In this case, the of 45 around
maximum the longitudinal
reflection occurs in satellite axis. In Figurein6,horizontal
the configurations the positioning
rota-
of the sample is shown; in Figure 7, the reflectivity plots are depicted.
tion, which exposes a greater surface to the signal; the maximum reflection occurs for the
In this case, thefollowed
90° configuration, maximum byreflection
the 45° and occurs in configuration.
the 0° the configurationsThe in horizontal
vertical rotation,
configuration
which exposes a greater surface to the signal; the maximum reflection occurs for the 90 ◦
also reflects the signal well. It can be seen that the shape of the curves is absolutely un-
configuration, ◦ ◦
changed, withfollowedan almost byconstant
the 45 and the 0 configuration.
frequency response. The vertical configuration also
reflects the signal well. It can be seen that the shape
In the configurations of the samples in precession, the only of the curves is absolutely
one that showsunchanged,
a non-
with an almost constant frequency response.
reflective behavior in all frequencies is 1, with 225° of rotation around the precession axis,
In thethe
in which configurations
signal is reflectedof theinsamples in precession,
all directions the only
except toward theone that shows
receiving a non-
antenna. In
reflective behavior in all frequencies is 1, with 225◦ of rotation around the precession axis,
the others, it can be seen how configuration 5, at 135° of rotation around the precession
in which the signal is reflected in all directions except toward the receiving antenna. In the
axis, is the one that manages to reflect the signal in all frequencies, with peaks between 5
others, it can be seen how configuration 5, at 135◦ of rotation around the precession axis,
and 6 dB, at regular intervals, at frequencies 13.8, 15.5 and 17 GHz. At 15 GHz, there is the
is the one that manages to reflect the signal in all frequencies, with peaks between 5 and 6 dB,
minimum, where there is no reflection. It will thus be possible to understand when the
at regular intervals, at frequencies 13.8, 15.5 and 17 GHz. At 15 GHz, there is the minimum,
satellite will be in this configuration by associating an optical detection system. Configu-
where there is no reflection. It will thus be possible to understand when the satellite will be
ration 3, at 270° of rotation around the precession axis, also has frequencies in which it is
in this configuration by associating an optical detection system. Configuration 3, at 270◦ of
possible to identify its position, as well as 2 and 0 (180° and 45°). Respectively, this occurs
rotation around the precession axis, also has frequencies in which it is possible to identify its
at frequencies between 12.4 and 14 GHz (3), between 15.5 and 16.3, and at 18 GHz (2), at
position, as well as 2 and 0 (180◦ and 45◦ ). Respectively, this occurs at frequencies between
12.9, and between 14.0 and 14.4 GHz (0). Configuration 4, 225° of rotation around the pre-
12.4 and 14 GHz (3), between 15.5 and 16.3, and at 18 GHz (2), at 12.9, and between 14.0 and
cession axis with 45° rotation around the longitudinal axis of the satellite, has suitable
14.4 GHz (0). Configuration 4, 225◦ of rotation around the precession axis with 45◦ rotation
reflection
around theonly at 12.4 GHz.
longitudinal axis of the satellite, has suitable reflection only at 12.4 GHz.
(a)
(b)
Figure 6. Parallelepiped positioning in respect to wave incidence direction. (a) Horizontal and vertical positions; (b) preces-
sion positions.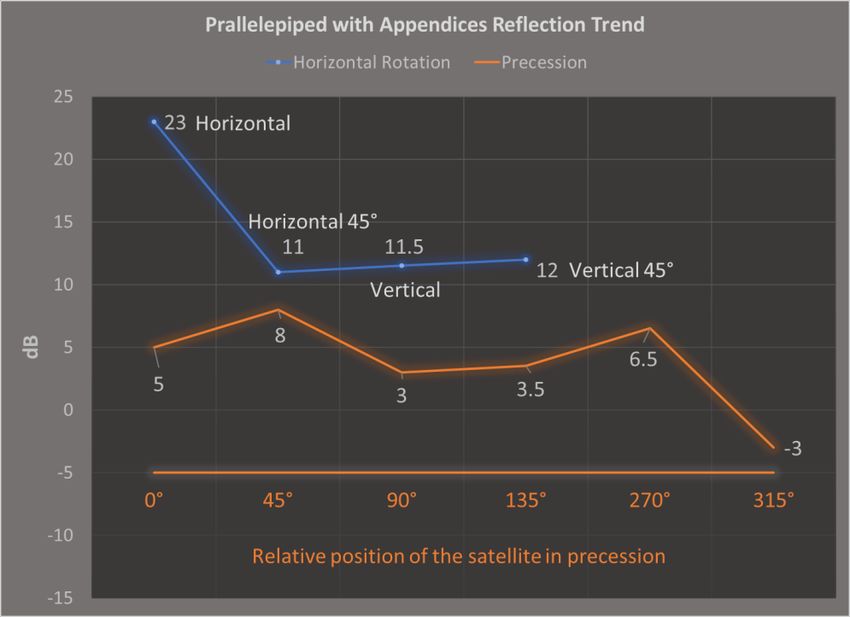
Appl. Sci. 2021, 11, 8632 8 of 13
Appl. Sci. 2021, 11, 8632 8 of 12
Figure 6. Parallelepiped positioning in respect to wave incidence direction. (a) Horizontal and vertical positions; (b) pre-
cession positions.
Figure7.7.Parallelepiped
Figure Parallelepiped signal
signal reflection:
reflection: TE
TE polarization
polarization reflection
reflection vs.
vs. frequency.
frequency.
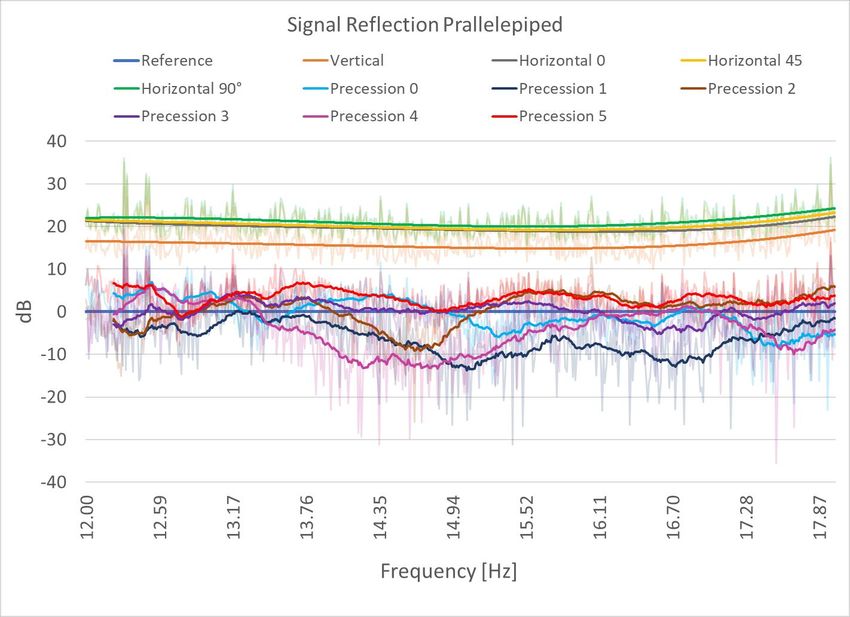
Theexperimental
The experimentalresults
resultsshowshowthatthatscaled
scaledobjects
objectsin inthe
the90 ◦ , 45
90°, ◦ , and
45°, and 00°◦ attitude
attitude posi-
po-
sitions, with the dimensions, range aforementioned, are visible with
tions, with the dimensions, range aforementioned, are visible with a 400 MHz radar system. a 400 MHz radar sys-
tem.Considering the precession positions where the objects better reflect the incident
waves, Considering the precession
it can be assumed that the positions where the
corresponding objects
scaled better
object of 3.5reflect
m willthebeincident
visible
waves,
only it can positions
in some be assumed when thatathe400corresponding
MHz radar signal scaled is object
tracking of 3.5
it: itmwill
willbebevisible
visibleforonly
all
in some
the positions
horizontal andwhen
verticala 400 MHz radar
positions and forsignal is tracking
Precession it: it will be3visible
2, Precession for all the5
and Precession
horizontalConsidering
positions. and verticalthe positions and for
differences Precession
in the reflected2,values,
Precession 3 and Precession
the different positions5can posi-
be
tions. Considering
clearly found. the differences in the reflected values, the different positions can be
clearly found. the 18 GHz frequency (3.5 m scaled object), the reflection signal related to
Considering
Considering
the relative attitudethepositions
18 GHz can frequency (3.5 m scaled
be highlighted object),
in Figure the reflection
8, where signalpositions
both planar related
to the
and relative attitude
precession positionspositions
are shown. can be highlighted in Figure 8, where both planar posi-
tionsThe
andgreat
precession positions
visibility are shown.
of the object can be noted when it is placed in horizontal positions
The great
and rotation, visibility
while, whenofinthe object canitbe
precession, noted when
appears it is placed
clear that in horizontal
the visibility stronglypositions
depends
and rotation, while, when in precession, it appears clear that the
on the relative position. Moreover, the reflection trend for the horizontal position leads visibility strongly de-
pends on the relative position. Moreover, the reflection trend
to the consideration that the larger is the width of the body exposed to the EM field, for the horizontal position
leads
the to theisconsideration
higher the reflection that and the
thuslarger is the width
the visibility. Onof thethe bodyhand,
other exposed to the
as said, EM field,
considering
the object
the higherin is precession,
the reflectionthe and thus the
relative visibility.
position of On
the the
bodyother hand,
plays as said,
a more considering
important role:
theorientation
the object in precession,
due to the the relativeisposition
rotation of thefor
responsible bodytheplays
highesta more important
visibility ◦ , asthe
at 270role: the
orientation
path due to the
of the reflected rotation
wave is responsible
is directed toward thefor the highestantenna,
receiving visibility andat 270°, as the
it is not path
scattered
of theas
away reflected
in the 225 ◦ position.
wave is directed toward the receiving antenna, and it is not scattered away
as in the 225° position.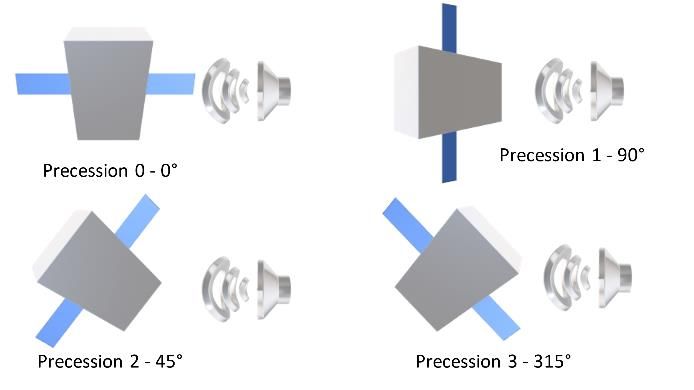
Appl.Appl.
Sci. 2021, 11, 8632
Sci. 2021, 11, 8632 9 9ofof13
12
Appl. Sci. 2021, 11, 8632 9 of 13
Figure
Figure 8. Parallelepiped
8. Parallelepiped
Parallelepiped reflection trend.
reflection
Figure 8. reflectiontrend.
trend.
3.4.3.4.
3.4. Prallelepiped
Prallelepiped
Prallelepiped with
with
with Appendices
Appendices
Appendices
Three
Three configurations
Three configurations
configurations were were
were considered.
considered.
considered. TheThe
The first,
first, object
object
first, object invertical
in ain aa vertical
vertical position;
position;
position; thethe
thesec-
sec- sec-
ond,ond, object
ond, object in a horizontal
object in a horizontal position
horizontalposition
positionand and rotating
androtating
rotating around
around
around the
thethe vertical
vertical axis;
vertical axis; the
thethe
axis; third,
third, sample
sample
third, sample
in in
in a a precession,
a precession,
precession, according
according
according tototo a45
a a45°45° cone
◦ cone
cone with
with respect
respect
with respect totothe
to the vertical
vertical
the axis.
axis.
vertical In In
In this
axis. this configura-
configura-
this configu-
tion,
tion,
ration, an
anan anticlockwise
anticlockwise
anticlockwise rotation
rotation
rotationwas was considered,
considered,
was with
with
considered, 0°, 0°,
with 045°,
45°, 4590°,
◦ ,90°, , 90135°,
◦135°, 135270°,
◦ ,270°,◦ ,and
270and 315°
◦ , and
315° po-◦
po-315
sitions.
sitions.
positions. TheThe
The positioning
positioning
positioningof of
of the
the the sample
sample
sample and
and thethe
and measures
measures
the measures graphsgraphs
graphsareare
shown
are shown
shown in
inFigures
in Figures 9 99
Figures
andand10,10, respectively.
respectively.
and 10, respectively.
Appl. Sci. 2021, 11, 8632 10 of 13
(a)(a)
(b)
Figure 9. Parallelepiped with appendices positioning in respect to the wave incidence direction. (a) Horizontal and vertical
Figure 9. Parallelepiped with appendices positioning in respect to the wave incidence direction. (a) Horizontal and vertical
positions; (b) precession
positions; positions.
(b) precession positions.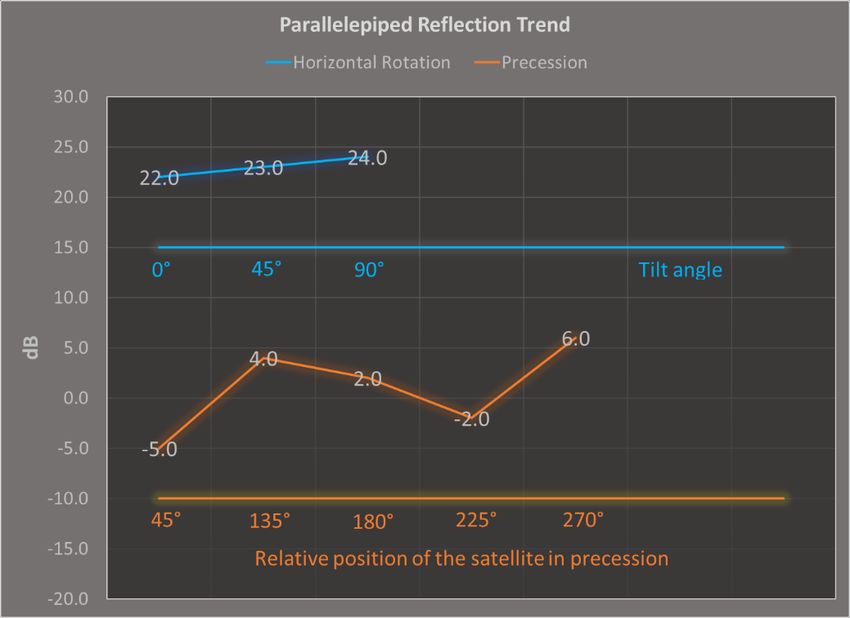
(b)
Appl. Sci. 2021, 11, 8632 10 of 12
Figure 9. Parallelepiped with appendices positioning in respect to the wave incidence direction. (a) Horizontal and vertical
positions; (b) precession positions.
Figure10.
Figure 10.Parallelepiped
Parallelepiped with
with appendices
appendices signal
signal reflection:
reflection: TE
TEpolarization
polarizationreflection
reflectionvs.
vs.frequency.
frequency.
Thecase
The casewith
withthe
the highest
highest reflection
reflection is the
is the horizontal
horizontal position,
position, withwith an increasing
an increasing trend
trend between
between 13 and13 23and
dB of 23 reflection
dB of reflection at the extreme
at the extreme frequencies.
frequencies. Vertical,
Vertical, vertical
vertical at 45◦ at
of
45° of rotation on the longitudinal axis, and horizontal ◦ at 45° of rotation
rotation on the longitudinal axis, and horizontal at 45 of rotation on the longitudinal axis on the longitudi-
nal axis measures
measures have a more have a more trend
flattened flattened trendfrom
starting starting
13 dB from
at 1213GHz
dB at 12 ending
and GHz and ending
at 10 dB at
18 GHz. It is also important to note that several spikes on the plots are visible forvisible
at 10 dB at 18 GHz. It is also important to note that several spikes on the plots are all the
for all theatpositions
positions the sameatfrequencies
the same frequencies
(16.5 GHz,(16.5 GHz, 17
16.7 GHz, 16.7 GHz,
GHz, 17 GHz,
17.4 GHz, 17.4
17.8 GHz,
GHz).17.8
GHz).All the precession positions are visible at 18 GHz, except position Precession 3.
From All15.5theGHz
precession
to 18 GHz, positions are visible
satellites at 18 GHz,0 except
in Precession position Precession
and Precession 2 are always3. From
visi-
15.5while
ble, GHz objects
to 18 GHz,
in thesatellites in Precession
Precession 1 position0are and Precession
visible between 2 are always
17.3 and 18 visible, while
GHz only.
objects in the Precession
At lower frequencies, 1 position
from 12 to are13.8
visible
GHz,between 17.3inand
satellites the 18 GHz only.
Precession 2 position are
not visible, while Precession 0 and 1 present the highest values of reflection. position are
At lower frequencies, from 12 to 13.8 GHz, satellites in the Precession 2
not visible,
The testwhile Precession
campaign 0 and
leads to 1 present the highest
the consideration values
that scaled of reflection.
objects, in horizontal, vertical,
vertical at 45 of rotation on the longitudinal axis, and horizontal at 45in◦ horizontal,
The test◦ campaign leads to the consideration that scaled objects, of rotation onverti-
the
cal, vertical at 45° of rotation on the longitudinal axis, and horizontal
longitudinal axis positions, with the dimensions range aforementioned, are visible with at 45° of rotation ona
400 MHz radar system.
That means that, for instance, an object of 3.46 m at 17.8 GHz, with relative appendices,
is clearly visible. For precession positions, an object of 3.5 m length is always visible, except
when in the Precession 3 position and its attitude is determined by its reflection value.
Objects between 3 and 3.5 m are visible when in Precession 0 and Precession 2 positions,
while when in the Precession 1 position, only objects between 3.4 and 3.5 m are visible.
Objects from 2.4 to 2.7 m in the Precession 2 position are not visible, while Precession 0 and
1 present the highest reflection.
As a concluding remark, in view of the differences in the above-mentioned reflected
values, the different attitude positions can be clearly found for the objects under considera-
tion when they are tracked with a 400 MHz radar signal.
Regarding the 18 GHz frequency (3.5 m scaled object), the reflection signal related to
the relative attitude positions is highlighted in Figure 11, where both planar and precession
positions are shown.sion 0 and 1 present the highest reflection.
As a concluding remark, in view of the differences in the above-mentioned reflected
values, the different attitude positions can be clearly found for the objects under consid-
eration when they are tracked with a 400 MHz radar signal.
Appl. Sci. 2021, 11, 8632 Regarding the 18 GHz frequency (3.5 m scaled object), the reflection signal related 11
toof 12
the relative attitude positions is highlighted in Figure 11, where both planar and preces-
sion positions are shown.
Figure 11.
Figure 11. Parallelepiped
Parallelepipedwith
withappendices
appendicesreflection trend.
reflection trend.
The great
The great visibility
visibilityofofthe
theobject
objectcan
canbebenoted
noted when
when it isit placed in horizontal
is placed positions
in horizontal positions
and rotation; instead, when in precession, it appears clear that the visibility
and rotation; instead, when in precession, it appears clear that the visibility depends depends on
the relative position but, thanks to the presence of the appendices, only
on the relative position but, thanks to the presence of the appendices, only the 315◦ — the 315°—Preces-
sion 3 position
Precession is not visible.
3 position The reflection
is not visible. trend for
The reflection the for
trend in-plane positions
the in-plane leads toleads
positions the to
consideration that, because the larger is the width of the body exposed to
the consideration that, because the larger is the width of the body exposed to the EM field, the EM field,
the higher is the reflection and thus the visibility, the presence of the appendices enhances
the higher is the reflection and thus the visibility, the presence of the appendices enhances
the reflection properties of the body in horizontal 0° position. In the horizontal 45° posi-
the reflection properties of the body in horizontal 0◦ position. In the horizontal 45◦ position,
tion, the reflected wave is not affected by the presence of the appendices, so that the ver-
the reflected wave is not affected by the presence of the appendices, so that the vertical
tical positions present almost the same value making it difficult to identify the relative
positions present almost the same value making it difficult to identify the relative position.
position.
On the other hand, considering the object in precession, the body relative position
On the other hand, considering the object in precession, the body relative position
plays the most important role: the orientation due to the rotation is responsible for the
plays the most important role: the orientation due to the rotation is responsible for the
highest visibility at 45◦ . Differently from the previous case, the 270◦ position, although
highest visibility at 45°. Differently from the previous case, the 270° position, although
with the second higher reflection value, presents a slightly lower value, probably due to
with the second higher reflection value, presents a slightly lower value, probably due to
the positions of the
the positions of the appendices
appendicesininrespect
respecttotothethe incident
incident wave.wave.
4. Conclusions
The test campaign has brought very promising results. The behavior of the samples,
tested in different shapes and configurations, showed that it is possible to determine the
attitude in orbit of an object based on its reflection from a radar signal. In fact, the different
configurations tested show how a different setup produces a single response, which can
be associated with a different position. By associating this system with an optical system,
for example, LEDs or light-curve acquisition systems, or magnetometer data to determine
the attitude of a satellite, it will be possible to determine its exact position. Scaling the
model makes it possible to carry out evaluations even for large satellites and space debris,
which are usually identified by radar systems with much lower frequencies than those of
the experimental system considered.
These results, therefore, have a double value: they allow us to identify small satellites
in a high-frequency range (12–18 GHz) as well as to have a prediction of visibility of large
orbiting systems at the frequencies of the actual present radar systems, based on the scale
considered. For example, it will be possible to determine the attitude of a satellite of a
certain size by considering the working frequency of the radar and its wavelength and a
scale model that is subjected to a measurement frequency at the same scale.Appl. Sci. 2021, 11, 8632 12 of 12
Author Contributions: Conceptualization, A.D., F.P.; methodology, A.D. and R.P.; software, A.D. and
R.P.; validation, F.S., F.P. and M.M.; formal analysis, A.D. and R.P.; investigation, A.D., F.P. and
R.P.; resources, F.P.; data curation, A.D. and R.P.; writing—original draft preparation, A.D. and R.P.;
writing—review and editing, A.D., F.P., F.S., M.M. and R.P.; visualization, A.D.; supervision, F.P. and
F.S.; project administration, F.P.; funding acquisition, F.P. All authors have read and agreed to the
published version of the manuscript.
Funding: This research was funded by the Italian Space Agency through the grant agreement n.
2020-6-HH.0 (Detriti Spaziali—Supporto alle attività IADC e SST 2019–2021).
Conflicts of Interest: The authors declare no conflict of interest.
References
1. European Union. Decision No 541/2014/EU of the European Parliament and of the Council establishing a framework for space
surveillance and tracking support. Off. J. Eur. Union 2014, 1, 158–227.
2. Shan, M.; Guo, J.; Gill, E. Review and comparison of active space debris capturing and removal methods. Prog. Aerosp. Sci. 2016,
80, 18–32. [CrossRef]
3. Hossein, S.H.; Acernese, M.; Cardona, T.; Cialone, G.; Curianò, F.; Mariani, L.; Marini, V.; Marzioli, P.; Parisi, L.; Piergentili,
F.; et al. Sapienza space debris observatory network (SSON): A high coverage infrastructure for space debris monitoring. J. Space
Saf. Eng. 2020, 7, 30–37. [CrossRef]
4. Marzioli, P.; Gianfermo, A.; Frezza, L.; Amadio, D.; Picci, N.; Curianò, F.; Pancalli, M.G.; Vestito, E.; Schachter, J.; Szczerba,
M.; et al. Usage of light emitting diodes (LEDs) for improved satellite tracking. Acta Astronaut. 2021, 179, 228–237. [CrossRef]
5. Picci, N.; Pancalli, M.G.; Gianfermo, A.; Marzioli, P.; Frezza, L.; Amadio, D.; Curianò, F.; Vestito, E.; Schachter, J.; Szczerba,
M.; et al. Development and qualification of a LED-based payload for a CubeSat platform: LEDSAT mission. In Proceedings of the
International Astronautical Congress, IAC, Dubai, United Arab Emirates, 12–16 October 2020.
6. Piergentili, F.; Ravaglia, R.; Santoni, F. Close approach analysis in the geosynchronous region using optical measurements. J. Guid.
Control. Dyn. 2014, 37, 705–710. [CrossRef]
7. Porfilio, M.; Piergentili, F.; Graziani, F. The 2002 Italian optical observations of the geosynchronous region. Adv. Astronaut. Sci.
2003, 114, 1237–1252.
8. Piergentili, F.; Zarcone, G.; Parisi, L.; Mariani, L.; Hossein, S.H.; Santoni, F. LEO object’s light-curve acquisition system and their
inversion for attitude reconstruction. Aerospace 2020, 8, 4. [CrossRef]
9. Cardona, T.; Seitzer, P.; Rossi, A.; Piergentili, F.; Santoni, F. BVRI photometric observations and light-curve analysis of GEO
objects. Adv. Space Res. 2016, 58, 514–527. [CrossRef]
10. Piergentili, F.; Santoni, F.; Seitzer, P. Attitude determination of orbiting objects from lightcurve measurements. IEEE Trans. Aerosp.
Electron. Syst. 2017, 53, 81–90. [CrossRef]
11. Santoni, F.; Piergentili, F. UNISAT-3 attitude determination using solar panel and magnetometer data. In Proceedings of the
International Astronautical Congress, IAC, Fukuoka, Japan, 16–21 October 2005.
12. Vellutini, E.; Bianchi, G.; Pardini, C.; Anselmo, L.; Pisanu, T.; Di Lizia, P.; Piergentili, F.; Monaci, F.; Reali, M.; Villadei, W.; et al.
Monitoring the final orbital decay and the re-entry of Tiangong-1 with the Italian SST ground sensor network. J. Space Saf. Eng.
2020, 7, 487–501. [CrossRef]
13. Micheli, D.; Vricella, A.; Pastore, R.; Marchetti, M. Synthesis and electromagnetic characterization of frequency selective radar
absorbing materials using carbon nanopowders. Carbon 2014, 77, 756–774. [CrossRef]
14. Umari, M.; Ghodgaonkar, D.; Varadan, V. A free-space bistatic calibration technique for the measurement of parallel and
perpendicular reflection coefficients of planar samples. IEEE Trans. Instrum. Meas. 1991, 40, 19–24. [CrossRef]
15. Emerson & Cuming Microwave Products. Nrl arch reflectivity testing basic notes. Tech. Bull. 101.
16. Joseph, J.C. Multiple Angle of Incidence Measurement Technique for the Permittivity and Permeability of Lossy Materials at
Millimeter Wavelengths. Master’s Thesis, Air Force Institute of Technology, Wright-Patterson, OH, USA, 1 December 1986.
17. Ghodgaonkar, D.K.; Varadan, V.V.; Varadan, V.K. A new free-space method for explicit determination of complex permittivity
and complex permeability of magnetic materials at microwave frequencies using bistatic measurements. In Proceedings of the
URSI Radio Science Meeting Program and Abstracts, University of Colorado, Boulder, CO, USA, 4–6 January 1989.
18. Cullen, A.L. A new free-wave method for ferrite measurement at millimeter wavelengths. Radio Sci. 1987, 22, 1168–1170.
[CrossRef]
19. Hassan, N.; Idris, H.A.; Abd Malek, M.F.; Taib, M.N.; Ali, W.K.W.; Soh, P.J.; Al-Hadi, A.A.; Hoon, W.F. Measurement of pyramidal
microwave absorbers using RCS methods. In Proceedings of the 2010 International Conference on Intelligent and Advanced
Systems, Kuala Lumpur, Malaysia, 15–17 June 2010.
20. Micheli, D.; Apollo, C.; Gradoni, G.; Pastore, R.; Bueno Morless, R.; Marchetti, M. Experimental validation of theoretical
microwave absorbing structure design methods, in electromagnetic absorption and shielding of composite materials and
nanomaterials. Riv. Ital. Compos. Nanotecnol. 2011, 7, 257–282.You can also read


