SAS Business Intelligence for the Health Care Industry - Practical Applications - Renu Gehring
←
→
Page content transcription
If your browser does not render page correctly, please read the page content below

SAS Business Intelligence
     ®

for the Health Care Industry
         Practical Applications

             Renu Gehring
Contents

About This Book ................................................................................................. xi
About The Author ............................................................................................. xiii
Acknowledgments ............................................................................................. xv
Chapter 1: An Overview of SAS Business Intelligence .......................................... 1
1.1 Introduction ........................................................................................................................................... 1
1.2 Features of the US Health-Care Industry ........................................................................................... 2
    1.2.1 Public Insurance Programs ........................................................................................................ 2
1.3 Data Used in This Book ........................................................................................................................ 3
1.4 SAS BI Solutions for the Health-Care Industry .................................................................................. 6
1.5 Conceptual Architecture of SAS BI Platform ..................................................................................... 6
1.6 Physical Architecture of the SAS BI Platform .................................................................................... 7
1.7 Types of SAS BI Tools .......................................................................................................................... 8
1.8 Seamless Integration between SAS BI Tools ..................................................................................... 8
1.9 SAS Metadata: The Glue That Holds It All Together ....................................................................... 11
1.10 Features of the SAS BI Platform ...................................................................................................... 12
1.11 Description of SAS BI Applications ................................................................................................. 13
1.12 Conclusion ......................................................................................................................................... 16
Chapter 2: Creating SAS Stored Processes for the Finance Department ............ 17
2.1 Introduction ......................................................................................................................................... 17
2.2 Basic Stored Processes ..................................................................................................................... 18
    2.2.1 Tabulating Charges by Dates of Service and Payment ......................................................... 18
    2.2.2 Calculating Historical Ratio of Paid/Charged Amounts ........................................................ 21
    2.2.3 Tracking Revenues, Costs, and Enrollment ........................................................................... 23
2.3 Advanced Stored Processes.............................................................................................................. 24
      2.3.1 Creating a Stored Process with Linked Prompts ................................................................... 24
      2.3.2 Chaining Stored Processes ...................................................................................................... 26
2.4 Modifying a Stored Process............................................................................................................... 29
2.5 Creating Stored Processes with Complex Macro Programming................................................... 30
    2.5.1 Multiple Values Selection in Prompt........................................................................................ 30
    2.5.2 All Possible Values Selection in Prompt ................................................................................. 33
2.6 Conclusion ........................................................................................................................................... 34
Chapter 3: SAS Add-In for Microsoft Office for the Business Analyst ................. 35
3.1 Introduction ......................................................................................................................................... 35
3.2 Running a SAS Stored Process ......................................................................................................... 35

Gehring, Renu. SAS Business Intelligence for the Health Care Industry: Practical Applications. Copyright © 2013, SAS Institute Inc.,
Cary, North Carolina, USA. ALL RIGHTS RESERVED. For additional SAS resources, visit support.sas.com/bookstore.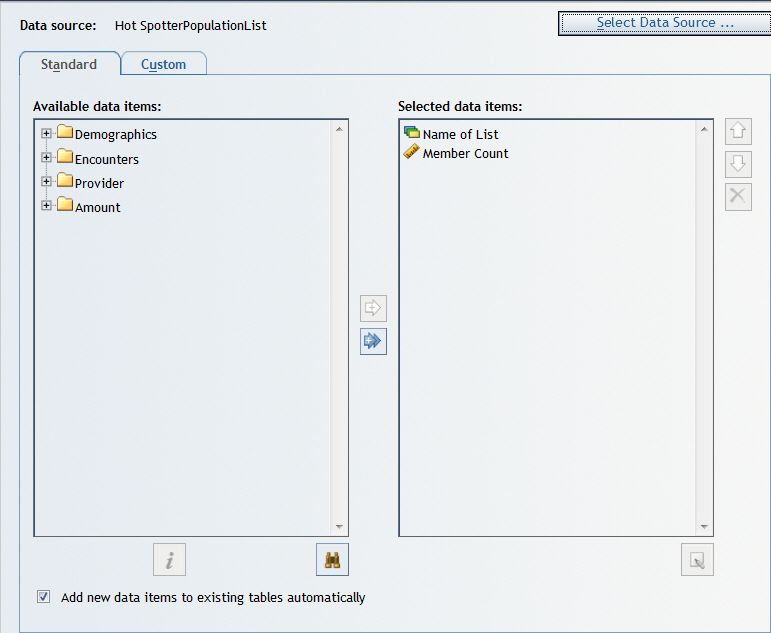
viii Contents

3.3 Querying Warehouse Data with SAS Add-In for Microsoft Office ................................................. 37
3.4 Analytical Tasks with SAS Add-In for Microsoft Office .................................................................. 38
    3.4.1 Generating Monthly Revenues with the Summary Tables Wizard ....................................... 39
    3.4.2 Using the Summary Tables Task ............................................................................................. 40
    3.4.3 Using SAS Add-In for Microsoft Office Graph Task .............................................................. 42
3.5 Customizing the SAS Add-In for Microsoft Office ........................................................................... 44
    3.5.1 Presenting Results in the SAS Add-In for Microsoft Office .................................................. 45
    3.5.2 Scheduling and Sharing in SAS Add-In for Microsoft Office ................................................ 47
3.6 Conclusion ........................................................................................................................................... 49
Chapter 4: Slicing and Dicing Data with OLAP Cubes ........................................ 51
4.1 Introduction ......................................................................................................................................... 51
4.2 OLAP Cube: Concepts and Definitions ............................................................................................. 51
4.3 Building a Cube with SAS OLAP Cube Studio ................................................................................. 52
    4.3.1 Creating a Cube Using the Cube Designer ............................................................................. 52
    4.3.2 Adding Calculated Items to the Cube ..................................................................................... 56
4.4 Using OLAP Cubes with SAS Add-In for Microsoft Office .............................................................. 57
      4.4.1 Essentials of the SAS OLAP Analyzer ..................................................................................... 58
      4.4.2 Adding Measures and Moving Dimensions ............................................................................ 59
      4.4.3 Slicing and Dicing in the SAS OLAP Analyzer ........................................................................ 61
      4.4.4 Filtering and Slicing ................................................................................................................... 62
      4.4.5 Creating Computed Measures ................................................................................................. 66
      4.4.6 Conditional Highlighting ........................................................................................................... 72
      4.4.7 Bookmarking a Customized Cube View ................................................................................. 74
4.5 Conclusion ........................................................................................................................................... 75
Chapter 5: Building a Data Bridge with SAS Information Map Studio .................. 77
5.1 Introduction ......................................................................................................................................... 77
5.2 Navigating SAS Information Map Studio .......................................................................................... 78
5.3 Creating an Information Map ............................................................................................................. 79
      5.3.1 Identifying External Tables ....................................................................................................... 80
      5.3.2 Joining Tables ............................................................................................................................ 80
      5.3.3 Organizing Content in Folders ................................................................................................. 82
      5.3.4 Setting Properties ...................................................................................................................... 83
      5.3.5 Creating Computed Items ........................................................................................................ 84
      5.3.6 Creating Filters .......................................................................................................................... 87
      5.3.7 Revisiting Data Item Properties ............................................................................................... 93
      5.3.8 Features of the Hot Spotters Information Map ...................................................................... 94
5.4 Maintaining and Updating an Information Map ............................................................................... 95
5.5 Creating an Information Map with Prompted Linked Filters .......................................................... 95
5.6 Conclusion ........................................................................................................................................... 98
Chapter 6: Effective Patient Management with SAS Web Report Studio ............. 99
6.1 Introduction ......................................................................................................................................... 99
6.2 Creating Population Lists ................................................................................................................. 100
6.3 Application Architecture .................................................................................................................. 103

Gehring, Renu. SAS Business Intelligence for the Health Care Industry: Practical Applications. Copyright © 2013, SAS Institute Inc.,
Cary, North Carolina, USA. ALL RIGHTS RESERVED. For additional SAS resources, visit support.sas.com/bookstore.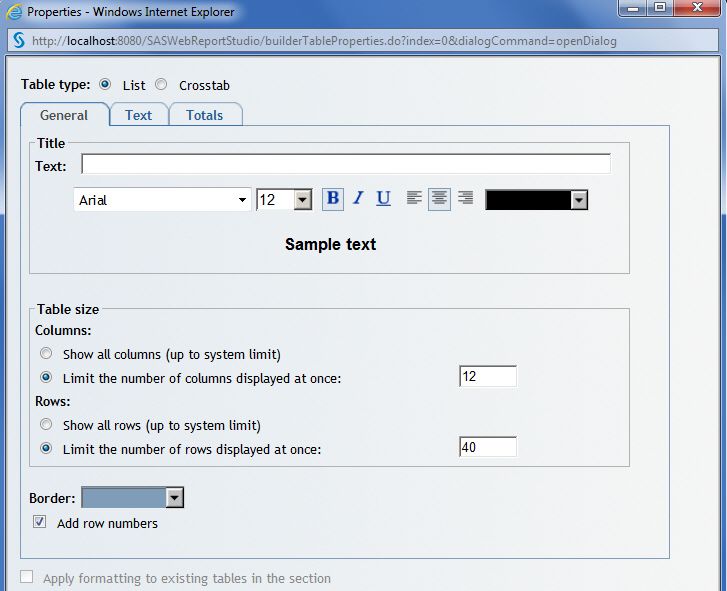
Contents ix

6.4 The Basics of SAS Web Report Studio ........................................................................................... 103
    6.4.1 Accessing SAS Web Report Studio ....................................................................................... 104
      6.4.2 Creating a Summary Report ................................................................................................... 105
      6.4.3 Working with Report Results ................................................................................................. 110
    6.4.4 Saving a Report and Exporting Results ................................................................................ 112
6.5 Creating Prompted Reports ............................................................................................................. 113
    6.5.1 Creating the Population List Report ...................................................................................... 113
    6.5.2 Creating the Member Profile Report ..................................................................................... 116
6.6 Linking Reports ................................................................................................................................. 121
6.7 Conclusion ......................................................................................................................................... 124
6.8 Notes .................................................................................................................................................. 124
Chapter 7: Data Security and Dynamic Updates with SAS Information
           Map Studio ..................................................................................... 125
7.1 Introduction ....................................................................................................................................... 125
7.2 Data Security in an Information Map .............................................................................................. 127
    7.2.1 Restricting Access to Claims Data ........................................................................................ 127
    7.2.2 Restricting Access to Medical Diagnoses ............................................................................ 131
7.3 Dynamic Data Updates ..................................................................................................................... 133
7.4 Scheduling and Distributing a Report in SAS Web Report Studio ............................................... 138
    7.4.1 Distributing Reports Conditionally ........................................................................................ 140
7.5 Conclusion ......................................................................................................................................... 142
Chapter 8: Advanced OLAP Applications in the Health-Care Industry ............... 141
8.1 Introduction ....................................................................................................................................... 141
8.2 Creating a Multipurpose Cube......................................................................................................... 142
    8.2.1 Creating a Star Schema Cube in SAS OLAP Cube Studio .................................................. 142
    8.2.2 Building an OLAP Information Map ....................................................................................... 143
    8.2.3 Creating Multi-Sectioned Reports in SAS Web Report Studio ........................................... 145
8.3 Implementing OLAP Data Security via MDX .................................................................................. 152
      8.3.1 Fundamentals of OLAP Concepts and Terminology ........................................................... 153
      8.3.2 Creating MDX Expressions with SAS Enterprise Guide ...................................................... 155
      8.3.3 Restricting Data Access with MDX ....................................................................................... 159
8.4 Computing Health-Care Metrics in an OLAP Cube ....................................................................... 161
    8.4.1 Data Manipulation ................................................................................................................... 162
      8.4.1 Summary Data Sets ................................................................................................................. 163
      8.4.3 Creating an OLAP Cube from Summary Tables ................................................................... 164
8.5 Conclusion ......................................................................................................................................... 166
Chapter 9: Creating Dashboards for the Health-Care Industry ......................... 169
9.1 Introduction ....................................................................................................................................... 169
9.2 Elements of Effective Dashboards .................................................................................................. 170
9.3 SAS BI Tools for Dashboards .......................................................................................................... 170
9.4 The Executive Dashboard ................................................................................................................ 171
      9.4.1 A First Look: Overall Dashboard Organization ..................................................................... 171
      9.4.2 A Quick Introduction to SAS BI Dashboard .......................................................................... 174
      9.4.3 Creating Indicators .................................................................................................................. 175

Gehring, Renu. SAS Business Intelligence for the Health Care Industry: Practical Applications. Copyright © 2013, SAS Institute Inc.,
Cary, North Carolina, USA. ALL RIGHTS RESERVED. For additional SAS resources, visit support.sas.com/bookstore.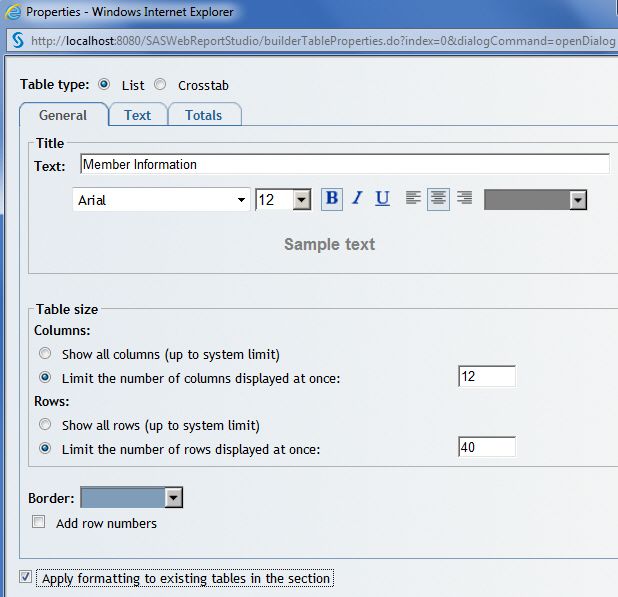
x     Contents

      9.4.4 Linking Indicators for an In-Depth Analysis ......................................................................... 180
    9.4.5 Putting It All Together in a SAS Dashboard .......................................................................... 184
    9.4.6 Placing a Dashboard in SAS Information Delivery Portal ................................................... 186
9.5 The Medical Management Dashboard ............................................................................................ 190
      9.5.1 Overview of the Medical Management Dashboard.............................................................. 190
      9.5.2 Understanding the Medical Management Dashboard’s Indicators ................................... 192
    9.5.2 Using a Stored Process as a Data Source for Indicator Data ............................................ 194
9.6 Conclusion ......................................................................................................................................... 196
Index ............................................................................................................... 197

Gehring, Renu. SAS Business Intelligence for the Health Care Industry: Practical Applications. Copyright © 2013, SAS Institute Inc.,
Cary, North Carolina, USA. ALL RIGHTS RESERVED. For additional SAS resources, visit support.sas.com/bookstore.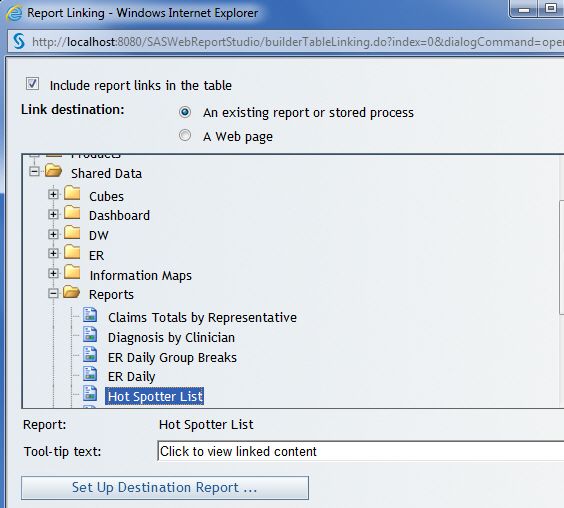
Chapter 6: Effective Patient Management with SAS
           Web Report Studio

6.1 Introduction.........................................................................................................99
6.2 Creating Population Lists ..................................................................................100
6.3 Application Architecture ...................................................................................103
6.4 The Basics of SAS Web Report Studio ...............................................................103
    6.4.1 Accessing SAS Web Report Studio ............................................................................... 104
    6.4.2 Creating a Summary Report .......................................................................................... 105
    6.4.3 Working with Report Results ......................................................................................... 110
    6.4.4 Saving a Report and Exporting Results ........................................................................ 112
6.5 Creating Prompted Reports ...............................................................................113
    6.5.1 Creating a Population List Report ................................................................................. 113
    6.5.2 Creating a Member Profile Report ................................................................................ 117
6.6 Linking Reports .................................................................................................121
6.7 Conclusion ........................................................................................................124
6.8 Notes .................................................................................................................124

6.1 Introduction
     Medical management programs are now common in health insurance companies. They were created in response
     to public outcries to improve health outcomes and to the health insurance companies’ own incentives to contain
     costs. The primary goal of a care management team is to ensure that patients receive appropriate care. The team
     is headed by a physician and includes nurses, pharmacists, and social workers. It performs a variety of
     functions, including coordination of care among multiple providers and social and communal support. If a
     patient needs a wheelchair, it is the job of the care management worker to make sure the patient gets it quickly.
     If a patient needs assistance sorting multiple medications, the care management worker reaches out on the
     phone or in person to help.

     How are patients or population groups selected for care management? Because patient identification is not an
     exact science, several approaches are currently in place in the industry.

          1. Identify patients who seek primary care in the ER. Frequent ER users can be directed to doctors’ offices
             and urgent care centers, which tend to cost less.
          2. Identify patients with multiple complex conditions or a single unmanaged condition. Examples include
             adults with Chronic Obstructive Pulmonary Disease (COPD) and Congestive Heart Failure (CHF) and
             young children with unmanaged asthma.
          3. Identify patients who misuse or overuse opiates and other prescription drugs.

     The care management team at Healthy Living Inc. has identified patients who require further intervention. To
     help these patients, the team requires a sophisticated case management application. Using the information map

Gehring, Renu. SAS Business Intelligence for the Health Care Industry: Practical Applications. Copyright © 2013, SAS Institute Inc.,
Cary, North Carolina, USA. ALL RIGHTS RESERVED. For additional SAS resources, visit support.sas.com/bookstore.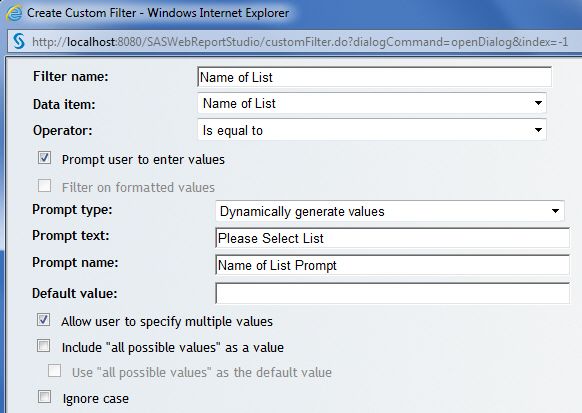
100 SAS Business Intelligence for the Health Care Industry: Practical Applications

     created in Chapter 5 and modified in the next section, SAS programmers in the IT department can build web
     applications that provide complete population and patient profiles.

     In this chapter, you create the Hot Spotters web application, named after a groundbreaking article in The New
     Yorker entitled “The Hot Spotters.1” Setting the industry abuzz, author Atul Gawande used the term “hot
     spotting” to refer to the process of identifying patients who benefit most from intense intervention.

6.2 Creating Population Lists
     In this section, you create a table identifying two groups of frequent ER users. Then, you add the table to the
     information map created in Chapter 5.

          1.   Create two lists of frequent ER users from Encounter. Program 6.1 defines the criterion for being
               selected for Healthy Living Inc.’s medical management program.

     Program 6.1: Identify Frequent ER Users
          *Summarize ED usage by patient;

          proc sql;
           create table HighEDUse as
            select memberid, count(*) as NumVisits, sum(AmtPaid) as Paid
          format=comma10.0
            from DW.Encounter
            where category='ER' and status='Paid' and dos>=intnx('year',today(),-1,'b')
            group by memberid;
          quit;

          *Retain patients with more than 23 ED visits;

          proc sort data=HighEDUse;
            by descending NumVisits;
            where NumVisits>23;
          run;

          *Summarize inpatient stays by patient;

          proc sql;
            create table HighInpatientUse as
            select memberid, count(*) as NumVisits, sum(AmtPaid) as Paid
          format=comma10.0
            from DW.Encounter
            where category='Inpatient' and status='Paid' and
          dos>=intnx('year',today(),-1,'b')
            group by memberid;
          quit;

          *Retain members whose total inpatient costs exceed $150,000;

          proc sort data=HighInpatientUse;
            by descending Paid;
            where paid>150000;
          run;

          *Create a data set containing the two population lists;

          proc sql;
            create table DW.PopulationList as
            select memberid, 'High ED Utilization' as NameofList
            from HighEDUse
            union

Gehring, Renu. SAS Business Intelligence for the Health Care Industry: Practical Applications. Copyright © 2013, SAS Institute Inc.,
Cary, North Carolina, USA. ALL RIGHTS RESERVED. For additional SAS resources, visit support.sas.com/bookstore.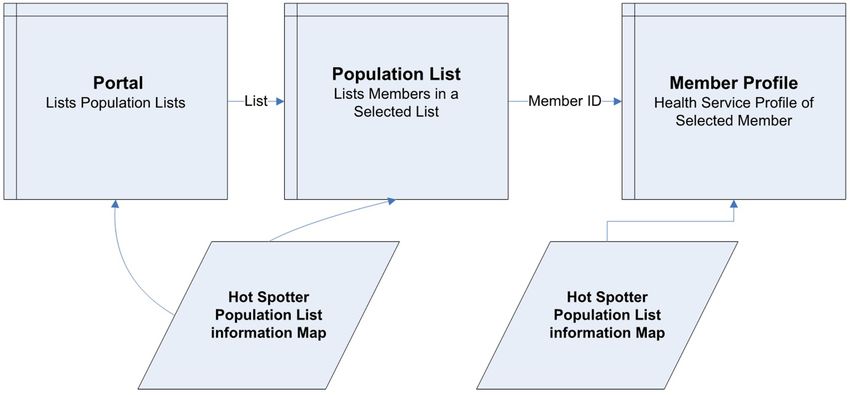
Chapter 6: Effective Patient Management with Web Report Studio 101

            select memberid, 'High Inpatient Cost' as NameofList
            from HighInpatientUse;
          quit;

       The INTNX function is used to advance a date by a certain interval. In the previous code, it decrements the
       current date by one year, and returns a value equal to one year prior to today.

          2. Add POPULATIONLIST to the information map created in Chapter 5. Create an inner join between
             DEMOGRAPHICS and POPULATIONLIST. See section 5.3.2, “Joining Tables,” in Chapter 5 for
             more information.

     Figure 6.1: Specify Relationship between Tables

          3. Require POPULATIONLIST to be used every time the map is accessed. On the Required Tables tab of
             the Information Map Properties dialog box, move POPULATIONLIST to Required tables. See
             section 5.3.6, “Creating Filters,” in Chapter 5 for more information.

     Figure 6.2: Information Map Properties Dialog Box

          4. Add NameofList from POPULATIONLIST to the information map.

Gehring, Renu. SAS Business Intelligence for the Health Care Industry: Practical Applications. Copyright © 2013, SAS Institute Inc.,
Cary, North Carolina, USA. ALL RIGHTS RESERVED. For additional SAS resources, visit support.sas.com/bookstore.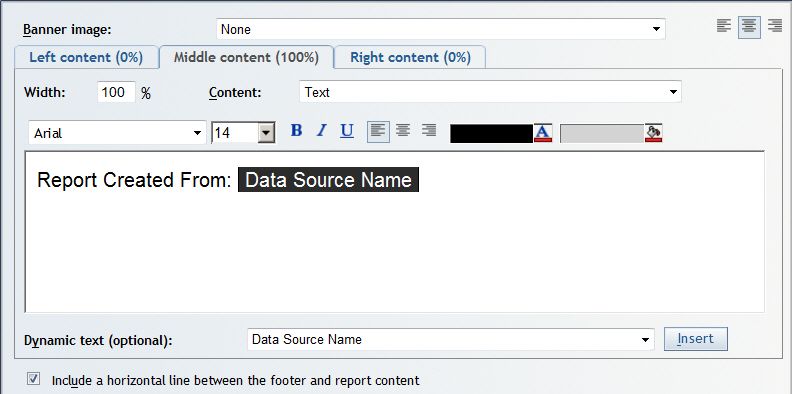
102 SAS Business Intelligence for the Health Care Industry: Practical Applications

     Figure 6.3: Add Data Items to an Information Map

       The asterisk to the left of POPULATIONLIST in Selected Resources denotes that it is a required table.

          5. Change the value-generation method for NameofList so that it can be filtered in SAS Web Report
             Studio. For Value-Generation Method in the Data Item Properties dialog box, Select User selects
             values from a dynamic list. See section 5.3.7, “Revisiting Data Item Properties,” in Chapter 5 for more
             information.

     Figure 6.4: Data Item Properties Dialog Box

       A dynamic list sends a query to retrieve values for a data item each time it is filtered. This adds processing
       time, but ensures complete and updated values.

       A static list can be created and stored in the information map itself, avoiding a query every time the data item
       is filtered. Data items with values that do not change frequently are ideal candidates for a static list.

Gehring, Renu. SAS Business Intelligence for the Health Care Industry: Practical Applications. Copyright © 2013, SAS Institute Inc.,
Cary, North Carolina, USA. ALL RIGHTS RESERVED. For additional SAS resources, visit support.sas.com/bookstore.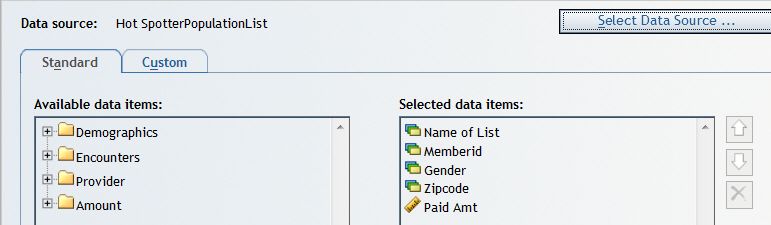
Chapter 6: Effective Patient Management with Web Report Studio 103

6.3 Application Architecture
     Figure 6.5: Hot Spotters Web Application Architecture

     As Figure 6.5 shows, the design of the Hot Spotters web application is simple. It contains three SAS Web
     Report Studio reports that are linked to each other.

          1. Portal is the gateway to the application. It shows the lists of populations being monitored.
          2. Population List returns one row per patient belonging to a list selected by the user in Portal.
          3. Member Profile shows the health service profile of the member selected by the user in Population List.
             The report can be used to profile any member of Healthy Living Inc.

     The first two SAS Web Report Studio reports are sourced from the Hot Spotters POPULATIONLIST map
     created in the last section. Member Profile is sourced from the Hot Spotters information map created in Chapter
     5. The Hot Spotters map includes all members of Healthy Living Inc., giving Member Profile a broader focus.
     The Hot Spotters map is a useful research tool because it can be used to profile any member of Healthy Living
     Inc.

6.4 The Basics of SAS Web Report Studio
     In this section, you create Portal, which serves as the gateway to the Hot Spotters web application.

     As Figure 6.6 shows, a clinician uses Portal to view population lists. The clinician then selects one of the lists to
     focus on a population cohort.

Gehring, Renu. SAS Business Intelligence for the Health Care Industry: Practical Applications. Copyright © 2013, SAS Institute Inc.,
Cary, North Carolina, USA. ALL RIGHTS RESERVED. For additional SAS resources, visit support.sas.com/bookstore.
104 SAS Business Intelligence for the Health Care Industry: Practical Applications
Figure 6.6: Portal Report
6.4.1 Accessing SAS Web Report Studio
SAS Web Report Studio is the primary report writing tool for SAS BI. It is an Internet tool that is accessed by
entering a URL provided by the SAS administrator. Usually, the URL takes the following form:
http://:8080/SASWebReportStudio
Clicking the URL opens a Log On to SAS dialog box, in which the user enters a user name and password. This
enables the SAS Metadata Server to allow only authorized users.
1. Click New report in the Getting Started dialog box to create Portal.
Figure 6.7: Getting Started with SAS Web Report Studio
Users new to SAS Web Report Studio can use the Report Wizard, which gives step-by-step instructions on
creating reports. Experienced SAS Web Report Studio users can create and use report templates, which make
it easy to propagate the same look and feel among reports.
Gehring, Renu. SAS Business Intelligence for the Health Care Industry: Practical Applications. Copyright © 2013, SAS Institute Inc.,
Cary, North Carolina, USA. ALL RIGHTS RESERVED. For additional SAS resources, visit support.sas.com/bookstore.Chapter 6: Effective Patient Management with Web Report Studio 105
6.4.2 Creating a Summary Report
SAS Web Report Studio has a simple, intuitive interface as shown in Figure 6.8 and explained in Table 6.1.
Figure 6.8: Basics of SAS Web Report Studio
Table 6.1: Basics of SAS Web Report Studio
1 This area is called the reporting slate. It contains one or more report objects whose icons are located
directly above it. The icons can be dragged and dropped onto the reporting slate for a combination of list
reports, crosstabular reports, and graphs.
2 Reports are created and modified on the Edit tab. They are viewed on the View tab.
3 The menu bar contains drop-down menu options such as File, Edit, and View. The active tab determines
the functionality of the drop-down menu options. The Edit menu provides greater functionality than the
View menu.
4 The Table of Contents enables users to toggle between report sections.
5 Section Data shows columns in each report section. This is one of the ways to change the appearance of
a column. For example, a numeric column can be formatted to display as currency.
SAS Web Report Studio’s ability to create multi-sectioned reports is especially pertinent to the health-care
industry. A health insurance company with different plans for its Medicaid, Medicare, and commercial
populations can use the same template for reporting on each of these plans, and it can view the reports
separately. In addition, hospitals can report on inpatient and outpatient services differently.
1. Drag and drop the list report icon onto the reporting slate.
2. A yellow caution sign appears. This is SAS Web Report Studio’s generic report error message that, in
this case, indicates that there is no data for the report.
3. To specify a data source, select Select Data from the Data menu.
a. Click Select Data Source, and navigate to the Hot Spotters POPULATIONLIST information
map.
Gehring, Renu. SAS Business Intelligence for the Health Care Industry: Practical Applications. Copyright © 2013, SAS Institute Inc.,
Cary, North Carolina, USA. ALL RIGHTS RESERVED. For additional SAS resources, visit support.sas.com/bookstore.106 SAS Business Intelligence for the Health Care Industry: Practical Applications
b. Move relevant columns from Available data items to Selected data items.
Figure 6.9: Select Data for Report
c. SAS Web Report Studio allows two types of columns—category and numeric. Because
NameofList is a character variable, it is classified as a category column. MemberCount is a
numeric column.
In SAS Web Report Studio, the following icons can be helpful:
Provides information about each column.
Finds columns. This is useful if your source data contains a large number of columns.
Renames columns.
When selected, the Add new data items to existing tables automatically check box allows new variables to
be added to all report objects automatically. This is more of a hindrance than a help. Consider a complex
report with several report objects with different columns. If you want to add one more column to a single
report object, but have forgotten to deselect the check box, the new column is added to all report objects.
Gehring, Renu. SAS Business Intelligence for the Health Care Industry: Practical Applications. Copyright © 2013, SAS Institute Inc.,
Cary, North Carolina, USA. ALL RIGHTS RESERVED. For additional SAS resources, visit support.sas.com/bookstore.Chapter 6: Effective Patient Management with Web Report Studio 107
4. Add a header and footer.
a. Click Header in the reporting slate.
b. Enter a title for the report. Images can be inserted using the Banner image menu if they have been
uploaded by a SAS administrator.
Figure 6.10: Generate a Header
To use an image in SAS Web Report Studio, launch SAS Management Console as an unrestricted user.
1. From the Folders tab, navigate to SAS Folders → System → Applications → SAS Web Report Studio
→ Common → BannerImages.
2. Right-click BannerImages, and select Add Content from External Files or Directories.
3. Add images.
4. Restart the web container application (JBoss, WebSphere, or WebLogic) for the images to become
available.
c. Click Footer in the reporting slate.
d. Enter a footnote, inserting Data Source Name from the Dynamic text (optional) field as shown
in Figure 6.11. Dynamic text fields are comparable to system-supplied macro variables.
Gehring, Renu. SAS Business Intelligence for the Health Care Industry: Practical Applications. Copyright © 2013, SAS Institute Inc.,
Cary, North Carolina, USA. ALL RIGHTS RESERVED. For additional SAS resources, visit support.sas.com/bookstore.108 SAS Business Intelligence for the Health Care Industry: Practical Applications
Figure 6.11: Create a Footer
5. To modify column formats, right-click Member Count in Section Data and select Format.
Figure 6.12: Modify Formats
6. To customize a report object’s appearance, right-click on the report object on the Edit tab, and select
Properties.
a. The General, Text, and Totals tabs enable you to customize a report.
Gehring, Renu. SAS Business Intelligence for the Health Care Industry: Practical Applications. Copyright © 2013, SAS Institute Inc.,
Cary, North Carolina, USA. ALL RIGHTS RESERVED. For additional SAS resources, visit support.sas.com/bookstore.Chapter 6: Effective Patient Management with Web Report Studio 109
Figure 6.13: Customize Report Appearance
To extend the appearance of one report object to all other report objects in a section, select the Apply
formatting to existing tables in the section check box on the General tab of the Properties dialog box. If
there is only one report object, then this check box is grayed out. This check box is useful for a report
containing several tables. Perfect one table, and then extend its look to the remaining tables in the report with
a single click.
7. Click on the View tab to see the results. Portal presents member counts by population list.
Gehring, Renu. SAS Business Intelligence for the Health Care Industry: Practical Applications. Copyright © 2013, SAS Institute Inc.,
Cary, North Carolina, USA. ALL RIGHTS RESERVED. For additional SAS resources, visit support.sas.com/bookstore.110 SAS Business Intelligence for the Health Care Industry: Practical Applications
Figure 6.14: Portal Report
Because Portal does not have any filters, the line Applied filters can be removed by deselecting Applied
Filters from the View menu on the Edit tab.
6.4.3 Working with Report Results
SAS Web Report Studio enables you to work with report results in various ways. Columns can be sorted or
rearranged. Totals can be added. Report styles can be changed.
1. To sort by Name of List, click on the text of the column name. This displays a menu as shown in
Figure 6.15.
Figure 6.15: Work with a Single Column in a Report
2. To sort by multiple columns, right-click anywhere in the report except on the text of a column name.
a. Select Sort Priority as shown in Figure 6.16.
Gehring, Renu. SAS Business Intelligence for the Health Care Industry: Practical Applications. Copyright © 2013, SAS Institute Inc.,
Cary, North Carolina, USA. ALL RIGHTS RESERVED. For additional SAS resources, visit support.sas.com/bookstore.Chapter 6: Effective Patient Management with Web Report Studio 111
Figure 6.16: Work with Report Results
b. Specify a sorting hierarchy.
Figure 6.17: Sort Columns
3. To add column totals, select Total, and then check Totals.
SAS Web Report Studio enables the conditional highlighting of data and calculates column-based and row-
based subtotals and totals.
In addition, you can filter report results on the basis of a column’s values or rank. As health-care cost data
tends to be top-heavy (for example, a minority of patients makes up the majority of the costs), the ability to
rank data is useful.
4. Click the View tab to confirm that Portal is sorted and contains a total.
Gehring, Renu. SAS Business Intelligence for the Health Care Industry: Practical Applications. Copyright © 2013, SAS Institute Inc.,
Cary, North Carolina, USA. ALL RIGHTS RESERVED. For additional SAS resources, visit support.sas.com/bookstore.112 SAS Business Intelligence for the Health Care Industry: Practical Applications
Figure 6.18: Portal Report
The addition of cost and utilization measures makes this report more meaningful. These measures can be
further broken out by category such as inpatient, outpatient, pharmacy, primary care, and specialist care
services. Clinical condition markers can be informative. You might want to know what percentage of each
population has asthma or COPD. Similarly, you might benefit from demographic data, such as age and sex
distributions.
6.4.4 Saving a Report and Exporting Results
Saving a Report
SAS Web Report Studio offers three ways to save a report.
1. Data is automatically refreshed runs the query underlying the report every time the report is
accessed. This makes the data in the report dynamic and up-to-date. However, reports accessing a large
quantity of data might take longer to process.
2. Data can be manually refreshed saves a snapshot of the report. You have the option of manually
running the report for the most recent data.
3. Template saves the report as a template without any reference to the data. This is a useful shortcut for
propagating reporting standards.
Exporting Results
Results from SAS Web Report Studio can be exported to other applications (such as Excel and Word) and to
text files. There are two ways of exporting.
1. The first method is to select Export from the File menu. This method creates a ZIP file, which
involves a cumbersome extraction process.
2. The most direct method to export to Excel or Word is to click on a report object, and then select
Export Table. This method enables users to choose variables and rows to export. Only the data
portion of the current report object is exported, not the HTML graphics.
Gehring, Renu. SAS Business Intelligence for the Health Care Industry: Practical Applications. Copyright © 2013, SAS Institute Inc.,
Cary, North Carolina, USA. ALL RIGHTS RESERVED. For additional SAS resources, visit support.sas.com/bookstore.Chapter 6: Effective Patient Management with Web Report Studio 113
Figure 6.19: Export Report Results
6.5 Creating Prompted Reports
In this section, you create Population List and Member Profile, the two remaining reports of the Hot Spotters
web application. These are prompted reports because they present the user with prompts, and then run based on
information the user enters.
6.5.1 Creating the Population List Report
1. Repeat steps 1 and 2 from section 6.4.2, “Creating a Summary Report.”
2. Add data items to Selected data items.
Figure 6.20: Select Data for Report
3. Select Summarization Options from the Data menu to control how Paid Amt is aggregated.
a. Select Summarize similar rows (Aggregated data) to aggregate Paid Amt by member. This is
shown in Figure 6.21.
Gehring, Renu. SAS Business Intelligence for the Health Care Industry: Practical Applications. Copyright © 2013, SAS Institute Inc.,
Cary, North Carolina, USA. ALL RIGHTS RESERVED. For additional SAS resources, visit support.sas.com/bookstore.114 SAS Business Intelligence for the Health Care Industry: Practical Applications
Figure 6.21: Data Summarization Options in SAS Web Report Studio
4. Click the View tab to view results.
Figure 6.22: Population List Report
As with Portal, the addition of cost and utilization measures makes the Population List report more
meaningful. A synopsis of clinical conditions and risk scores might be informative. You might want to know
what percentage of each population has asthma or COPD.
5. Build a prompted filter for Name of List.
a. Select Section Filters from the Data menu on the Edit tab.
b. Apply predefined filters consists of filters defined in the source map. Because the Name of List
filter does not exist in the information map, click New to create a custom filter.
Gehring, Renu. SAS Business Intelligence for the Health Care Industry: Practical Applications. Copyright © 2013, SAS Institute Inc.,
Cary, North Carolina, USA. ALL RIGHTS RESERVED. For additional SAS resources, visit support.sas.com/bookstore.Chapter 6: Effective Patient Management with Web Report Studio 115
Figure 6.23: Create Custom Filters in SAS Web Report Studio
A prompted filter is different from a filter on report results. A prompted filter subsets data before a report
processes. A filter on report results limits results that have already been retrieved. Although both filters
achieve the same objective, a report with a preprocessing filter is more efficient than one with a post-
processing filter. Prompted filters are especially relevant to BI application development within the data-heavy
health-care industry.
SAS programmers might benefit from the following analogy. A report with a prompted filter operates like a
WHERE statement in a SAS DATA step. The data subset is done before results are retrieved. A report with a
filter on report results operates like an IF statement in a SAS DATA step. The data subset is done after the
results are retrieved.
An information map with several well-thought-out prompted filters can feed a multitude of SAS Web Report
Studio reports. Build filters once, and then use them repeatedly in different reports to maximize the
efficiencies from maps. Filters in information maps decrease web application maintenance time and promote
design simplicity.
c. Enter values as shown in Figure 6.24 and explained in Table 6.2.
Gehring, Renu. SAS Business Intelligence for the Health Care Industry: Practical Applications. Copyright © 2013, SAS Institute Inc.,
Cary, North Carolina, USA. ALL RIGHTS RESERVED. For additional SAS resources, visit support.sas.com/bookstore.116 SAS Business Intelligence for the Health Care Industry: Practical Applications
Figure 6.24: Create Prompted Filters in SAS Web Report Studio
Table 6.2: Create a Prompted Filter in SAS Web Report Studio
Filter name Enter the name of the filter.
Prompt user to enter values Select this check box to create a prompted filter.
Prompt type Select Dynamically generate values.
Prompt text Enter the text with which the user is prompted.
Allow user to specify multiple values Select this check box to allow the user to select multiple values.
d. Select the Name of List filter, which appears in Apply custom filters.
Gehring, Renu. SAS Business Intelligence for the Health Care Industry: Practical Applications. Copyright © 2013, SAS Institute Inc.,
Cary, North Carolina, USA. ALL RIGHTS RESERVED. For additional SAS resources, visit support.sas.com/bookstore.Chapter 6: Effective Patient Management with Web Report Studio 117
Figure 6.25: Custom Filters in SAS Web Report Studio
6. Click the View tab to test the report.
Figure 6.26: Prompted SAS Web Report Studio Report
6.5.2 Creating the Member Profile Report
Member Profile, the third report in the Hot Spotters web application, displays a member’s complete
demographic, utilization, and cost information for the past year.
Member Profile is sourced from the Hot Spotters information map, which includes all members. As a result, the
Member Profile report can be used for any member of Healthy Living Inc.
Gehring, Renu. SAS Business Intelligence for the Health Care Industry: Practical Applications. Copyright © 2013, SAS Institute Inc.,
Cary, North Carolina, USA. ALL RIGHTS RESERVED. For additional SAS resources, visit support.sas.com/bookstore.118 SAS Business Intelligence for the Health Care Industry: Practical Applications
You should take some time to consider the function and usefulness of Member Profile. A user enters the
patient’s ID and instantly receives a comprehensive patient profile. Because the report is web based, it is
available on demand. It compiles demographic, utilization, and cost information. It is a quick way for a
clinician or analyst to gather the most relevant facts about a patient. Data volume is not a concern because the
report retrieves data for one patient at a time. Many departments at Healthy Living Inc. benefit from this
useful research tool.
1. Repeat steps 1 and 2 from section 6.4.2, “Creating a Summary Report.”
2. Add all of the data items from the information map to Selected data items.
3. Create three list reports as shown in Figure 6.27.
a. Drag and drop the list report object onto the reporting slate.
b. Click to add a new row to the reporting slate.
c. Repeat steps a and b to create three list reports.
Figure 6.27: Create Member Profile Report
Gehring, Renu. SAS Business Intelligence for the Health Care Industry: Practical Applications. Copyright © 2013, SAS Institute Inc.,
Cary, North Carolina, USA. ALL RIGHTS RESERVED. For additional SAS resources, visit support.sas.com/bookstore.Chapter 6: Effective Patient Management with Web Report Studio 119
4. Member Information shows a patient’s demographic information. To hide columns not related to
demographic data, right-click on the report object, select Assign Data, and move columns to Hidden.
5. ER Visits shows a patient’s ER experiences over the past year. Create a filter so that the report only
shows ER visits.
a. To create a filter, right-click on the report object, and select Filter and Rank.
b. Click Get Values, and select ER as shown in Figure 6.28.
Figure 6.28: Set Up Report Filters
6. Inpatient Discharges shows a patient’s hospitalizations over the past year. Repeat step 5 to show only
inpatient data.
7. Add the MemberID prompt from the information map.
a. Select Section Filters from the Data menu on the Edit tab.
b. Select the MemberId prompt from Apply predefined filters.
Figure 6.29: Use Predefined Filters
8. Right-click on any report object on the Edit tab, and select Properties. The Properties dialog box is
shown in Figure 6.30.
a. Click through the General, Text, and Totals tabs and customize the report as needed.
b. To give the three reports a consistent look, select Apply formatting to existing tables in the
section.
Gehring, Renu. SAS Business Intelligence for the Health Care Industry: Practical Applications. Copyright © 2013, SAS Institute Inc.,
Cary, North Carolina, USA. ALL RIGHTS RESERVED. For additional SAS resources, visit support.sas.com/bookstore.120 SAS Business Intelligence for the Health Care Industry: Practical Applications
Figure 6.30: Customize Multiple Report Objects
c. Click the View tab to view Member Profile. Enter a MemberID, and then click View Report.
Figure 6.31: MemberID Prompt
Gehring, Renu. SAS Business Intelligence for the Health Care Industry: Practical Applications. Copyright © 2013, SAS Institute Inc.,
Cary, North Carolina, USA. ALL RIGHTS RESERVED. For additional SAS resources, visit support.sas.com/bookstore.Chapter 6: Effective Patient Management with Web Report Studio 121
d. The Member Profile report is shown in Figure 6.32.
Figure 6.32: Member Profile Report
The design of the Member Profile report is simple, yet extremely powerful. Several tabular reports, each
listing medical utilization, are stacked under an overall patient profile table. Each report shows only relevant
columns. For example, the overall patient profile report shows patient demographic data. Medical utilization
reports subset utilization by type.
The Member Profile report includes only ER and inpatient utilization because it is based on test data. In a real-
world implementation, the report would include other types of medical utilization, such as primary care visits,
specialty physician visits, outpatient hospital visits, and pharmacy use. Together with the patient demographic
report, the various medical utilization reports offer a comprehensive overall view of the patient.
6.6 Linking Reports
The previous two sections created three reports comprising the Hot Spotters web application. This section ties
the reports together so that you can effortlessly navigate from one report to another.
The process of connecting reports together in SAS Web Report Studio is called report linking. It requires two
reports, with at least one having a prompted filter.
SAS Web Report Studio also allows users to link reports without prompts. Reports can be linked to a web
page as well.
To create the Hot Spotters web application, link the Portal and the Population List reports via NameofList.
Then, link Population List to Member Profile via MemberID.
Gehring, Renu. SAS Business Intelligence for the Health Care Industry: Practical Applications. Copyright © 2013, SAS Institute Inc.,
Cary, North Carolina, USA. ALL RIGHTS RESERVED. For additional SAS resources, visit support.sas.com/bookstore.122 SAS Business Intelligence for the Health Care Industry: Practical Applications
1. On the Edit tab, right-click Portal, and select Report Linking.
2. Create links as shown in Figure 6.33.
a. In the Report Linking dialog box, select Include report links in the table. This creates web
links in the report rows, enabling users to navigate from one report to the other.
b. Select An existing report or stored process.
c. Navigate within SAS Folders to Hot Spotter List.
d. Click Set Up Destination Report to specify the linking value.
Figure 6.33: Report Linking
e. In the Set Up Destination Report dialog box, select Name of List. This is the prompt that
receives the clicked value.
Gehring, Renu. SAS Business Intelligence for the Health Care Industry: Practical Applications. Copyright © 2013, SAS Institute Inc.,
Cary, North Carolina, USA. ALL RIGHTS RESERVED. For additional SAS resources, visit support.sas.com/bookstore.Chapter 6: Effective Patient Management with Web Report Studio 123
Figure 6.34: Set Up Prompt
3. Portal contains links in its data rows. Click on a link to navigate to Hot Spotter List.
Figure 6.35: Linked Reports
A report can be linked via a single parameter only. This is a limitation of SAS Web Report Studio. However,
stored processes can be linked to a multi-prompted web report.
Gehring, Renu. SAS Business Intelligence for the Health Care Industry: Practical Applications. Copyright © 2013, SAS Institute Inc.,
Cary, North Carolina, USA. ALL RIGHTS RESERVED. For additional SAS resources, visit support.sas.com/bookstore.124 SAS Business Intelligence for the Health Care Industry: Practical Applications
4. The two reports are now linked. It is easy to navigate from one report to another. To navigate back to
Portal, click (located at the top of the page.
Using the back button in the browser can return an error.
5. Repeat steps 1 through 3 to link Population List to Member Profile via MemberID.
A clinician from Healthy Living Inc. logs in to SAS Web Report Studio, views Portal, and navigates effortlessly
between population groups, patient lists, and patients of interest. The clinician uses Member Profile as part of
hot spotting or she uses it as an independent research tool.
6.7 Conclusion
In this chapter, you created three reports in SAS Web Report Studio and connected them to each other to deliver
a powerful and effective web application named Hot Spotters. The design was simple, yet extremely effective.
You built reports with prompted filters, which were then used to pass information from one report to another.
Consider additional enhancements that would be useful in a real-world application:
1. Member Profile can be further linked to an encounter-level report. This would provide the clinician
with a detailed look into each encounter. Similar to Member Profile, the encounter-level report could
be used independently.
2. Report linking does not always need to progress from summary data to detail data. For example, you
can link Member Profile to a provider report and connect the two with a provider name.
3. Most insurance companies work with claims data, which includes lagged transactions but does not
include recent medical encounters. To fill this gap, hospitals routinely send census data on a daily or
hourly basis to insurance companies. Recent encounters can be incorporated with Member Profile,
making the report a more useful tool for clinicians.
6.8 Notes
1. Gawande, A. 2011. “The Hot Spotters.” The New Yorker. Available at
http://www.newyorker.com/reporting/2011/01/24/110124fa_fact_gawande.
Gehring, Renu. SAS Business Intelligence for the Health Care Industry: Practical Applications. Copyright © 2013, SAS Institute Inc.,
Cary, North Carolina, USA. ALL RIGHTS RESERVED. For additional SAS resources, visit support.sas.com/bookstore.About The Author
Renu Gehring is a SAS instructor and consultant. She is also an analyst at the
health insurance company, CareOregon, Inc. A SAS user since 1993, she holds the
following certifications for SAS 9: SAS Certified Base Programmer, SAS Certified
Advanced Programmer, SAS BI Content Developer, and SAS Certified Platform
Administrator.
Renu is passionate about teaching SAS technologies to transform business
processes. Her expertise is in combining the power of SAS programming and SAS
Business Intelligence to build effective and actionable SAS applications. She has an
undergraduate degree in History and Economics from Mount Holyoke College and a
graduate degree in Economics from Brown University.
Learn more about this author by visiting her author page at
support.sas.com/gehring. There you can download free chapters, access example
code and data, read the latest reviews, get updates, and more. .
Gehring, Renu. SAS Business Intelligence for the Health Care Industry: Practical Applications. Copyright © 2013, SAS Institute Inc.,
Cary, North Carolina, USA. ALL RIGHTS RESERVED. For additional SAS resources, visit support.sas.com/bookstore.Gain Greater Insight into Your
SAS Software with SAS Books.
®
Discover all that you need on your journey to knowledge and empowerment.
support.sas.com/bookstore
for additional books and resources.
SAS and all other SAS Institute Inc. product or service names are registered trademarks or trademarks of SAS Institute Inc. in the USA and other countries. ® indicates USA registration. Other brand and product names are
trademarks of their respective companies. © 2013 SAS Institute Inc. All rights reserved. S107969US.0613You can also read