The omnichannel customer service gap - November 2013
←
→
Page content transcription
If your browser does not render page correctly, please read the page content below
The omnichannel customer service gap
November 2013
The omnichannel customer service gap – November 2013

Executive Summary
The rapid growth of digital over the past ten years has created an environment where consumers are
more in control and brand savvy than ever. The future is omnichannel, where providing a seamless
and consistent brand experience regardless of the technology or method of communication
consumers choose to use is critical to customer engagement and competitive success.

Many brands are now focusing their attention on developing omnichannel sales strategies, which
from a customer perspective only represents part of their brand journey. Customer service is a key
part of the brand experience and can ultimately make or break a customer relationship. The number
of customer service channels, including virtual agents, screen sharing, SMS, social media, and click-
to-chat, has created unprecedented choice from a brand and customer perspective but creates
significant challenges in terms of providing a truly integrated brand experience.

Zendesk, a leading provider of customer service solutions, commissioned Loudhouse to explore Figure A: Research Sample
customer service attitudes and behaviours amongst 7,000 consumers in seven countries (see Figure
A), to identify trends and help develop omnichannel strategies moving forward.

The research finds that consumers perceive brands to be putting more effort into creating a seamless
and consistent customer experience for sales than they do for customer service. Furthermore, as
expectations for customer service continue to evolve, brands are found to be struggling to keep up
and customers are falling back on using the phone as their primary contact method if response and
resolution times prove to be unsatisfactory. The younger the customer, the more likely they are to
complain and the more demanding they are of brands to deliver real-time and self-service support
options. Finally, getting customer service right creates a virtuous circle; happy customers spend more
and are valuable brand ambassadors and repeat customers, in turn giving a better return on the
investment required.

                                                                                                         Research Methodology
                                                                                                         7,000 online shoppers were surveyed during August 2013. Research was conducted by
                                                                                                         Loudhouse, an independent research agency based in London.

                                                                                                                                                                                             2
The omnichannel customer service gap – November 2013
Key findings from the research include:
The omnichannel customer service gap
• Two thirds (67%) of online shoppers have made purchases in the past six months that have
involved multiple channels
• 73% think brands pay more attention to generating sales across multiple channels than
they do to providing an integrated customer service experience
• 69% believe expectations for customer service are increasing year-on-year
• 37% now expect to be able to contact the same customer service representative regardless
of which channel they use and 47% expect to be able to return goods / purchases through
a different channel than the purchase channel
• Just 7% are extremely satisfied that brands provide a seamless, integrated, and consistent
customer service experience across channels
Customer service behaviours
• Shoppers fall into three categories – 23% are less tolerant of problems with products /
services than others, whilst 60% have an average level of tolerance and 17% are more
tolerant of problems with products / services than others
• In the past six months, consumers have tried to resolve a query by calling customer
services (54%), emailing customer services (48%), using online self-service portals (27%)
or going in store (26%)
• More than half (53%) think it is important for them to resolve their own product / service
problems rather than rely on customer service representatives – this rises to 60% amongst
those aged between 18 and 34, falling to 44% amongst those aged 55-64
Fallback to “failsafe” phone
• Speed of response (89%), speed of resolution (89%), and friendliness of representative
(82%) are seen as the most important aspects of the customer service experience,
regardless of channel
• Resolution expectations vary by channel – 59% expect resolution within 30 minutes when
contacting customer services by phone, 52% expect to get resolution within a day via social
media, and 75% expect resolution within a day via email
• When an email goes unanswered, 71% would then call; when social media goes
unanswered, 55% would then call; and when the phone goes unanswered, 54% would try
to call again
• Only 52% rate speed of response as good or excellent, with similar ratings for speed of
3The omnichannel customer service gap – November 2013
resolution (51%)
• 45% say they will try any channel open to them and wait as long as it takes to get their
query resolved
Moving forwards – joined up customer services
• 64% expect to receive real-time assistance regardless of the customer service channel they
use
• 78% say a company’s reputation for customer service is important to them when choosing
to buy from a particular brand
• 75% of respondents would return to a company with excellent service and 56% would
recommend it to family and friends
• 33% will spend more with a brand if they receive excellent customer service
• 87% think brands need to work harder to create a seamless experience for customers
The research finds that the use of phone-based customer service is not decreasing, even as use of
text-based and social channels has increased. In part, this is due to growing frustrations with brands
in terms of their response times with alternative channels and the disjointed customer experience that
consumers now often face. Retailers may still be finding their feet in developing omnichannel
strategies. However, a focus predominantly on securing sales across multiple channels whilst
overlooking the customer service element will only serve to erode reputations and revenues in the
long term.
4The omnichannel customer service gap – November 2013
The omnichannel customer service gap
Figure 1: % making purchases that involve multiple channels in the
Where once a consumer went to the high street, found what they were looking for and paid for it there last six months
and then, occasionally visiting more than one shop to compare prices for big ticket items, today that
same consumer is likely to use several different channels – perhaps visit a shop, go online, look at
catalogues, and pick up a phone to talk to someone in a call centre – before making the purchase.
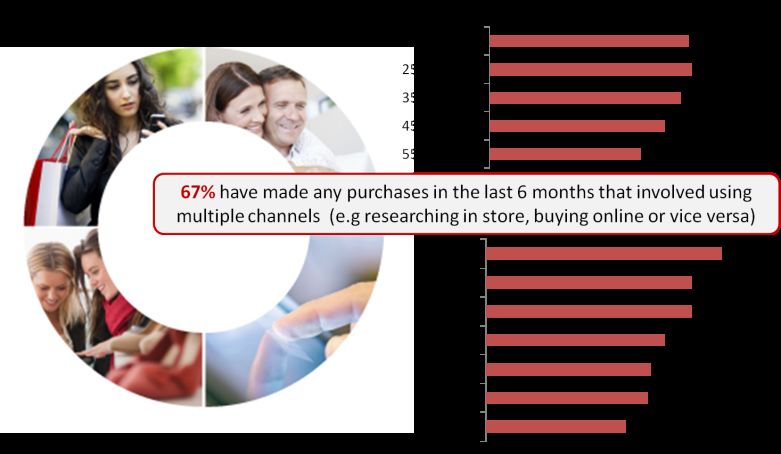
Indeed, Figure 1 shows that two-thirds (67%) of online shoppers made a purchase in the past six
months that involved multiple channels.
But it appears that efforts to clinch a sale are not matched by efforts to keep the customer happy as
73% of shoppers believe brands pay more attention to generating sales across multiple channels
than they do to providing a seamless customer service (see Figure 2). As such, nearly nine out of ten
(87%) say brands need to work harder to create a seamless experience for customers.
The challenge for brands is that 69% of respondents believe expectations for customer service are
increasing year on year (see Figure 2), which suggests they will need to devote more effort and more
resources to improving customer service if they are not to see their reputation and even their bottom
line damaged. Indeed, the research showed big increases in the numbers of people expecting to use
each method of resolution in the coming twelve months. Those prepared to go in-store nearly
doubled to 49%, while the number prepared to call or email customers services rose to 69% and 62% Figure 2: Attitudes to customer service
respectively.
Worryingly, however, only 7% of consumers say they are extremely satisfied with a seamless,
integrated, and consistent service across all channels. Disconnected service channels may have
once been an inconvenience for shoppers, but both the increase in expectation and use of customer
services has made the issues unavoidable. Over a third (37%) expect to be able to contact the same
customer service representative regardless of which channel they use, with a further half (47%)
expecting to be able to return goods or purchases through a different channel than the one
purchased from. After making a purchase online, resources must therefore be in place to support the
after sale across all channels.
5The omnichannel customer service gap – November 2013
Customer service behaviours
Figure 3: Likelihood to contact customer services relative to others
Use of customer services varies significantly by industry sector. Amongst customers who have used
the relevant provider, over half contact online retailers (54%); banks, insurance, and other financial Less
likely
– I
am
More
likely
– I
am
service providers (53%); and in-store retailers (51%) with customer service issues. typically
less
typically
more
tolerant
of
tolerant
of
problems
with
problems
with
When it comes to their propensity to complain or raise issues with brands, the research found that products
/
services
products
/
services
than
others
shoppers fall into three distinct categories – 23% are less tolerant of problems with products / than
others
23% 17%
services than others, whilst 60% have an average level of tolerance and 17% are more tolerant of
problems with products / services than others (see Figure 3).
The Japanese are the most tolerant nation, with only 8% falling into the impatient category and 45%
classed at tolerant, while the Brazilians are the least patient with two in every five (40%) multichannel
shoppers classified as impatient and only 8% as tolerant.
About
average
60%
When a customer does have a problem, they will use a number of methods of resolution including a
phone call to customer services, email, online self-service portals, and visiting the store. In the past
six months, the most popular method was to put a call into customer services (54%), followed by Figure 4: Customer service channel use in the last six months
emailing customer services (48%), and using online self-service portals (27%) (see Figure 4). One in
four (26%) go directly to the store to resolve a problem.
However, in their quest to resolve an issues as soon as possible, over half (53%) think that it is
important for them to resolve their own product problems rather than rely on customer service
representatives. Whilst only 44% of 55-64 year olds think it is important to resolve their own
problems, this jumps to 60% amongst the less patient 18-34 year olds. Chiming with their impatient
nature, the Brazilians are the most likely to want to retain ownership of the problem resolution
process, with 65% preferring to resolve their own issues rather than leave it to a customer service
representative.
6The omnichannel customer service gap – November 2013
Fall back to “failsafe” phone Figure 5: Customer service response time expectations and
cross-channel behaviour
Brands are keen to invest in all channels in order to secure sales and grow. But from a customer
perspective, the sale is only part of their brand journey. Good customer service is key to securing
their return and goodwill, with speed of response (89%) and resolution (89%) ranking the most
important aspects of the customer service experience along with having a friendly representative
(82%).
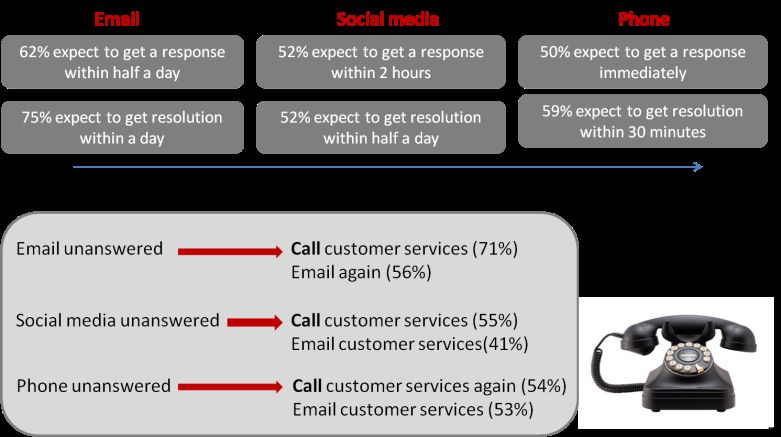
Interestingly, consumers have very different expectations for resolution from the different customer
service channels (see Figure 5). For example, they believe the phone will achieve the quickest result,
with nearly three in five (59%) expecting resolution within 30 minutes, while only half (52%) expect
social media to bring a result within a day. This explains why the phone remains the most popular
service channel, with 54% using it for their first contact, despite the proliferation of service channels.
Indeed, when an email is unanswered, 71% will then phone; when social media is unanswered, 55%
will then phone, and if the phone is unanswered, 54% will try to call again.
Critically, however, there is a huge gap between expectation and delivery, with only half of
respondents believing that brands are “good” or “excellent” when it comes to speed of response Figure 6: Satisfaction with brands on customer service performance
(52%) and resolution (51%)(see Figure 6). Under half (48%) are satisfied that companies use a
logical and effective process when solving their problems, something that becomes even more
important when multiple channels are involved.
When it comes to getting a response, the French are the least patient, with 73% expecting resolution
within 30 minutes. The Japanese are the most patient, with 50% expecting resolution within 30
minutes. However, the Brazilians are the most persistent, with 62% saying they will try any channel
and wait as long as it takes to resolve the query. Only 24% of Japanese will take this approach.
Perseverance is strong amongst shoppers and is something that varies by age. Nearly half (45%) say
they will try any channel open to them and wait as long as it takes to get their query resolved. In
terms of age groups, the older the consumer, the more patience they have. Of those aged 18-24,
41% say they are more likely to be persistent, against 48% of 55-64 year olds.
7The omnichannel customer service gap – November 2013
Moving forward – joined up customer services Figure 7: Customer service expectations
Given the impatient nature of the omnichannel shopper, it is clear that customers want instant
service. According to the research, 64% of respondents expect real-time assistance regardless of
which service channel they use (see Figure 7), with 73% of the French expecting it, 70% of
Brazilians, but only 45% of Japanese.
Although brands are increasingly investing in an omnichannel approach to customers, they risk
wasting that investment if they don’t get the service levels right across all service channels. Indeed,
brands who forgo after-sale support in place of immediate sales may be doing more harm than they
think. Three quarters (78%) say a company’s reputation for service matters when they are choosing
to buy products or services, and a third (36%) will tell family and friends when they have a poor
experience, while just over one in ten (12%) will use social media to spread the bad word. This
suggests brands are missing a trick because 75% of respondents would return to a company with
excellent service and 56% would recommend it to family and friends (see Figure 8).
However, attitudes can vary considerably by country. In Brazil, reputation carries a far greater weight Figure 8: Impact of good customer service
than in Germany, with 92% of Brazilians taking it into account when buying something, compared to
just over half (57%) in Germany. Brazilians are also twice as likely as Germans to share with friends I
would
use
the
brand
/
company
again 75%
and family any bad experience, although similar numbers would use a company again (Brazil 78%;
Germany 71%) after receiving excellent service, or would recommend it (Brazil 64%; Germany 59%). I
would
trust
the
brand
more
than
previously 57%
I
would
recommend
the
brand
/
company
to
56%
The research makes it clear that brands are failing to match consumer expectations as 87% think friends
and
family
they need to work harder to create a seamless customer experience. Some companies are clearly I
would
think
more
highly
of
the
brand
/
company 54%
already aware of the shortfall and are trying to address it. Indeed, the way ahead may be along the
lines of September’s tie-up in the U.K. between catalogue merchant Argos and eBay for a click-and- I
would
spend
more
with
the
brand
/
company 33%
collect scheme, where consumers can buy on eBay and then choose to pick up the items at their I
would
recommend
the
brand
/
company
on
19%
nearest Argos store. Such tie-ins, which are likely to become more commonplace, serve to illustrate social
media
the increasingly blurred lines between sales and customer services and the need for brands to rethink None
of
the
above 5%
how they can ultimately best serve the customer. When brands get it right, though, the rewards are
significant with one in three (33%) shoppers admitting they spend more when customer service is
excellent.
8The omnichannel customer service gap – November 2013
Conclusion
In the last couple of years, brands have increasingly focused on developing omnichannel sales
strategies. These strategies though, in some cases, have resulted in customers feeling more
neglected than ever, particularly when it comes to customer service, believing all too often that
brands are failing to match the effort they put into sales with that they invest in service.
Despite some variation between regions, consumers have a very clear idea about what they expect
from brands in terms of customer service, and the vast majority feel let down as brands fail to meet
these expectations. Given that the rewards for getting it right include higher spend, improved
customer loyalty, and the cultivation of valuable brand ambassadors, it is surprising that brands are
not making more of an effort to satisfy their customers in this field. With the younger demographic
being particularly demanding in terms of real-time and self-service customer service options, it is
clear that the gap between expectations and performance will become wider if left unchecked.
Call centres and voice solutions look set to stay with customers still demanding them and reverting to
the “failsafe phone” when alternative channels fail to satisfy. The focus needs to be on increasing the
speed of response and complaint resolution, as well as providing a single point of contact, regardless
of channel. Offering a choice of customer service methods is fruitless if they are not properly
integrated and brands are unable to access “a single view of the customer” at every sales and
customer service touchpoint.
Fundamentally businesses must work harder to create a seamless service experience for customers.
The customer journey doesn’t simply stop at the checkout, but carries on for many years to come.
9The omnichannel customer service gap – November 2013
Germany
Figure 9: Likelihood to contact customer services relative to others
Despite an apparent apathy towards resolving issues with their purchases, German shoppers expect
a very high standard when it comes to customer service. Customers in Germany are less likely to Less
likely
– I
am
typically
more
want to ‘engage’ with a brand, but instead, expect an integrated and unified approach to customer More
likely
– I
am
tolerant
of
problems
typically
less
with
products
/
services. tolerant
of
problems
services
than
others
with
products
/
13%
services
than
others
The use of multiple platforms when making a purchase is particularly strong in Germany. Over the 21%
last six months, three quarters (75%) of shoppers have bought a product or service involving multiple
channels, the highest seen across Europe. Only Brazil has a greater propensity to use multiple
channels when choosing to make a purchase (86%). German customers are aligned with the rest of
the globe in their use of customer services, yet they are more likely to have contacted an online
retailer within the last six months (62%), when compared to their European neighbours (48% and
41% in France and the U.K., respectively). However, when it comes to resolving an issue, shoppers’
emotions are somewhat measured, passive almost, with two thirds (66%) admitting they are neither
accepting nor intolerant of problems with products or services (see Figure 9). As such, German
customers are content with contacting a company and letting them resolve a problem on their behalf. About
average
66%
Just 42% believe it is more important to resolve their own problems than rely on a customer services
rep.
Figure 10: Impact of excellent customer service
Nevertheless, German standards are high and this is reflected in their expectation of customer
service quality. Both speed of response (88%) and resolution (89%) are important to customers, yet I
would
use
the
brand
/
company
again 71%
the deficit in delivering these is most noticeable in Germany. Under half (44%) believe response
times are either “good” or “excellent”, with a further 42% feeling the same way about the time taken to I
would
recommend
the
brand
/
company
to
friends
and
family
59%
resolve a problem. Their lack of emotional attachment to the problem, combined with their high
service expectation, means customers are not willing to wait around. Indeed, just 38% will try any I
would
think
more
highly
of
the
brand
/
company 57%
channel and wait as long as it takes to resolve a query. I
would
trust
the
brand
more
than
previously 55%
Engagement with brands is controlled as shoppers seek to conduct basic transactions. If customers I
would
spend
more
with
the
brand
/
company 25%
receive excellent customer service, only 25% will spend more money with that brand in the future
I
would
recommend
the
brand
/
company
on
(see Figure 10). Further still, 59% believe being rewarded for purchases, feedback, and referrals is social
media
12%
important to them, compared to a global average of 66%. German shoppers, instead, expect a
None
of
the
above 7%
simple, unified approach to customer service. Image is not a priority for customers, with 57% thinking
a company’s reputation for customer is important to them when choosing to buy from them,
compared to a global average of 78%. Instead, over half (53%) expect to be able to return goods via
a different channel from the one purchased from.
10The omnichannel customer service gap – November 2013
United States
Customers’ expectation for fast and simple customer service in the U.S. is no different from the rest Figure 11: Use of customer services in last six months
of the globe. Yet brands must be aware that the level of engagement is notably higher in the U.S. On
top of receiving a good quality service, U.S. shoppers expect to be rewarded for the loyalty they show Broadband
/
media
/
cable
/
satellite
TV 49%
to companies. Banks,
insurance
and
other
financial
service
46%
providers
U.S. shoppers are less likely to use a variety of channels when looking to make a purchase. Online
retailers 45%
However, over half (51%, compared to the global average of 67%) of customers still admit to using Travel,
holiday,
airlines 40%
different platforms before deciding on a purchase. Despite the majority of U.S. shoppers making
Retailers
(store) 40%
purchases with a wide range of providers, shoppers are less likely to engage with customer services
compared to other countries. Amongst customers who have made a purchase with that provider, just Technology 37%
46% have approached banks, 45% online retailers, and 36% fixed or mobile operators with customer Fixed
/
mobile
phone
operators 36%
service issues (see Figure 11).
Car
/
vehicle
and
parts 35%
Nevertheless, the level of service customers expect is no different. 71% say expectations for Energy
and
utilities
providers 33%
customer service is increasing year-on-year. As such, the quality of service is imperative in the U.S.
As with the rest of the globe, both speed of response (88%) and resolution (88%) are important to
Figure 12: Reaction to unanswered emails
customers. Yet providers need to go further to ensure they are meeting this high expectation. Only
half believe brands are “good” or “excellent” at delivering speed of response (50%) and resolution
(51%). Call
customer
services
/
call
centre 74%
Email
customer
services
again 42%
U.S. customers, despite using a variety of channels to contact customer services, have a stronger Use
Live
Chat
/
Click
to
Chat*
through
a
website 24%
preference towards using telephone calls to resolve their queries. As such their expectation of this Seek
out
help
in
store 22%
channel is unparalleled to other regions. Nearly two thirds (65%) of shoppers expect an issue to be Share
my
frustration
with
friends
/
family 21%
resolved within 30 minutes when contacting customer services by phone. Only in Brazil and France, Use
Click
to
Call* 16%
countries characterised by demanding customers, is expectation greater (68% and 73% respectively). Use
online
self
service
portal
/
community
forums 11%
Such is the reliance on phone that it is more likely to act as a ‘failsafe’ if other channels fail to deliver Share
my
frustration
on
social
media
sites 9%
in resolving shoppers’ queries. Customers will revert back to phone if both email (74%, see Figure Contact
brand
through
social
media
channel
/… 6%
12) and social media (58%) fail to deliver. In return for receiving great customer service, customers Other 1%
are more likely return to that company and spend more (37%, compared to a global average of 33%).
Do
nothing 6%
Further still, 71% admit that being rewarded for purchases, feedback, and referrals is important to
them. As such, brand image and perception are two important ingredients for U.S. consumers. 84%,
compared to global average of 78%, think a company’s reputation for customer service is important to
them when choosing to make purchases.
11The omnichannel customer service gap – November 2013
France
Figure 13: Response expectations to phone
French shoppers expect their issues to be resolved as quickly as possible regardless of what
channel they use. The need for joined up services is more evident in France, where the implications Immediately 60%
of failing to deliver this could lead to negative experiences being shared with others.
Within
10
minutes 17%
Within
30
minutes
Compared to other regions, within Europe in particular, France has a higher propensity to contact 6%
customer services to address their problems. Over the last six months 62% of customers have Within
an
hour 4%
approached banks, with a further 67% contacting fixed or mobile operators. As with the rest of the Within
2
hours 3%
globe, both phone (56%) and email (51%) are the most preferred methods, yet there is a slight Within
half
a
day 5%
reluctance to use self-service portals (20%) in resolving their query. However, customer Within
a
day 4%
empowerment is still important in France. Indeed, nearly two thirds (64%) believe it is more important
Within
a
few
days 1%
to resolve their own problems than rely on a rep.
Within
a
week 1%
With a tendency to resolve their own issues, customers expect action from customer services as Longer
than
a
week 1%
quickly as possible. 73% expect real-time assistance regardless of which channel they use. Further
still, not only do they expect a response instantly, but they also expect their problem to be resolved
Figure 14: Sharing customer service experiences
on the spot. 60% expect a response immediately on the phone, with 73% expecting the problem to be
resolved within 30 minutes (see Figure 13). Similarly with email, two thirds (68%) expect a response
Shared
negative
customer
services
experiences
with
within half a day, with a further 88% expecting the problem to be resolved within a day. friends
/
family
41%
Shared
positive
customer
services
experiences
with
31%
friends
/
family
In an attempt to get their problem resolved, nearly half (49%) will try any channel available to them Complained
directly
to
a
brand
about
their
poor
30%
and wait as long as it takes to get the issue resolved. Yet in doing so 48%, compared to an average customer
service
of 37%, expect to be able to contact the same service rep regardless of the channel used. In their Not
signed
up
to
a
particular
supplier
/
not
started
using
a
particular
brand
as
a
result
of
poor
customer…
17%
search for a quick and effortless answer, French customers will use every available resource Bought
something
from
a
particular
retailer
following
14%
available to them. As such, the need for a joined up and integrated service is significant. someone
else’s
recommendation
Switched
suppliers
/
stopped
using
a
particular
brand
14%
as
a
result
of
poor
customer
service
The impact of failing to provide a seamless and integrated experience can be damaging and is Shared
negative
customer
service
experiences
via
9%
social
media
channels
something that brands should take into account. 41% of consumers, the highest seen in Europe (27% Shared
positive
customer
services
experiences
via
7%
and 35% in the Germany and the U.K. respectively), will share negative comments with their friends social
media
channels
and family if they experience bad customer service (see Figure 14). A further one in ten (9%) will
share negative customer service experiences with peers via social media. However, amongst
customers who are positive or loyal to a brand, they expect something in return. Indeed, 73% say
being rewarded for purchases, feedback, and referrals is important to them, the highest seen in
Europe (compared to 59% and 61% in Germany and the U.K., respectively).
12The omnichannel customer service gap – November 2013
Japan Figure 15: Likelihood to contact customer services relative to others
Japan is a country characterised by tolerance. Whilst it may appear that shoppers have low
expectations, this is far from the case. Shoppers are willing to accept how they do business with More
likely
– I
am
typically
less
brands, but this doesn’t necessarily translate into emotional engagement with companies. tolerant
of
problems
with
products
/
services
Other than engaging online retailers, Japanese customers are less likely to approach providers with than
others
8%
customer services issues. Compared to the global average of 51%, just over one in three shoppers
(36%) have contacted fixed or mobile operators regarding customer service issues. Furthermore, only Less
likely
– I
am
typically
more
31% have engaged broadband or media companies regarding a problem with their product or tolerant
of
problems
with
service, compared to an average of 51%. Japan, in particular, is highly tolerant when it comes to products
/
services
dealing with issues with their purchases. Nearly half of customers (45%) admit they are typically more than
others
45%
accepting of problems with product or services than others (see Figure 15). This contrasts sharply About
average
with the global average of 17%. As such, both demand and expectation from customer services is 47%
somewhat measured compared to other regions. Compared to the global average of 69%, only half
(57%) consider expectations for customer services to be increasing year-on-year. Appetite for using
channels further in the future is marginal, yet Japanese customers are more likely to opt for self-
service options when resolving a problem. Over half (52%) would be willing to use self-service portals
over the course of the next twelve months in order to get their query resolved.
Figure 16: Customer service performance
While it would be unfair to say that Japanese shoppers are content with the level of customer service
%
rating
brands
as
excellent
or
good
they receive, the customer service deficit is less notable here. The importance of response (88%) and
timely resolution (85%) are in line with the rest of the globe, yet the majority are satisfied with the Speed
of
response 59%
speed of these factors (59% deemed both either “good” or “excellent”) (see Figure 16). Japan’s Speed
of
resolution
/
how
quickly
your
issue
is
resolved 59%
relative satisfaction with speed of response can be associated with the country’s generally higher A
seamless
experience
across
different
channels 52%
level of tolerance. Only 30% expect a response immediately when using their phone, compared to the Enabling
me
to
solve
my
own
problems 51%
global average of 50%. Further still, 56% expect their problem resolved over email within a day, Using
logical
and
effective
process
to
solve
problems 51%
compared to the global average of 75%. Whether Japanese shoppers are happier or resigned to the
24/7
availability
of
customer
service
support 50%
fact that the level of service will always be the same, their appetite for change is limited. Just one in
Feeling
valued
as
a
customer 50%
four (23%) expect to be able to return goods or purchases via a different channel, with a further 31%
Knowledge
of
your
purchases
/
previous
interactions 47%
expecting to be able to contact the same service rep regardless of the channel they use. While they
appear to be happy with the status quo, Japanese customers are emotionally disenfranchised with Friendliness
of
representative 42%
brands. Only a third of shoppers (33%) would recommend a company to their friends or family after Dealing
with
a
single
representative 40%
receiving excellent customer service. Further still, under half (46%) believe being rewarded for Making
customer
feel
in
control
of
the
process 35%
purchases, feedback, and referrals is important to them, compared to a global average of 66%.
13The omnichannel customer service gap – November 2013
Brazil
Figure 17: Likelihood to contact customer services relative to others
Consumers in Brazil are significantly more intolerant of product or service issues than the rest of the
globe. Shoppers expect a timely resolution to their issues, and omnichannel shopping is becoming Less
likely
– I
am
typically
more
commonplace in Brazil. The need to provide a unified customer service is especially marked with tolerant
of
Brazil. problems
with
products
/
services
than
others
The use of multiple channels in completing a purchase is higher in Brazil. Be it researching in store or More
likely
– I
am
8%
buying online, 86% have made purchases involving different platforms in the last six months. typically
less
tolerant
of
Interaction with customer services is particularly high in Brazil, with fixed or mobile providers (82%) problems
with
and broadband or media companies (80%) being the most approached providers over the last six products
/
services
than
others
months. A further 76% have contacted online retailers with customer service issues. 40%
Conversely to Japan, Brazilian consumers are highly impatient. 40% admit to being typically less About
average
tolerant of problems with products and services compared to others (see Figure 17). Only 8% believe 52%
they are “accepting”. As such, the standard expected is high; 79% say expectations for customer
services are increasing year-on-year. With widespread and frequent use of customer services and
shoppers displaying low levels of tolerance, expectations over the time taken to respond and resolve
an issue are unparalleled. 80% would like a response within half a day when contacting a company Figure 18: Customer service performance
via email, with a further 90% expecting the problem to be resolved within 24 hours. Expectations are
particularly high with social media, with 79% wanting a response within two hours. %
rating
brands
as
excellent
or
good
Speed
of
resolution
/
how
quickly
your
issue
is
82%
Despite the high benchmark set over the response and resolution time, brands appear to be resolved
Feeling
valued
as
a
customer 81%
delivering a high standard. The customer service deficit is minimal in Brazil, with satisfaction over the
speed of response (81%) and resolution (82%) either “good” or “excellent” (see Figure 18). However, Speed
of
response 81%
in their pursuit of resolving a problem as quickly as possible, 62% will try any channel available to Friendliness
of
representative 79%
them, significantly higher than the global average (45%). As such, the need for an integrated and Using
logical
and
effective
process
to
solve
problems 77%
seamless customer service experience is vital in Brazil. Over half (52%) expect to be able to return Knowledge
of
your
purchases
/
previous
interactions 76%
purchases via a different channel than the one bought from. However, 83% believe brands pay more Making
customer
feel
in
control
of
the
process 73%
attention to generating sales across different channels than providing an integrated customer service 24/7
availability
of
customer
service
support 73%
experience. The rewards for better servicing Brazilian consumers are great; 64% will recommend a
Dealing
with
a
single
representative 70%
brand to a friend or family member, with a further 44% likely to spend more money in future, if they
A
seamless
experience
across
different
channels
receive excellent customer service. However, the costs of failing to deliver customer service are high 70%
too. Over half (54%) will share negative customer service experiences with friends and family, a Enabling
me
to
solve
my
own
problems 69%
significant rise from the global average of 36%.
14The omnichannel customer service gap – November 2013
United Kingdom
Figure 19: Use of customer services in last six months
The U.K. expects the highest level of customer service across Europe. While U.K. shoppers may
appear “unforgiving” in the way they engage with brands, part of this attitude can be explained by
Broadband
/
media
/
cable
/
satellite
TV 44%
their impatient nature. U.K. customers, however, are likely to reward brands that simplify their service
and resolve problems with minimum hassle. Online
retailers 41%
Banks,
insurance
and
other
financial
service
39%
providers
U.K. consumers appear more reluctant to engage with customer services than other nations, with
only a minority contacting broadband or media providers (44%), online retailers (41%), and banks Travel,
holiday,
airlines 38%
(39%) within the last six months (see Figure 19). Yet this doesn’t mean expectation for unrivalled Retailers
(store) 36%
customer service is reduced. In fact, demand for great customer service is increasing year-on-year,
Fixed
/
mobile
phone
operators 34%
with 72% saying expectations for customer service is increasing over time, the highest seen across
Europe. U.K. customers become impatient if their needs are not met. 27%, the highest in Europe, Energy
and
utilities
providers 33%
describe themselves as less tolerant than other people when it comes to resolving a customer service Car
/
vehicle
and
parts 28%
issue. As with most of the world, calling is the most popular method used to contact customer
Technology 25%
services (54%) over the last six months, yet email, a close second (53%), is set to become the most
popular channel within the next twelve months (74%).
The customer service deficit is greater in the U.K., with just one in three shoppers rating the speed of Figure 20: Impact of excellent customer service
response (35%) and resolution (36%) as “good” or “excellent”. With this in mind, brands should look
to support email as part of their integrated customer service in the future. Over half of customers
(54%) will try any channel available to them and wait as long as it takes to resolve a query. Indeed, I
would
use
the
brand
/
company
again 82%
71% will revert to using their phone if the use of email fails to resolve a problem. Given the relatively I
would
recommend
the
brand
/
company
to
friends
high impatience amongst U.K. shoppers, the need for an integrated customer service is critical. Yet it and
family
62%
appears that companies are failing to deliver on this much needed unified service. 80%, significantly I
would
think
more
highly
of
the
brand
/
company
60%
higher than both France (65%) and Germany (67%), believe brands focus more on generating sales
through their channels rather than providing a integrated and seamless user experience. I
would
trust
the
brand
more
than
previously 56%
Rather than just appeasing customers in the immediate short-term and satisfying their impatient I
would
spend
more
with
the
brand
/
company 36%
nature, brands must recognise the lasting impact of fast, simple, and friendly customer service. The
I
would
recommend
the
brand
/
company
on
social
vast majority of U.K. shoppers (82%) after receiving exceptional customer service would use that media
17%
company again, with a further 62% recommending a company to a friend or family (see Figure 20).
None
of
the
above 4%
Therefore the immediate cost of having to join up the customer service experience is likely to be
outweighed by the benefits of happy, satisfied, and, importantly, loyal customers.
15The omnichannel customer service gap – November 2013
Australia
Australians typify the modern day omnichannel shopper. Consumers expect a fast and simple Figure 21: Channels used to resolve queries
customer service experience, yet disconnected channels only serve to slow the resolution of
problems down. Inevitably shoppers become frustrated and disengaged with brands.
Calling
customer
services
/
call
centre 59%
After using the phone (59%), Australians are most likely to email (53%) customer services with an
issue or problem (see Figure 21). However, outside the “core methods”, customers are likely to try Emailing
customer
services 53%
other channels. One in three (33%), compared to the global average of 27%, have used self-service Online
self
service
portal
with
frequently
asked
33%
portals in the last six months, with a further 21% using live chat tools. questions
(FAQs)
/
community
forums
In
store 32%
Irrespective of the channel chosen by customers, use of key methods is set to increase over the next
Live
Chat
/
Click
to
Chat*
through
a
website 21%
twelve months as both expectation and demand grows. Two thirds (66%) are likely to contact a brand
via email, with a further 57% likely to address their problems directly in-store. Further still, if the use of Click
to
Call* 13%
email fails to deliver a result, three in four shoppers (75%) will fall back to the ‘failsafe’ phone. Such is Through
a
brand
/
retailer’s
social
media
channel
/
the varied and multiple use of different channels, particularly in Australia, that the need for a joined up page
8%
and integrated service is evident. Australia is no exception to the rest of globe in its expectations for a None
of
the
above 19%
quick, simple and logical approach to customer service. Indeed, the vast majority believe speed of
response (88%) and resolution (89%), and the use of effective processes (84%) are important to the
customer service experience. Yet a disconnected, detached, and dispersed service will only serve to Figure 22: Impact of excellent customer service
undermine these values important to customers.
Whilst shoppers demand both a quick and simple service, they also expect brands to have a single I
would
use
the
brand
/
company
again 82%
view of the customer no matter which channel they use. Over half (54%) expect to be able to return I
would
recommend
the
brand
/
company
to
friends
65%
goods via a different channel to the one used to purchase, with a further 43% expecting to be able to and
family
contact the same rep regardless of the channel used (compared to the global average of 37%). I
would
think
more
highly
of
the
brand
/
company 61%
However, as with other nations across the globe, Australians believe brands need to go further to turn
this vision into a credible reality. As it stands, 79% believe brands pay more attention to increasing I
would
trust
the
brand
more
than
previously 55%
sales through their different channels, rather than focusing on a joined up customer service. Similar to
Brazilian customers, Australians appear sensitive to the quality of service they receive. On the one I
would
spend
more
with
the
brand
/
company 41%
hand, shoppers will punish brands for bad customer service, with 44% sharing negative experiences I
would
recommend
the
brand
/
company
on
social
with friends and family and 13% sharing on social media. Yet the rewards are there for businesses media
23%
willing to invest in a simple, seamless, and unified user experience. 82% will use a brand again, with None
of
the
above 4%
a further 41% prepared to spend more money with a company (compared to a global average of
33%), if they receive excellent customer service (see Figure 22).
16The omnichannel customer service gap – November 2013
17You can also read


