Status of Climate in South Africa and predictions for the 2020-2021 summer season - Water Research ...
←
→
Page content transcription
If your browser does not render page correctly, please read the page content below

$GYLVRU\3DQHOPO8FBUIFSBOE$MJNBUF                                                                                   OCTOBER 2020

 Status of Climate in South Africa and predictions for the
 2020-2021 summer season
 Contributors: Cobus Olivier, Christien Engelbrecht, Mary-Jane Bopape and Joel Botai (SAWS)

 Reflection on the 2020 winter season                                          that the latter attribute contributed to the observed above-
                                                                              normal rainfall that was experienced over most of the winter
 Rainfall departures from normal for the individual months of                 rainfall region during those months. The month of August
 the extended winter season, defined as the months from May                    experienced a higher frequency than normal for all three
 to September are shown in Figure 1. After good rainfall over the             rainfall thresholds and these events also occurred further
 winter rainfall region (southwestern part of the country) during             eastwards along the coast during August compared to the
 the 2019-2020 summer, the winter rainfall season over the                    preceding winter months. The maximum temperatures were
 winter rainfall area started off slowly as seen in the May rainfall           warmer than normal over the largest part of the country during
 departures from normal (Figure 1). May is usually the month                  all the months, except during the month of August when
 of the onset of the winter rainfall season. The first cold front              colder than normal conditions occurred over large parts of
 associated with good rainfall only arrived at the very end of the            the country, in particularly the western parts. The warmer than
 month of May (not shown here). From then onwards during the                  normal maximum temperatures over the winter rainfall region
 winter rainfall period and in particular during the mid-winter               occurred during the months with a below-normal occurrence
 months (June, July and August) above-normal rainfall occurred                of rainfall events > 1 mm. It can therefore be concluded that
 over the winter rainfall region (Figure 1). The areas further                in between the occurrence of the more intense rainfall events
 eastwards along the Cape south coast and over the catchment                  (as deduced from the above-normal occurrence of rainfall
 regions of the Nelson Mandela Metropole have unfortunately                   events > 10 mm and rainfall events > 20 mm), temperatures
 not benefited from the cold fronts, and experienced in general                recovered relatively quickly resulting in those months to have
 a winter of below-normal rainfall (Figure 1) and above-normal                experienced warmer than normal conditions, even though
 daytime temperatures (Figure 6).                                             snow accompanied some of those rainfall events. The mid-
                                                                              winter season (June-July-August) ended strong with the month
 Figures 2 to 3 show the relative observed occurrence of rainfall             of August that was characterised by good rainfall over the
 events exceeding 1 mm, 10 mm and 20 mm respectively as                       winter rainfall region and cold conditions over large parts of
 compared to their long term mean. These figures convey an                     the country. It may be noted that in terms of early morning
 important observation relevant for in particular the months of               temperatures as represented by the minimum temperatures
 June and July (two of the three important rainfall months for                (Figure 5), large parts of the interior experienced cooler than
 the winter rainfall region), namely that rainfall events > 1 mm              normal early mornings. The relatively higher frequency of the
 occurred less frequently than normal, whilst rainfall events                 rainfall events > 10 mm and > 20 mm over the southwestern
 > 10 mm as well as rainfall events > 20 mm occurred more                     parts of the country very likely contributed to good runoff
 frequently than normal over the largest part of the winter                   that aided in the replenishment of dam levels over those areas
 rainfall region. These observations of the 1 mm, 10 mm and                   in combination with snow events. The Theewaterskloof Dam
 20 mm rainfall events translate to less rainfall events than                 reached full capacity over the past week for the first time in
 normal, but that the rainfall events were more intense and                   many years.

 Bulletin of the Advisory Panel on Weather and Climate for the Water Sector                                                            PAGE1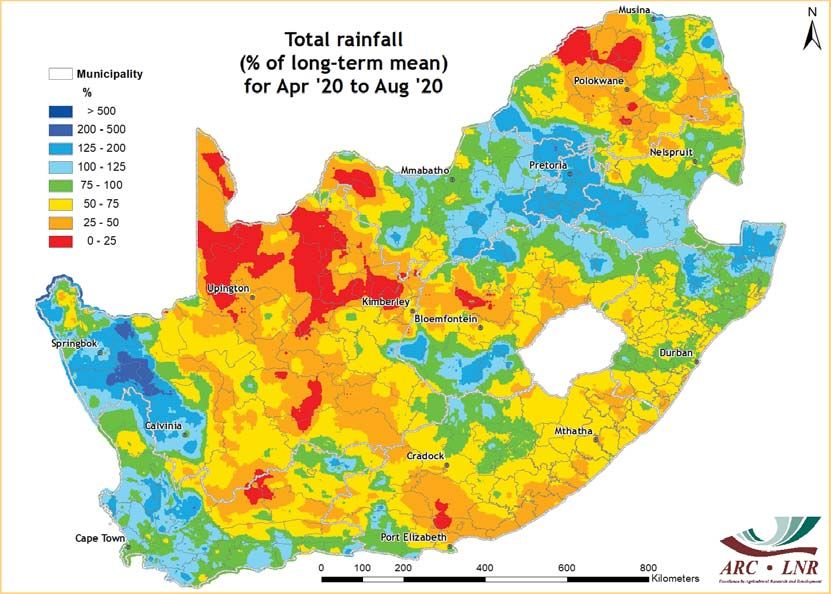
The start of the 2020 spring rainfall season                                 summer rainfall. As rainfall during the winter of 2020 failed
                                                                             mostly within the catchment regions of these dams, a recovery
The onset of the summer rainfall season over the summer                      in dam levels will be dependent on good spring and summer
rainfall region usually starts towards the end of September. The             rainfall.
observed rainfall for the month of September 2020 is shown
in Figure 1 (far right). The far northeastern parts of the country           Rainfall and temperature outlook for the 2020-21
that receives summer rainfall had above-normal rainfall during               summer season
the month of September. The number of rainfall days over
these parts of the country during the month of September is                  During the spring and summer of 2020-2021, the current
more than normal for both 1 mm (Figure 2) and 10 mm (Figure                  rainfall outlook indicates enhanced probabilities of above-
3) rainfall events. Similarly, parts of the southern interior of the         normal rainfall over large parts of the country, but less so over
country that receives summer rainfall had above-normal rainfall              the far northeastern parts of the country (Figure 7). The coming
during the month of September.                                               summer season is also predicted to be cooler than normal
                                                                             (Figure 8) in association with the enhanced probabilities of
Eastern Cape drought                                                         above-normal rainfall. It may be noted that the skill of seasonal
                                                                             outlooks is generally valid for the summer rainfall region during
Large parts of the Eastern Cape are experiencing water                       the mid-summer period. Current ENSO predictions show La
shortages in both urban and rural areas. Climatologically,                   Niña conditions to be present during the 2020-21 summer,
the Eastern Cape is a diverse region with the western coastal                hence the confidence of the rainfall predictions for the summer
belt that receives all-year rainfall, whilst the remainder of                period to realize is higher compared to during neutral ENSO
the province receives summer rainfall. Some of the water                     seasons.
catchment regions to strategically placed dams that supply
water to Nelson Mandela Bay are transboundary catchments
and can therefore benefit from all-year rainfall as well as

  Figure 1. Rainfall anomalies (expressed as the percentage of normal relative to the respective 1981-2010 longterm mean) for the
                                     months of May, June, July, August and September of 2020.

 Figure 2. Rainday anomalies for rainfall events > 1 mm (expressed as the difference in the number of days relative to the respective
                   1981-2010 long term mean) for the months of May, June, July, August and September of 2020.

Bulletin of the Advisory Panel on Weather and Climate for the Water Sector                                                              PAGE2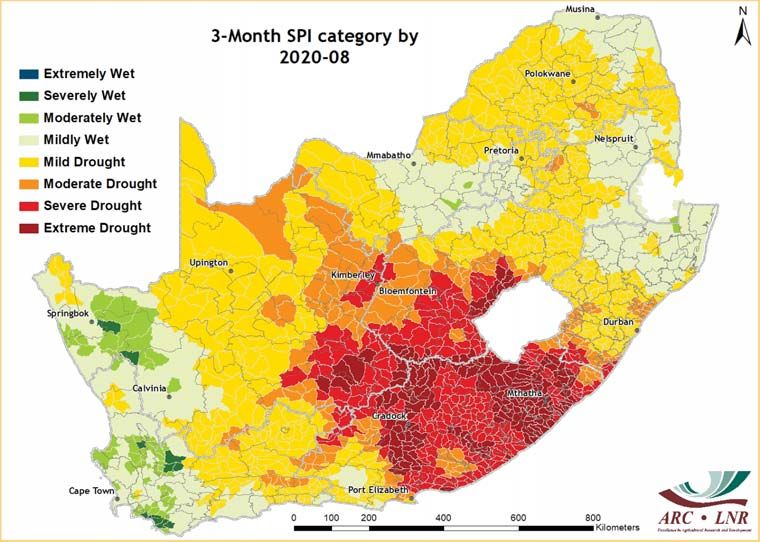
Figure 3. Rainday anomalies for rainfall events > 10 mm (expressed as the difference in the number of days relative to the respective
                    1981-2010 long term mean) for the months of May, June, July, August and September of 2020.

Figure 4. Rainday anomalies for rainfall events > 20 mm (expressed as the difference in the number of days relative to the respective
                   1981-2010 longterm mean) for the months of May, June, July, August and September of 2020.

 Figure 5. Minimum temperature anomalies (relative to the respective 1981-2010 long term mean) for the months of May, June, July,
                                                 August and September 2020.

Figure 6. Maximum temperature anomalies (relative to the respective 1981-2010 long term mean) for the months of May, June, July,
                                                August and September 2020.

Bulletin of the Advisory Panel on Weather and Climate for the Water Sector                                                       PAGE3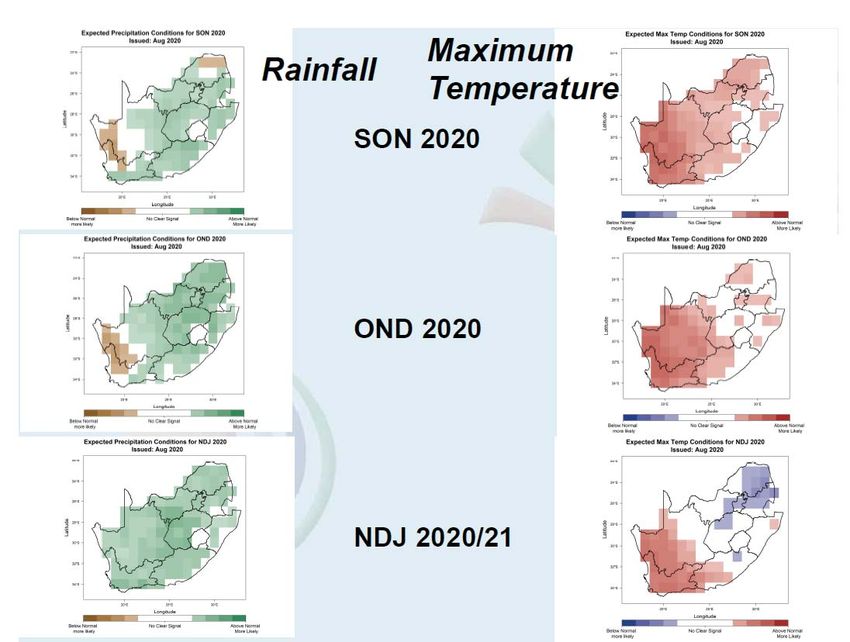
Figure 7. Rainfall predictions for October-November-December 2020-2021 (left), November-December-January 2020-2021 (middle)
                                         and December-January-February 2020-2021 (right).

Figure 8. Maximum temperature predictions for October-November-December 2020 (left), November-December-January 2020-2021
                                (middle) and December-January-February 2020-2021 (right).

Observed conditions and outlook for the summer
season – 2020/21: agricultural perspective
Contributors: Teboho Masupha, Johan Malherbe and Mokhele Moeletsi (ARC-SCW)

Current agrometeorological observations                                      These good rainfall conditions continued into the month of
                                                                             July, which started promisingly with heavy rain that resulted
The winter rainfall region welcomed the onset of its rainy                   in localized flooding over some areas. Favourable conditions
season at the end of May and more intensely during the                       remained in place over the winter rainfall region through
early days of June. This was mainly due to the passage of                    August and September also. The rainfall map for April-August
numerous cold fronts over the southwestern parts of the                      2020, given as a percentage of the long-term mean (Figure
country. Atmospheric circulation patterns were such that                     1) indicates near- to above-normal conditions over the
frontal systems battered especially the southwestern winter                  winter rainfall region. This was an improvement of up to 100
rainfall region and along the West Coast, a pattern that has                 mm considering the same period last year. It is evident that
been lacking during the previous few winters and especially                  significant amounts of rainfall occurred over the surface water
during the drought of 2015-2017. Widespread above-normal                     sources of the Western Cape, important for agricultural water
rainfall therefore occurred over the winter rainfall region with             storage.
concomitant improved prospects for a good wheat crop.

Bulletin of the Advisory Panel on Weather and Climate for the Water Sector                                                             PAGE4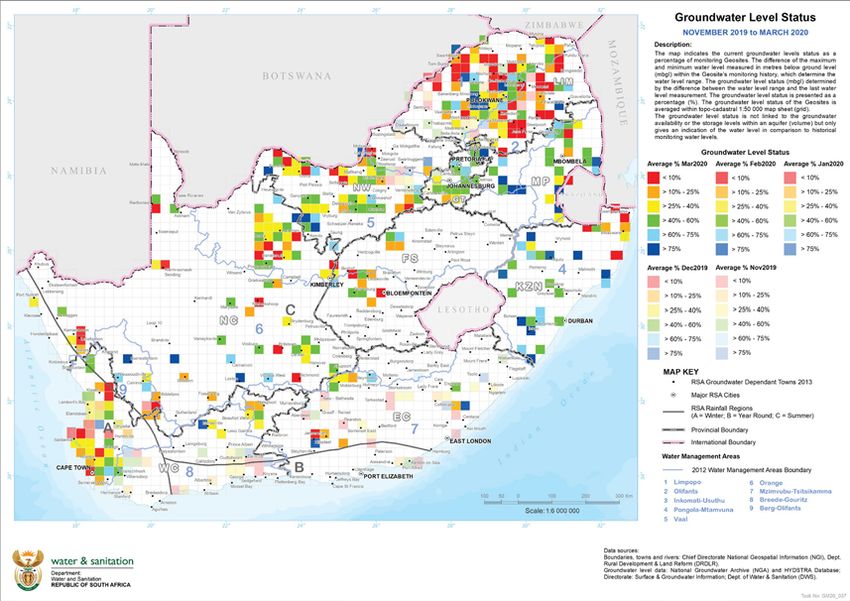
Figure 1: Total rainfall from April – August 2020.

A series of very strong cold fronts moved across the interior starting from late May. These resulted in the aforementioned
widespread rain over the southwestern parts while bringing cold, dry conditions to most of the central to northeastern interior.
Frontal systems moved across the interior from the southwest and advected cold, dry air that settled over the interior resulting in
very cold conditions, particularly with regard to minimum temperatures (which tend to be most strongly impacted under cold,
dry conditions). Figure 2 shows that large parts of the interior, particularly the Highveld, experienced temperatures more than 2°C
below the long-term average for that period, increasing the potential susceptibility of veld fires over those regions. Subsequent to
these cold conditions, temperatures started picking up over the country before decreasing again towards the end of August 2020.
Minimum temperatures returned to normal by the middle of September.

                                  Figure 2: Minimum temperature anomaly map for 1 June to 15 July 2020.

Bulletin of the Advisory Panel on Weather and Climate for the Water Sector                                                     PAGE5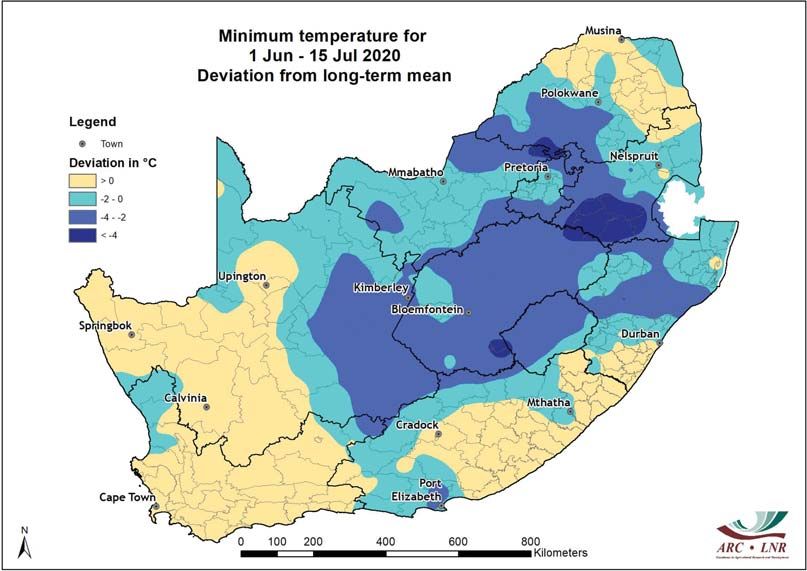
Considering the drought situation given by the Standardized Precipitation Index (SPI) ending in August 2020, areas of drought
concern were notable over the southern Free State, the Karoo and greater parts of the Eastern Cape. Following extreme drought
conditions over the Eastern Cape during the latter months of 2019, welcome rains were observed during January to April 2020. This
is normal as the greater part of the province is situated in the mid- to late-summer rainfall region. However, only short-term relief
was experienced as these rains were not enough to rehabilitate grazing conditions from the previous drought period. Mild drought
conditions became apparent in the area in May and, as depicted in Figure 3, these have since intensified, implying a risk of severe
widespread impending drought. Currently, dam water levels in the province remain low and common agricultural practices such as
cattle and sheep production are most likely to be negatively affected should these conditions persist. When considering the all-year
rainfall region which is situated in the southern belt of the province, the mildly wet conditions that were observed reflect above-
normal rainfall experienced during August.

                   Figure 3: Short-term (3-month) Standardized Precipitation Index (SPI) map ending in August 2020.

Vegetation activity, as reflected by the Normalized Difference Vegetation Index (NDVI) relative to the long-term mean NDVI (Figure
4 left) indicates near-normal vegetation conditions over most parts of the country’s interior, with below-normal conditions the
southern to eastern sea-board as well as the southern to western interior and along the West Coast. Much of the southwestern
winter rainfall region, including the grain-production areas there, experience above-normal vegetation activity. Rainfall should
start to pick up during early summer, as the summer rainfall season gets underway. As compared to the previous year, the NDVI
difference map for August (Figure 4 right) show positive difference values for 2020 compared to 2019 over most parts of the
drought-stricken areas. This implies an improvement of grazing as compared to the same period in 2019.

                  Figure 4: Vegetation activity given by NDVI for August 2020 (left) and relative to August 2019 (right).

Bulletin of the Advisory Panel on Weather and Climate for the Water Sector                                                     PAGE6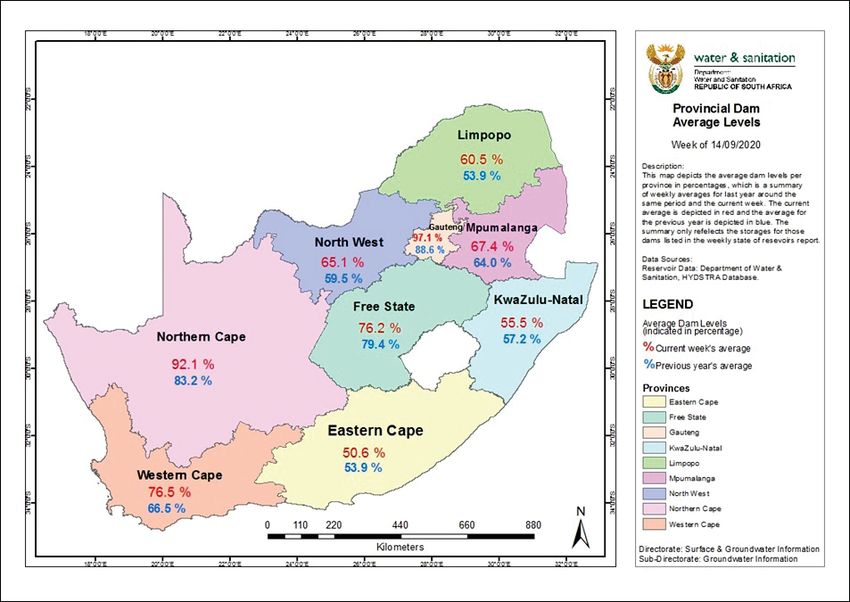
Implications and recommendations of the seasonal                             yields. Warmer conditions over the winter rainfall region during
outlook for the 2020/21 summer rainfall season                               this part of the year may support harvesting winter crops.

The September seasonal forecast issued by the South African                  Farmers should be prepared for relatively good rains that imply
Weather Service (SAWS) shows that the El Niño-Southern                       satisfactory crop performance over the summer rainfall region.
Oscillation (ENSO) is currently in a weak La Niña state and                  However, the possibility of poor rainfall distribution resulting
the forecast indicates that it will most likely remain and                   in wet- and dry spells should not be overlooked. It is worthy to
strengthen towards a moderate La Niña state during early- and                note that there are possible risks of localized flooding, which
midsummer. The forecast indicates enhanced probabilities of                  can wash away seeds or damage developing crops. Below-
normal to above-normal rainfall over much of the summer                      normal maximum temperatures (NE regions) imply low soil
rainfall region, implying favorable conditions over most of the              temperatures (might affect crop germination and emergence).
grain-production region. Given the above-normal rainfall over                Problems due to increased insect activity are likely to become
the summer rainfall region during autumn of the 2019/20 water                widespread, particularly if preceding seasons have been dry.
year, soil water should not be below normal. This, combined to               Farmers should periodically check for insects, diseases and
a mostly favorable outlook for rain during early summer, imply               ticks on livestock and consult local extension services so that
support for planting and early vegetative development.                       preventative measures can be put in place to prevent disease
                                                                             outbreaks on the farm.
The forecast for minimum temperatures does not indicate
extreme cold relative to the norm during the next few months.                With regards to planting, it is recommendable to (1) plant
This longer-term outlook is at odds with the medium-term                     within the normal planting window, (2) adjust planting date in
outlook which calls for late frost during early October over                 accordance to the onset of rains, (3) consider various cropping
the central parts of the country. The expected low minimum                   strategies based on soil moisture content, (4) increase planting
temperatures during early October over the central interior                  area (5) plant high yielding cultivars, and (6) plant in contours,
may result in frost damage in irrigated spring crops over the                if farm is in mountainous area. In order to minimize the risk of
Northern Cape and surrounding areas. In association with                     potential drought damage during the season, farmers should
relatively wet conditions expected, seasonal forecasts indicate              practice rainwater harvesting, increase water infiltration by
mostly near-normal maximum temperatures, leaning towards                     adding organic material to improve soil structure, and minimize
below normal over the central parts where the expectation                    compaction of topsoil. It is also recommended that farmers
for above-normal rainfall is relatively large. The Northern Cape             prepare for hailstorms, destructive winds and heatwaves by
and Western Cape is expected to be warmer than normal with                   practicing rotational grazing and keeping animals in small
regards to maximum temperatures. Near-normal maximum                         camps with water and shade.
temperatures, coupled with normal to above-normal rainfall
expected, will support crop production over the summer
rainfall region and could speed up regeneration of pasture

Reflections from the current state of water security in
South Africa
Contributors: Chris Moseki, Fanus Fourie, Beason Mwaka, Celiwe Ntuli, Malose Ngoepe and Ntobeko Cele (Department of Water and
Sanitation)

Introduction

The current state of water security (or insecurity) in South Africa is due to natural climate variability and change as well as the result
of non-climatic human induced impacts. South Africa has a high evaporation rate primarily due to high solar radiation under
natural conditions (i.e. prior to factoring climate change effects), which further impacts on runoff and groundwater recharge. Le
Maitre et al. (2020) projected that by 2032 increases in reduction of water due to invasive plants will spread through the mapped
areas of the Eastern Cape, Kwa-Zulu-Natal and the Western Cape. It is noteworthy that these areas are also high mean annual

Bulletin of the Advisory Panel on Weather and Climate for the Water Sector                                                               PAGE7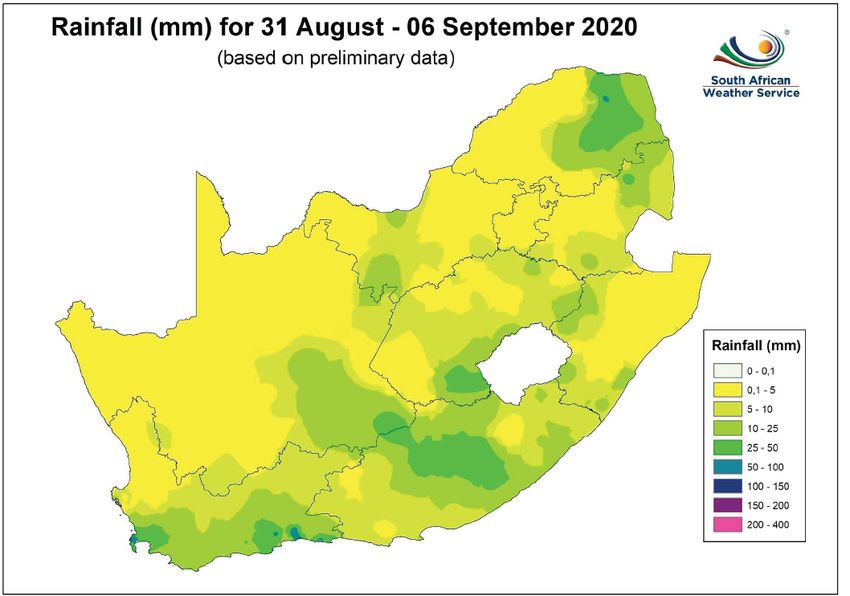
runoff catchments and as such the invasive plants have                        water crisis. These stress factors are some of the water security
significant impacts on water security. With regard to drought,                challenges that continue to bedevil water availability in South
the jury is still out to reach consensus on what almost led to               Africa.
“Day Zero” in Cape Town. Some researchers argue that it was
a climate caused related event while others put the blame on                 Predicted rainfall and temperature for South Africa
poor water management. For instance, Muller (2018) assert that               during the next spring and summer
notwithstanding the 3 year drought the city endured, poor
management was a major cause of drought. On other hand                       There was relatively fairly good rainfall in June, July and August
Masante et al. (2018) and Burls et al. (2019) contend that the               over much of the winter rainfall region of Western Cape as well
extreme 3 year drought event characterised by deficit in rainfall             as the western parts of the Northern Cape (Figure 1-3).
and heat waves were the main causes of the then Cape Town’s

               Figure 1: Fairly good rainfall in the Western Cape, parts of Gauteng and to the eastern parts of the country

                       Figure 2: Persistently good rainfall in the Western Cape and west of the Northern Cape region

Bulletin of the Advisory Panel on Weather and Climate for the Water Sector                                                                PAGE8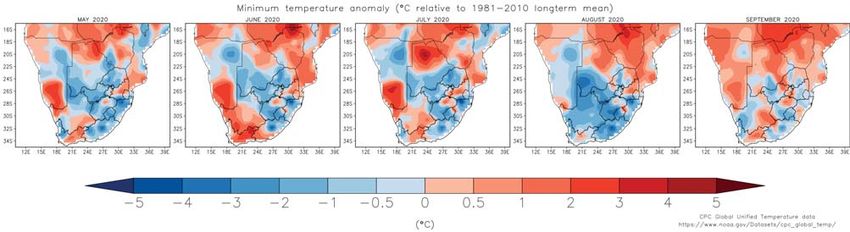
Figure 3: Rainfall at end of August – early September

The rainfall forecasts by South African Weather Service (SAWS) for the spring season and early summer indicate increased chances
of above-normal rainfall over most parts of the country particularly in the north east. SAWS also predict below-normal maximum
temperatures in the same area. Above-normal temperature is predicted for most of the country during spring (Figure 4).

                                            Figure 4: Projected maximum rainfall and temperature

Bulletin of the Advisory Panel on Weather and Climate for the Water Sector                                                  PAGE9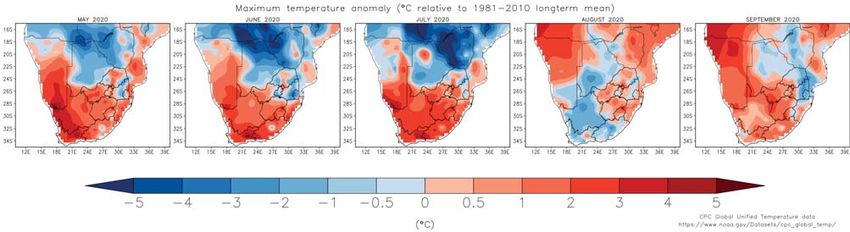
The state of dam water levels and observed trends

Figure 5 depicts the observed storage trends of the current hydrological year (from October 2019 to September 2020) compared to
the historical trends. The current (2019/2020) hydrological year’s storage is generally below the previous year’s (2018/2019) storage.
In other words, on average there was slightly more water in storage during 2018/19 compared to the current hydrological year.

                                                         Figure 5: National storage dams

Figure 6 shows the current (as at 14 September 2020) week’s average vs. previous year’s average. There are 6 Provinces (viz.
Limpopo, North West, Gauteng, Northern Cape, Western Cape, and Mpumalanga Province) which have their current week’s storage
higher than that of the same time last year. The other three provinces, KwaZulu-Natal, Eastern Cape and Free State have the current
week’s storage lower than the same time last year. Table 1 depicts details on Provincial dam storage.

                                 Figure 6: Map of current dam water level compared to same time last year

Bulletin of the Advisory Panel on Weather and Climate for the Water Sector                                                     PAGE10
Provinces Full Supply Water in Last Year Last Week This Week
Summary Capacity Storage (%Full) 07/09/20 14/09/20
(Million Cubic (Million Cubic (%Full) (%Full)
Metres) Metres)
EC Eastern Cape 1809.6 916.5 53.9 50.6 50.6
FS Free State 15653.0 11930.6 79.4 76.9 76.2
G Gauteng 128.1 124.4 88.6 97.4 97.1
KZN Kwazulu-Natal 4784.0 2652.9 57.2 56.0 55.5
L Lesotho 2362.6 429.1 22.1 18.8 18.2
LP Limpopo 1522.3 921.5 53.9 60.9 60.5
M Mpumalanga 2538.6 1711.6 64.0 68.0 67.4
NC Northern Cape 147.3 135.6 83.2 95.5 92.1
NW North West 867.3 564.3 59.5 65.9 65.1
S Swaziland 333.8 212.6 79.7 65.2 63.7
WCo Western Cape – Other rainfall 268.9 66.3 20.7 24.2 24.7
WCw Western Cape – winter rainfall 1596.8 1361.2 74.2 84.2 85.2
WC Western Cape - Total 1865.7 1427.5 66.5 75.5 76.5
Grand Total 32012.2 21026.7 66.8 66.2 65.7
Table 1: Provincial dam storage
The national storage, as at 14 September 2020, was 65.7% on average while it was 66.8% the same time last year. Figure 7 and 8
show trends in dam water storage in various water management areas for the current (2019/20) compared to the four previous
hydrological years (i.e. 2015/16, 2016/17, 2017/18, 2018/19). The low level of storage for Pongola-Mtavuna and Mzimvubu-
Tsitsikamma water management areas evoke no surprises since drought has been persistent in the Eastern Cape.
Figure 7: The dam water storage for the current hydrological year (2019/20) for each of these 4 water management areas is higher
than the storage for the previous hydrological year (2018/19)
Bulletin of the Advisory Panel on Weather and Climate for the Water Sector PAGE11Figure 8: The dam water storage for the current hydrological year (2019/20) for each of these 4 water management areas is higher
than the storage for the previous hydrological year (2018/19)
On the other hand, for Gauteng it is noteworthy that although the Vaal dam water level is currently (as at 17 September 2020) quite
low at 35.6%, it is a relief that Sterkfontein and Grootdraai dam water levels are 94% and 77.6% respectively and these dams are
used as storage for Vaal. Currently the Integrated Vaal River System is at 59.1% (Table2). The average water level of the Integrated
Vaal River System (IVRS) is currently 59.1%. Figure 9 shows trends in the current IVRS dam water storage compared to previous
hydrological years.
Figure 9: IVRS dam water storage
Bulletin of the Advisory Panel on Weather and Climate for the Water Sector PAGE12Implementation of the operating rules to ensure Umhlathuze Water Supply System comprises of one Dam
sustainability of water in the system (Goedertrouw Dam) with a number of lakes supplying
Richards Bay, Empangeni, Ngwelezane, kwaDlangezwa,
2020/21 Operating Rules for the summer rainfall areas are Esikhaleni towns as well as irrigation, industries and mines:
currently being implemented in various areas. The following The restrictions that are in place are 26% Irrigation, 7.5%
systems are still experiencing drought and as a result, the water Industries and 20% Domestic. The Joint Operations Committee
restrictions were recommended and are being implemented has been established and meets monthly to monitor the
and monitored: situation. Bloemfontein Water Supply System comprising of
3 dams serving Bloemfontein, Botshabelo and Thaba Nchu:
Algoa Water Supply System comprising of 5 dams for Nelson Compliance to the 15% Domestic restrictions happens.
Mandela Bay Metro, Sarah Baartman (SB) DM, Kouga LM and Crocodile East comprised of Kwena Dam supplies Nelspruit,
Gamtoos Irrigation: Compliance with overall 30% domestic & Kanyamazane, Matsulu, Malelane and Komatipoort areas and
industrial restrictions, 80% irrigation restrictions and varying Surroundings: 20% domestic and 60% Irrigation restrictions.
levels of restrictions for groundwater abstractions were
recommended. The water committee has been established and Integrated Vaal River System comprises of 14 dams serving
meets monthly to monitor the situation. Gauteng, Sasol, and ESKOM. Although Vaal Dam and Lesotho
Dams are low in storage, no restrictions are required for this
Amathole Water Supply System, comprising of 6 dams for water year as the state of storage within the entire system is
Bisho & Buffalo City, East London: There is 10% restrictions on still in a healthy state with Sterkfontein Dam, the second largest
Domestic 30% on Irrigation. Buffalo City Metro implemented Dam within the IVRS sitting at 94% of its Full Supply Capacity
also level 2 restrictions. Kliplaat System comprising of 3 dams (FSC).
for Queenstown: 30% Irrigation restrictions are still in place.
Chris Hani District Municipality is maximising its water use For winter rainfall areas, 2019/2020 operating rules are still in
from Xonxa Dam. Butterworth System comprising of Xilinxa place and will be reviewed at their November decision date.
Dam and Gcuwa weir supplying water for Domestic water use: The Western Cape Water Supply system comprises of 6 dams
Restrictions of 20% are still in place. Further interventions such for the City of Cape Town: no restrictions are in place and the
as augmenting river flows from upstream Dams have been state of storage is quite healthy with Bergriver dam being 100%
implemented. of its FSC. The Water Supply System Summary is presented in
the Table 2.
Table 2: Summary of the Water Supply Systems.
Bulletin of the Advisory Panel on Weather and Climate for the Water Sector PAGE13There hasn’t been any change in groundwater levels since the previous report was done. The groundwater levels of the Karroo,
Namaqualand, Limpopo and the West coastal are still lower compared to the historical levels (Figure 6). Hopefully the expected
above normal rainfall in spring and early summer will help improve water levels in these areas.
Figure 10: Groundwater level
Conclusions https://doi.org/10.1007/s00382-020-05413-0
It is important for the entire country, regardless of whether • Masante, D.; McCormick, N.; Vogt, J.; Carmona-Moreno,
water use restrictions are in place or not, to use water sparingly, C.; Cordano, E. and Ameztoy, I. (2018) Drought and Water
particularly while the country is under the Covid 19 pandemic. Crisis in Southern Africa, European Commission, Ispra, ISBN
The Eastern Cape region has severely been impacted by the 978-92-79-85851-2, doi:10.2760/81873, JRC111596
COVID-19 crisis with almost 20% of South Africa’s total of about • Muller, M. (2018) Cape Town’s drought: Don’t blame climate
400,000 cases by late July 2020 as compared to having less change DOI: 10.1038/d41586-018-05649-1 Nature Vol
than 12% of the national population (Mahlalela et al., 2020). 559 174-176
References
• Burls, N.J.; Blamey, R.C.; Cash, B.A.; Swenson, E.T.; al Fahad, A.;
Bopape, M-J.M.; Straus, D.M. and Reason, C.J.C. (2019) The
Cape Town “Day Zero” drought and Hadley cell expansion
https://www.researchgate.net/publication/335039966
DOI: 10.1038/s41612-019-0084-6
• Le Maitre, D.C.; Blignaut, J.N.; Clulow, Dzikiti, A.S.; Everson,
C.S.; Görgens, A.H.M. and Gush, M.B. (2020) Impacts of
Plant Invasions on Terrestrial Water Flows in South Africa.
Invading Nature - Springer Series in Invasion Ecology
Volume 14. https://doi.org/10.1007/978-3-030-32394-3_15
• Mahlalela, P.T.; Blamey, R.C.; Hart, N.C.G and Reason, C.J.C
(2020) Drought in the Eastern Cape region of South Africa
and trends in rainfall characteristics Climate Dynamics
Bulletin of the Advisory Panel on Weather and Climate for the Water Sector PAGE14About the Advisory Panel on Weather and Climate for the Water Sector
South Africa’s climate is characterized by severe spatial and temporal fluctuations in rainfall with a record decline and an increasing
trends of temperature. This affects issues relating to development, food security, crop production and water resource management
and planning. Policy makers and decision makers are often required to respond to drought and other disasters without having
demystified scientific information available. The distribution of rainfall in the country is skewed with high solar radiation and high
evaporation rate resulting in decreased water availability. Evaporation rates far exceeds precipitation (relatively higher in areas
where it rains less) coupled with increased occurrence of extreme climate events. Despite the fact that our country is naturally
water scarce, there is an increase in the frequency of droughts. Observed trends confirm the projected changes in rainfall and
temperature. It is upon this premise that an advisory panel has been established for a provision of a regular bulletin which will
talk to the water situation in the country while providing outlook and advisory. Climate plays a significant role to the country’s
economic development. Regular communication of weather and climate issues will enable government and various development
sectors’ decision making for climate change response, risk reduction and resilient approach for tackling the challenges in order to
sustain economic growth. The focus is largely on climate resilient developmental response over and above management of risks
brought by the changing climate. The primary purpose of the panel is to convene a climate and weather summit regularly that will
discuss amongst other weather and climate risks at hand and issue for the water sector a bulletin which will provide an outlook and
advisory in order to inform planning, risk reduction and adaptive response. Different experts are drawn from a variety of institutions
across South Africa and they together constitute a community of practice.
Multi-Institutional Panel
Convener: Brilliant M Petja, Water Research Commission, brilliantp@wrc.org.za
Bulletin of the Advisory Panel on Weather and Climate for the Water Sector PAGE15You can also read