7 PECULIARITIES OF RURAL CREDIT IN THE CERRADO
←
→
Page content transcription
If your browser does not render page correctly, please read the page content below
7 PECULIARITIES OF RURAL
CREDIT IN THE CERRADO
PRIVATE RESOURCES ATTRACTED                                                                                                                     INSIGHT
TO FINANCE LARGE PRODUCERS                                                                                                                  AUGUST 2021

CONTRAST WITH SCARCITY OF
CREDIT FOR FAMILY FARMING

                The Cerrado plays a central economic role in Brazilian agricultural production, accounting for a
                relevant share of agricultural commodities.1 The biome is responsible for approximately half of
                the nation’s soy production, a product whose grains, meal, oils, and by-products represented, in
                2019, 34% of the country’s agribusiness exports and around 15% of its total exports.2,3

                This economic relevance has been increasing over the last few decades. Reconciling agricultural
                production with greater sustainability is crucial. With growing international concern about
                climate issues, sustainable cultivation practices are essential to ensure a good placement in
                global trade chains. It is possible to increase production and, at the same time, preserve native
                vegetation. Between 2004 and 2019, the growth of agricultural production in the biome was
                accompanied by significant reductions in deforestation rates.4 Building on this process while
                avoiding setbacks is one of the challenges facing public policies in this biome.

                To act effectively in the region, it is necessary to understand the Cerrado. The biome boasts
                significant economic and social diversity. In terms of geography, it is present in the five regions
                of the country and it spans 10 states and the Federal District. Additionally, the distribution of
                agricultural activities across these states varies considerably.

                Rural credit, the primary public policy instrument available for agriculture, plays an important
                role in financing producers in the biome. In this brief, researchers from Climate Policy Initiative/
                Pontifical Catholic University of Rio de Janeiro (CPI/PUC-Rio) analyze the key features of rural
                credit in the Cerrado biome and highlight the specificities of the region’s agricultural activities.
                This work complements the previous analysis of rural credit in the Amazon conducted by
                CPI/PUC-Rio and seeks to provide a deeper understanding of rural financing in the Brazilian
                biomes.5 This analysis aims to help improve the credit policy and adapt this instrument to the
                specific challenges and context of the Cerrado.

                This analysis points to the existence of a considerable credit market which is proportional to the
                volume of its agricultural activity in the domestic market. The Cerrado biome accounts for

1 The definition of the Cerrado biome uses the smallest geographic units in Brazil’s territory: the municipalities. Although a municipality may span
different biomes, the classification scheme used in this paper is based on municipalities’ predominant biomes. That is, municipalities are placed in
the Cerrado category if most of their territories are composed of this biome. According to this definition, the Cerrado biome spans a total of 1,062
municipalities.
2 MAPA. AGROSTAT - Estatísticas de Comércio Exterior do Agronegócio Brasileiro. bit.ly/3j8T5Vs.
3 ME. COMEX STAT. bit.ly/3zOgRvQ.
4 INPE. PRODES Cerrado. bit.ly/3gOtShj.
5 Souza, Priscila et al. 6 Peculiarities of Rural Credit in the Amazon: New Research Shows Credit Restrictions and Extensive Land Use in Agriculture. Rio de
Janeiro: Climate Policy Initiative, 2021. bit.ly/3kdxUlC.

                                                                                                                                                               1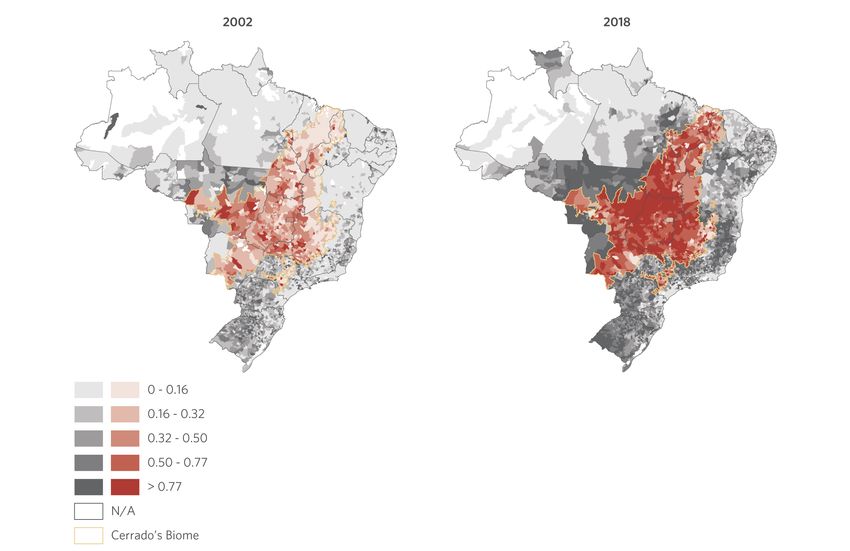
approximately one third of the country’s rural credit and agricultural production. Soy production
                has expanded in parallel to a growing concentration of financial flows in the Cerrado. Average
                contract values are 181% higher than in the rest of the country. Credit for small and medium
                producers is relatively scarce. Public policy must consider whether suitable credit conditions
                are being offered to smaller producers. Previous studies by CPI/PUC-Rio show that credit
                provided to small and medium-sized producers increases agricultural productivity and alleviates
                deforestation pressures.6

                The Cerrado also stands out in the use of financing from private sources, with fewer government
                subsidies and less targeting. While Agricultural Credit Notes (Letra de Crédito do Agronegócio -
                LCA) and Rural Savings - Unrestricted7 have been on the rise, public banks – especially Banco
                do Brasil and Banco do Nordeste – remain the primary financial institutions for rural credit
                operations. Therefore, there is room to increase private sector participation and foster more
                competition among banks in the region.

                     BOX 1. MAIN CHARACTERISTICS OF RURAL CREDIT IN THE CERRADO
                     1. The volume of rural credit directed towards the Cerrado is proportional to the value
                        of its agricultural production: approximately a third of both the country’s rural credit
                        and agricultural production are in the biome. Most of the rural credit in the Cerrado is
                        channeled to crops: 68% of the total amount of contracts went to crop production in
                        the 2019/20 agricultural year.8 Soy accounts for 38% of the R$ 50 billion loaned for
                        crop production in the biome. In the rest of the country, soy accounts for only 28% of
                        the total credit amount destined to crops.

                     2. Rural credit is more concentrated in the Cerrado than in the rest of the country. In
                        2019/20, the average contract value in the Cerrado was R$ 224,000, 181% higher
                        than the average contract value in the aggregate for the other biomes. In addition to
                        being historically higher than in the rest of the country, the average value of contracts
                        in the Cerrado has been rising in recent years.

                     3. Credit volume varies considerably across the municipalities located in the Cerrado.
                        When analyzing the territorial distribution of the ratio between the volume of rural
                        credit and the Gross Value Added of agriculture, it appears that the central region (the
                        Brazilian states of Goiás, Mato Grosso, and Tocantins) makes more intensive use of
                        credit. Analysis at the state level indicates that in São Paulo, Tocantins, and Goiás, the
                        ratio between rural credit and the value of agricultural production is 0.98, 0.88, and
                        0.85 (respectively), whereas in Maranhão, Piauí, and Bahia, the ratios are 0.49, 0.48
                        and 0.42, in that order.

6 Assunção, Juliano and Priscila Souza. The Impacts of Rural Credit on Agricultural Outcomes and Land Use: An Analysis by Credit Lines, Producer Types
and Credit Uses. Rio de Janeiro: Climate Policy Initiative, 2020. bit.ly/3wCgn9s.
7 Agricultural Credit Notes is an instrument offered by public or private financial institutions for their clients to invest. Of the total collected, 35%
should be applied in rural credit, financing the agricultural sector. These resources are not linked to any program. Regarding Rural Savings, three
institutions follow the rules for Rural Savings: Banco da Amazônia, Banco do Nordeste, and Banco do Brasil. For these banks, it is mandatory to keep
59% of the rural savings deposits applied to rural credit for a year. Most of the funds are offered at subsidized interest (Rural Savings - Restricted)
and a small portion at free interest (Rural Savings - Unrestricted).
8 Central Bank of Brazil. Sistema de Operações do Crédito Rural e do Proagro. bit.ly/3em1xNX.

                                                                                                                                                            2
4. Though the high average value of contracts may be related to larger property sizes,
                       most of the credit in the biome is borrowed by individuals. In the 2019/20 agricultural
                       year, 99% of all credit operations and 85% of the total amount went to individuals,
                       and the rest to companies.

                    5. The share of public banks in the Cerrado rural credit market is considerably higher
                       than that of private banks. In the 2019/20 agricultural year, Banco do Brasil was
                       the main credit provider in 72% of the municipalities that make up the biome and
                       was responsible for 50% of the credit volume. Banco do Nordeste (another public
                       bank) was the largest lender in 19% of the municipalities, accounting for 5% of all
                       rural credit volume. Bradesco, a private bank, was the largest lender in only 1% of
                       the municipalities, with 7% of the credit volume. Overall, competition in rural credit
                       markets is low in the Cerrado, as in the rest of Brazil.

                    6. Despite the predominance of public banks, proportionally the Cerrado has attracted
                       more private resources for financing agriculture than the rest of the country. The
                       shares of LCA and Rural Savings - Unrestricted – which were close to zero in 2002/03
                       – increased to 19% and 15% of the total credit amount in the 2019/20 agricultural
                       year.9,10 On the other hand, Compulsory Resources and Rural Savings - Restricted have
                       been losing importance over the years, even though Compulsory Resources remain
                       the main source of financing in the biome.11 In 2019/20, these sources accounted for
                       25% and 13% of the total credit amount, respectively.

                    7. Penetration of the National Program for Family Farming (Programa Nacional
                       de Fortalecimento da Agricultura Familiar - PRONAF) in the Cerrado is limited,
                       corresponding to only 4% of the rural credit volume in 2019/20. In fact, while the
                       National Program to Support Medium-Sized Farmers (Programa Nacional de Apoio ao
                       Médio Produtor Rural - PRONAMP) is more relevant than PRONAF, it accounted for
                       only 13% of all credit in the same period. In the rest of Brazil, PRONAF and PRONAMP
                       were responsible for 22% and 16% of the credit volume, respectively. As such, most
                       of the rural credit in the Cerrado is not associated to programs and follows the rules
                       of the respective sources (76% of the total amount in the 2019/20 agricultural
                       year). Loans with these characteristics are more often associated with medium and
                       large-scale producers.

               1. AGRICULTURE IN THE CERRADO
               Soy is the Cerrado’s most important crop. In 2019, soy production in the biome amounted to
               R$ 63 billion (in actual amounts as of December 202012), which corresponds to 43% of the total
               value of crop in the biome and represents an increase of 159% from 2002. Elsewhere in Brazil,
               the value of soy production was R$ 69 billion in 2019, equivalent to 30% of the value of crop
               production in the rest of the country.13

9 Central Bank of Brazil. Registro Comum de Operações Rurais. bit.ly/3hFABe0.
10 Central Bank of Brazil. Sistema de Operações do Crédito Rural e do PROAGRO. bit.ly/3em1xNX.
11 Compulsory Resources consist of 27.5% of deposits in checking accounts collected during the period of one year by Brazilian financial institutions.
12 All figures in this report were deflated by the Extended National Consumer Price Index (Índice Nacional de Preços ao Consumidor Amplo - IPCA) and
are shown in constant December 2020 prices.
13 IBGE. Produção Agrícola Municipal. 2019. bit.ly/3yuDPYe.

                                                                                                                                                     3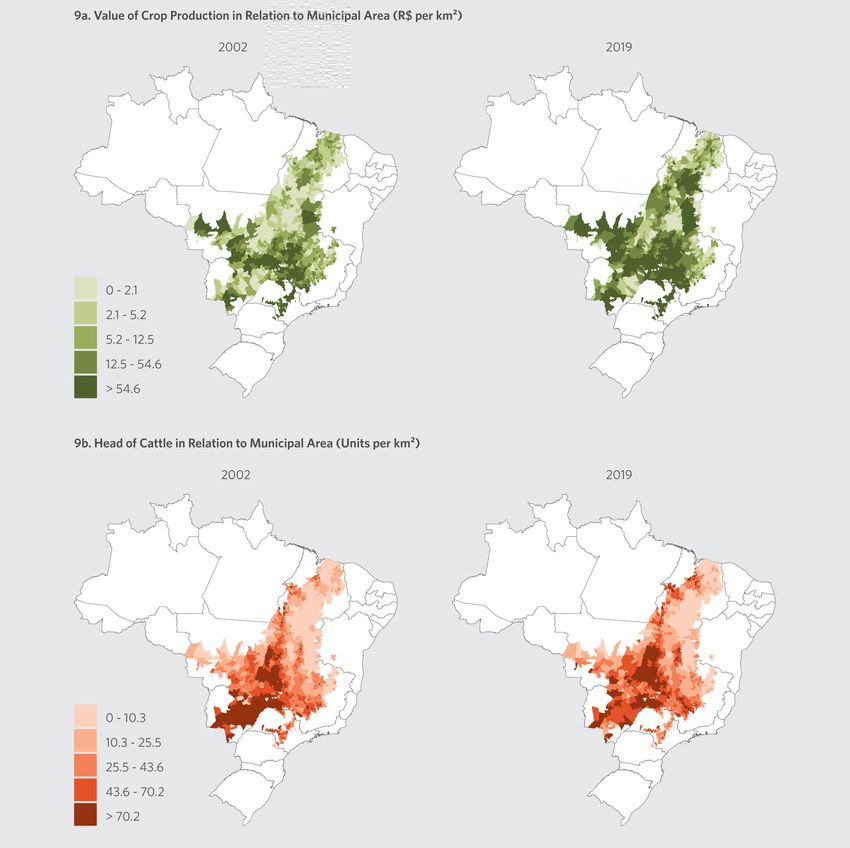
Figure 1 shows the main crop in produced value by municipality in the Cerrado. In addition to being
              the predominant product in most municipalities in 2002 and 2019 alike, soy gained additional
              relevance during this period. More specifically, soy overtook rice to become the primary crop in
              most of the municipalities in the states of Maranhão, Piauí, and Tocantins, and surpassed corn in
              parts of Goiás, Minas Gerais, and Tocantins. Even so, corn is the second biggest product in terms
              of produced value in the entire biome, reaching R$ 24 billion in 2019 (a 207% increase from
              2002). Sugarcane and cotton also stand out in the Cerrado. In 2019, these crops produced
              R$ 22 billion and R$ 15 billion in the biome, respectively (up 229% and 315% from 2002).

Figure 1. Main Crop by Municipality in the Cerrado, 2002 and 2019

Note: The main crop is the one with the highest production value in a given municipality for a given year. December
2020 constant values (inflation adjusted by IPCA).
Source: CPI/PUC-Rio with data from IBGE’s Produção Agrícola Municipal (PAM), 2021

              The growth of cattle ranching in the Cerrado was less pronounced. The region’s cattle herd grew
              6% between 2002 and 2019, while the rest of the country experienced a 22% increase in the same
              period.14 The area devoted to pasture in the biome in this period fell by 4%; however, in 2019, 70%
              of the area devoted to agriculture in the Cerrado was still used for pasture and 30% was used for
              crop production.15 Other biomes only experienced a 1% decline in pasture areas between 2002 and
              2019. In 2019, 73% of the area devoted to agriculture in the other biomes were used for pasture.

14 IBGE. Pesquisa da Pecuária Municipal. 2019. bit.ly/346Szi9.
15 MapBiomas. Cobertura de Estados & Municípios (V2). 2019. bit.ly/3iGk4HP.
                                                                                                                  4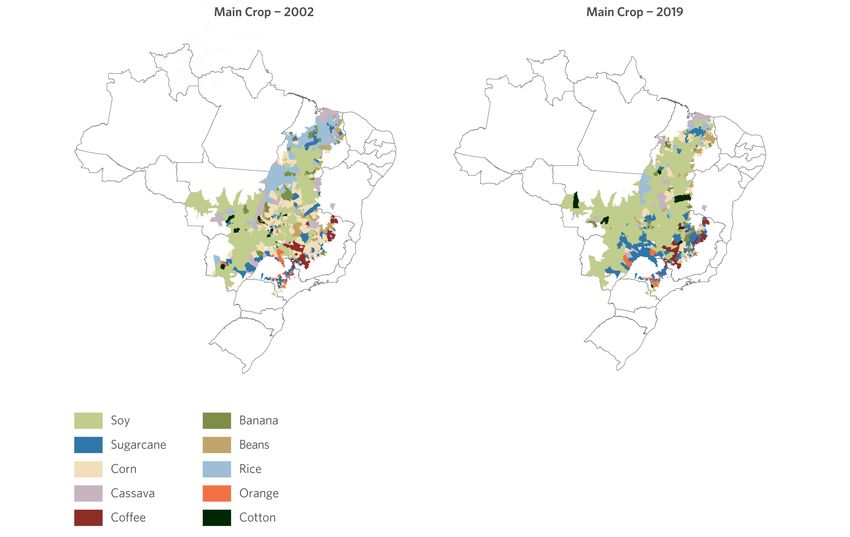
Within the Cerrado biome, the evolution of agricultural production in the MATOPIBA region also
                                              stands out.16 Between 2002 and 2019, the municipalities in MATOPIBA experienced a 299%
                                              growth in crop production value. In the other municipalities that make up the Cerrado region,
                                              the increase was 132%. In terms of value growth during the period, the crops that stood out in
                                              the region included cotton (+ 1,019%), soy (+ 437%), and corn (+ 220%). Livestock has also
                                              been growing at an accelerated pace. Cattle production in MATOPIBA increased 32% between
                                              2002 and 2019 compared to a 3% increase in the rest of the biome in the same period. Even so,
                                              the region’s overall contribution to the biome’s agricultural production remains limited: in 2019,
                                              MATOPIBA accounted for 16% of the value of crop production in the Cerrado, and 13% of the
                                              cattle herd. In 2002, the region’s shares were, respectively, 10% and 11%.

                                              Strong agricultural production – especially soy and corn – has helped to increase the Cerrado’s
                                              contribution to the value of Brazilian agricultural production over the years (Figure 2). On the
                                              other hand, the participation of the biome in cattle production – represented by the number of
                                              head of cattle – shows a downward trend in the period under analysis.

                                              Between 2002 and 2019, the value of crop production in the Cerrado increased 149%, reaching
                                              a total of R$ 147 billion in 2019. For the rest of Brazil, the growth rate was 60% and the total
                                              produced was R$ 231 billion in 2019. As a result, there was a robust 10 percentage point increase
                                              in the biome’s contribution to the value of Brazil’s crop production, from 29% in 2002 to 39% in
                                              2019. The ratio between head of cattle in the biome and the country’s total decreased slightly. In
                                              2002, the Cerrado accounted for 36% of all head of cattle; in 2019, it was 33%.

    Figure 2. Evolution
    Figure 2. Evolution of
                        of Cerrado’s
                           Cerrado’s Share
                                     Share in
                                            in Brazil’s
                                               Brazil’s Agricultural
                                                        AgriculturalProduction,
                                                                     Production,2002-2019
                                                                                2002-2019

                                       40.0                                                                                                    39%
Share in Agricultural Production (%)

                                       37.5    36%

                                       35.0

                                       32.5                                                                                                    33%

                                       30.0

                                       27.5    29%

                                       25.0
                                                02     03     04     05     06      07     08     09     10 011 012 2013 014 015 016 2017 018 019
                                              20     20     20     20     20     20      20     20     20   2   2        2   2   2        2   2

                                                                                                       Year

                                                                                 Head of Cattle               Crop Production (R$)

    Source: CPI/PUC-Rio with data from IBGE’s Produção Agrícola Municipal (PAM) and Pesquisa da Pecuária
    Source: CPI/PUC-Rio
    Municipal           with data from IBGE’s Produção Agrícola Municipal (PAM) and Pesquisa da Pecuária
              (PPM), 2021
    Municipal (PPM), 2021

    16 EMBRAPA (Empresa Brasileira de Pesquisa Agropecuária) defines MATOPIBA as the region formed by the state of Tocantins and parts of the states
    of Maranhão, Piauí and Bahia, where there has been strong agricultural expansion since the late 1980s, especially in grain production. Of the 228
    municipalities that make up MATOPIBA, 196 belong to the Cerrado biome. In this report, analyses referring to MATOPIBA cover only this smaller
    subset of municipalities.

                                                                                                                                                     5
BOX 2. THE INTENSIFICATION OF OFF-SEASON CORN PRODUCTION
Second crop corn has been gaining relevance in the Cerrado’s annual production. Also known as
off-season harvest or safrinha in Portuguese, the second crop harvest cycle begins after the main
harvest that usually involves soy or even corn itself. Though it takes place under less favorable
climate conditions, the off-season used to be an additional source of income for rural producers.
In recent years, however, there has been a change in producers’ behavior, who have prioritized
growing soy as the main crop and corn as the second crop. In 2003, 2 million hectares in the
Cerrado were devoted to the production of corn as a first crop, and 1.3 million as a second crop.
In 2019, 1.5 million hectares were used for grain production in the first harvest, and 6.7 million
hectares in the second harvest. Figure 3 below shows this evolution.
Figure 3. Evolution of the Area for Corn Production in the Cerrado, 2003-2019
Figure 3. Evolution of the Area for Corn Production in the Cerrado, 2003-2019
7
6
5
Millions (ha)
4
3
2
1
0
03 04 05 06 07 08 09 10
20
11 12 13 14 15 16 17 18 19
20 20 20 20 20 20 20 20 20 20 20 20 20 20 20 20
Year
First Harvest Second Harvest
Source: CPI/PUC-Rio with data from IBGE’s Produção Agrícola Municipal (PAM), 2021
Source: CPI/PUC-Rio with data from IBGE’s Produção Agrícola Municipal (PAM), 2021
This change of pattern in the area devoted to each crop is reflected in corn production. In 2003,
the second harvest accounted for 37% of the total amount of the grain produced in the Cerrado,
while 63% of the total was produced in the first harvest. In 2010, the second harvest surpassed
the yield of the first harvest in the biome and, in 2019, it accounted for 82% of the amount
produced in the Cerrado – a total of 41 million tons. In the same year, the first corn harvest in the
biome totaled 9 million tons. The off-season corn harvest has also grown in importance in the
rest of the country, increasing from 24% of all corn production in 2003 to 67% in 2019.
62. VOLUME AND COMPOSITION OF RURAL CREDIT
IN THE CERRADO
The rural credit market in the Cerrado is considerable and compatible with its agricultural
production size. The biome accounts for, approximately, a third of the credit volume and, also,
a third of Brazilian agricultural output. Rural credit in the Cerrado is more concentrated than in
the rest of the country. In addition to being historically higher than in the rest of the country, the
average value of contracts of rural credit in the Cerrado has been rising in recent years.
Regarding the composition of rural credit in the biome, soy and cattle boast the largest shares,
accounting for 26% and 25%, respectively, of the total value of rural credit in the Cerrado (Figure 4).
In the rest of Brazil, the percentages are lower: 18% for soy and 20% for cattle. Even so, other
crops are also relevant in terms of credit in the Cerrado, indicating the dynamism of agricultural
activities in the region. Among them is corn, which accounts for 10% of the total loaned amount,
and coffee, which accounts for a further 5%.
Breaking rural credit down by activity, cattle production is the primary activity by number of
contracts (70% of the total), while the remaining 30% correspond to crop production. The
statistics are the opposite in terms of the total value of operations – crop production accounts
for 68% of the total volume, and cattle accounts for 32%. This shows that the average contract
value for crops is much higher than for cattle in the Cerrado. The breakdown is similar for the rest
of the country: 64% of the amount of rural credit contracts were allocated to crop production in
2019/20, and 36% to livestock.
Figure 4. Rural Credit Composition by Product and Activity in the Cerrado, 2019/20
Figure 4. Rural Credit Composition by Product and Activity in the Cerrado, 2019/20
BY PRODUCT
NUMBER OF CONTRACTS RURAL CREDIT VOLUME (R$)
37.8%
25.9% 24.6%
21.7%
0.3%
1.1% 3.2% 2.6%
3.1%
3.8% 10.1%
5.0%
3.9%
6.1% 6.1% 7.9%
14.2%
7.9% 6.9% 7.8%
Soy Others Vehicles Sugarcane
Cattle Inputs, Equipments and Goods Coffee
Corn Infrastructure and Property Cotton
Figure 4 continues in the next page.
BY ACTIVITY
NUMBER OF CONTRACTS RURAL CREDIT VOLUME (R$)
7
69.8% 68.2%Soy Others Vehicles Sugarcane
Cattle Inputs, Equipments and Goods Coffee
Corn Infrastructure and Property Cotton
BY ACTIVITY
NUMBER OF CONTRACTS RURAL CREDIT VOLUME (R$)
69.8% 68.2%
30.2% 31.8%
Crop Livestock
Note: The category “Others” includes rice, milk, eucalyptus, and 140 other products.
Note: The category “Others” includes rice, milk, eucalyptus, and 140 other products.
Source: CPI/PUC-Rio with data from SICOR from Central Bank of Brazil, 2021
Source: CPI/PUC-Rio with data from SICOR from Central Bank of Brazil, 2021
As for the evolution of the total amount of rural credit contracts in the Cerrado, the trend is
positive until the 2013/14 agricultural year, when, following an economic crisis in the country, the
total value of contracts in the biome starts to decline. The indicator resumes growth in 2017/18,
reaching R$ 73 billion in 2019/20, a level close to the 2013/14 peak of R$ 74 billion.
Furthermore, there has been a concentration of financial flows. In 2019/20, the average contract
value of rural credit in the Cerrado was 181% higher than the average for other biomes (Figure 5).17
As in the rest of the country, the average value has increased in recent years. In the Cerrado, the
average value of rural credit contracts increased from R$ 96,000 in 2002/03 to R$ 224,000
in 2019/20 (an inflation-adjusted increase of 134%). For the rest of the country, the average
value was R$ 80,000 in 2019/20, up from R$ 36,000 in 2002/03 (an inflation-adjusted
increase of 119%).
17 Throughout this report, the biomes grouped together as “Other Biomes” include Amazon, Caatinga, Atlantic Forest, Pampa and Pantanal.
8Figure
Figure 5.
5. Evolution
Evolution of
of the
the Number,
Number, Volume, and Average
Volume and Average Value
Value of
of Rural
Rural Credit
Credit Contracts
Contractsin
inthe
theCerrado
Cerradoand
and
Other Biomes, 2002/03 – 2019/20
Other Biomes, 2002/03 – 2019/20
5a. Evolution of the Number of Contracts
3.5
3.0
Number of Contracts (Millions)
2.5
2.0
1.5
1.0
0.5
0
3 4 5 6 7 8 /09 /10 /11
/0 /0 /0 /0 /0 /0 /12 /13 /14 /15 /16 /17 /18 /19 20
0 02 003 004 005 006 007 008 009 2010 2011 2012 2013 2014 2015 2016 2017 2018 019/
2 2 2 2 2 2 2 2 2
Agricultural Year
Other Biomes Cerrado
5b. Evolution of the Volume of Contracts
160
140
120
100
Billions (R$)
80
60
40
20
0
03 4 05 6 07 8 09 10 11 2 13 4 15 16 17 8 19 0
02/ 03/0 04/ 05/0 06/ 07/0 08/ 09/ 010/ 011/1 012/ 13/1 14/ 15/ 16/ 017/1 18/ 19/2
20 20 20 20 20 20 20 20 2 2 2 20 20 20 20 2 20 20
Agricultural Year
Other Biomes Cerrado
Figure 5 continues in the next page.
Note: Data refer to rural credit contracts and considers working capital, investment, trade, and industrialization.
December 2020 constant values (inflation adjusted by IPCA).
Source: CPI/PUC-Rio with data form RECOR and SICOR from Central Bank of Brazil, 2021 9Figure 5. Evolution of the Number, Volume, and Average Value of Rural Credit Contracts in the Cerrado and
Other Biomes, 2002/03 – 2019/20
5c. Evolution of the Average Value of Contracts
250,000
200,000
Average Value of Contracts (R$)
150,000
100,000
50,000
0
/0
3
/0
4
/0
5
/0
6
/0
7
/0
8
/0
9 /10 /11 /12 /13 /14 /15 /16 /17 /18 /19 /20
0 02 003 004 005 006 007 008 009 2010 2011 2012 2013 2014 2015 2016 2017 2018 2019
2 2 2 2 2 2 2 2
Agricultural Year
Other Biomes Cerrado
Note: Data
Note: Data refer
refer to
to rural
rural credit
credit contracts
contracts and
and considers
consider working
workingcapital,
capital,investment, trade, and industrialization.
trade, and industrialization.
December 2020
December 2020 constant
constant values
values (inflation
(inflation adjusted
adjusted by
by IPCA).
IPCA).
Source: CPI/PUC-Rio with data from RECOR and SICOR
Source: CPI/PUC-Rio with data from RECOR and SICOR from from Central
Central Bank
Bank of
of Brazil,
Brazil,2021
2021
The higher average value of rural credit contracts in the Cerrado are tied to agricultural
establishments that are historically larger than elsewhere in the country (Figure 6). In 2017, the
average area of agricultural establishments18 in the Cerrado was 154 hectares, in contrast to
54 hectares in the other biomes.19 In the Cerrado, the average area of establishments devoted
to crop is very close to the average area devoted to livestock – 151 hectares on average for the
former and 155 hectares on average for the latter. In the rest of Brazil, the difference between the
two activities is significantly greater in terms of average establishment area: an average of 34
hectares for crop establishments and 74 hectares for establishments devoted to livestock.
Between the last two Agricultural Censuses (2006 and 2017), the average area of crop
establishments in the Cerrado increased by 45%, compared to 16% in the rest of the country.
As a result, the Cerrado became the biome where the establishments devoted to crop span
the largest average areas (in 2006, the Pantanal was number one in average area devoted to
crop production). On the other hand, the average area of establishments devoted to livestock
production decreased, which is tied to the intensification of production. There was a 14% drop
between 2006 and 2017 in the Cerrado, while in the other biomes the reduction was 2%.
18 Ratio between the total area of agricultural establishments (in hectares) and the number of producers.
19 IBGE. Agricultural Census. 2017. bit.ly/3oKt2ow. The reference period used in the 2017 Agricultural Census ranges from October 01, 2016, to
September 30, 2017.
10Figure 6. Average Area of Agricultural Establishments in the Cerrado and Other Biomes, 2006 and 2017
Figure 6. Average Area of Agricultural Establishments in the Cerrado and Other Biomes, 2006 and 2017
Cerrado Other Biomes
200
Agricultural Establishments (ha)
160
Average Area of
120
80
40
0
2006 2017 2006 2017
Year Year
Agriculture Cropland Cattle Farming
Source: CPI/PUC-Rio with data from IBGE’s 2006 and 2017 Agricultural Census, 2021
Source: CPI/PUC-Rio with data from IBGE’s 2006 and 2017 Agricultural Census, 2021
3. HETEROGENEITIES IN THE CERRADO BIOME
There is considerable heterogeneity between the municipalities that comprise the Cerrado. This
section analyzes the different characteristics of rural credit contracts in the Cerrado biome. The
Cerrado spans 10 states and the Federal District. In general, the biome encompasses only part of
each state. Table 1 shows the distribution – between Cerrado and other biomes – of the number
of municipalities, the area devoted to agriculture, the total area, the rural credit volume, and
the Gross Added Value of agriculture by state.20 The analyses below refer only to municipalities
classified as belonging to the biome.
Table 1. Number of Municipalities, Area Devoted to Agriculture, Total Area, Rural Credit Volume, and Gross
Value Added of Agriculture by State in the Cerrado and in Other Biomes, 2018
Area Devoted Rural Credit Gross Value Added
Number of to Agriculture Volume in of Agriculture in
Municipalities (km2) Total Area (km2) Millions (R$) Millions (R$)
Cerrado 18 32,842 106,527 3,917 9,402
Bahia
Other Biomes 399 201,646 458,196 2,847 11,357
Distrito Cerrado 1 2,566 5,761 314 1,115
Federal Other Biomes 0 0 0 0 0
Cerrado 242 212,980 337,210 18,359 21,487
Goiás
Other Biomes 4 2,253 2,916 118 213
Cerrado 124 42,748 214,882 2,857 5,834
Maranhão
Other Biomes 93 53,922 114,761 836 2,646
Table 1 continues in the next page.
20 States not included in the table do not have municipalities in the Cerrado biome. Data on Gross Value Added of Agriculture are available until 2018.
11Area Devoted Rural Credit Gross Value Added
Number of to Agriculture Volume in of Agriculture in
Municipalities (km2) Total Area (km2) Millions (R$) Millions (R$)
Cerrado 61 140,541 335,206 12,010 17,330
Mato Grosso
Other Biomes 80 182,002 568,001 9,075 10,671
Mato Grosso Cerrado 51 153,440 216,684 8,880 15,537
do Sul Other Biomes 28 46,643 140,461 2,613 4,410
Cerrado 256 165,694 325,770 14,452 18,477
Minas Gerais
Other Biomes 597 153,250 260,751 9,905 12,094
Cerrado 1 455 1,453 71 102
Paraná
Other Biomes 398 124,425 197,852 29,399 39,543
Cerrado 108 16,644 135,375 1,870 3,920
Piauí
Other Biomes 116 18,099 116,241 300 918
Cerrado 84 31,281 45,834 6,388 6,517
São Paulo
Other Biomes 561 138,841 202,370 17,411 27,802
Cerrado 116 72,056 253,433 3,633 4,113
Tocantins
Other Biomes 23 16,722 24,287 308 457
Note: December 2020 constant values (inflation adjusted by IPCA).
Source: CPI/PUC-Rio based on data from IBGE, MapBiomas and SICOR from Central Bank of Brazil, 2021
In the 2019/20 agricultural year, most of the amount of credit contracts in the Cerrado was
concentrated in the states of Goiás (25%), Minas Gerais (21%), Mato Grosso (14%), and Mato
Grosso do Sul (14%), as shown in Figure 7. As such, four states accounted for 74% of all the
credit volume in the biome. This share is similar to the shares of these states’ agriculture areas
within the Cerrado (77% of the total biome).
There are striking differences in the ratio between rural credit and Gross Value Added of
agriculture in the Cerrado states. In 2018, while São Paulo, Tocantins, and Goiás had ratios of
0.98, 0.88 and 0.85 (respectively), Maranhão, Piauí, and Bahia had ratios of 0.49, 0.48 and
0.42, in that order. This indicates significant heterogeneity in access to credit across the different
regions of the Cerrado.
Municipalities in the MATOPIBA region are increasing their share in the total amount of loans in
the Cerrado, although the current percentage remains relatively modest. In 2002/03, MATOPIBA
accounted for 9% of the total value of operations in the Cerrado. By 2019/20, it had risen to
16%. Credit in this region is mainly used for soy (40% of the total amount), cattle (18%), and
infrastructure and real estate products (11%). In comparison to the rest of the biome, therefore,
soy has a bigger share and cattle has a smaller share.
The analysis of the ratio between rural credit and agricultural Gross Value Added shows that
credit use in MATOPIBA appears to be less intense than in other Cerrado municipalities. In 2018,
this indicator had a value of 0.55 in MATOPIBA, compared with 0.74 in the rest of the biome.
12Figure 7. Evolution of Rural Credit Volume by State in the Cerrado, 2002/03 – 2019/20
Figure 7. Evolution of Rural Credit Volume by State in the Cerrado, 2002/03 – 2019/20
20
18
16
14
12
Billions (R$)
10
8
6
4
2
0
3 4 5 6 7 8 9 0 11 12 3
/1 3/1
4 5
/1 5/1
6 7
/1 7/1
8
/1
9 20
2 /0 3/0 4/0 5/0 6/0 7/0 8/0 9/1 1 0/ 1 1/ 1 2 1 1 4 1 1 6 1 18 019/
0 0 0 0 0 0 0 0 0 0 2 0 2 0 0 0 0 0 0 2 0 0
20 20 20 20 20 2 20 2 2 2 2 2 2 2 2
Agricultural Year
Goiás Mato Grosso do Sul Bahia Distrito Federal
Minas Gerais São Paulo Maranhão Paraná
Mato Grosso Tocantins Piauí
Note: Data
Note: The data
referrefer to rural
to rural credit
credit contracts
contracts and consider
and considers working
working capital,
capital, investment,
investment, trade,
trade, andand industrialization
industrialization.
purposes. Amounts deflated by the IPCA, using December
December 2020 constant values (inflation adjusted by IPCA). 2020 as reference.
Source: CPI/PUC-Rio
Source: CPI/PUC-Rio with
with data
data from
from RECOR
RECOR and
and SICOR
SICOR from
fromCentral
CentralBank
Bankof ofBrazil,
Brazil,2021
2021
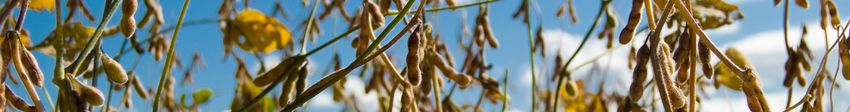
The intensity of credit use in agriculture is also analyzed geographically in Figure 8, which shows
the territorial distribution of the ratio between the volume of municipal rural credit and the Gross
Added Value of municipal agriculture for the years 2002 and 2018. Over those years, there
was a noticeable increase in the use of rural credit in relation to the agricultural added value.
Additionally, the maps suggest heterogeneity in this indicator as well. The central region (Goiás,
Mato Grosso, and Tocantins) is more credit intensive. On the other hand, more extreme regions
like Maranhão show much lower credit intensity than the rest of the biome. This pattern holds
true between the years under analysis.
13Figure 8. Intensity of Rural Credit Use, 2002 and 2018
Note: The data refer to the ratio of the Volume of Rural Credit and Gross Value Added of agriculture by
municipality. The intervals in the maps were defined based on the observed quintiles of this ratio in 2018. The
municipalities painted in white had zero amount of credit or it was impossible to determine the amount borrowed
from the database. Amounts deflated by the IPCA, using December 2020 as reference.
Source: CPI/PUC-Rio with data from IBGE and from RECOR and SICOR from Central Bank of Brazil, 2021.
BOX 3. THE GEOGRAPHICAL EVOLUTION OF PRODUCTION IN THE CERRADO
Figure 9 shows the intensity of agricultural production at the municipal level in 2002 and
2019. Figure 9a shows the distribution (by municipality) of the ratio between the value of crop
production and the area of each municipality. Figure 9b shows the ratio between the head of
cattle and the area of each municipality. Between 2002 and 2019, there was an increase in the
value of crop production per area, especially on the border between Goiás and Minas Gerais, and
in a good part of the border regions of the states that make up MATOPIBA. It is the opposite for
cattle. The scenario is quite similar between the years and, in some regions (e.g., Mato Grosso do
Sul), the number of cattle per area has declined.
14Figure 9. Intensity of Agricultural Production in the Cerrado, 2002 and 2019
Note: December 2020 constant values (inflation adjusted by IPCA).
Source: CPI/PUC-Rio with data from IBGE’s Produção Agrícola Municipal (PAM) and Pesquisa da Pecuária
Municipal (PPM), 2021
154. CREDIT USE AND BORROWERS
The bigger properties and the higher average value of rural credit contracts in the Cerrado do
not translate into greater participation of corporations in the biome’s rural credit market. In the
2019/20 agricultural year, 99% of the number – and 85% of the amount – of credit operations in
the Cerrado were directed to individuals (Figure 10). For the rest of the country, the statistics are
99.6% and 73%, respectively. The greater representation of corporations in the total amount of
transactions compared to their share of the number of contracts reflects a higher average value
of rural credit contract for corporations.
Figure 10. Number of Contracts and Rural Credit Volume by Producer Type in the Cerrado and
Other
FigureBiomes, 2019/20
10. Number of Contracts and Rural Credit Volume by Producer Type in the Cerrado and
Other Biomes, 2019/20
CERRADO
NUMBER OF CONTRACTS RURAL CREDIT VOLUME (R$)
15.0%
0.7% 99.3%
85.0%
Firms Individuals
OTHER BIOMES
NUMBER OF CONTRACTS RURAL CREDIT VOLUME (R$)
26.8%
0.4% 99.6%
73.2%
Firms Individuals
Source: CPI/PUC-Rio with data from SICOR from Central Bank of Brazil, 2021
Source: CPI/PUC-Rio with data from SICOR from Central Bank of Brazil, 2021
16Most rural credit in the Cerrado is directed toward working capital and investment (Figure 11),
which is also the case elsewhere in the country. These two uses together accounted for 98% of
the number – and 88% of the amount – of contracts in the biome in the 2019/20 agricultural
year. When these numbers are broken down, credit used for investment accounted for 58% of
the number and 25% of the amount of contracts in the Cerrado – numbers very close to the
average for the rest of the country.
The statistics for credit used for working capital, on the other hand, are slightly divergent. In
2019/20, the credit used for this purpose accounted for 41% of the number of Cerrado contracts
(compared to 43% in the rest of the country) and 63% of the credit amount in the municipalities
located in the biome (compared to 53% in the rest of the country). Thus, though the working
capital purpose may be similar in terms of the number of contracts, the credit amount used for
this purpose is proportionally higher for the Cerrado.
This difference is offset by the lower share of the amounts of credit used for commercialization
and industrialization purposes,21 which are typical of a more business-oriented agriculture. In
2019/20, 1% of the number – and 10% of the amount – of contracts in the Cerrado were intended
for commercialization purposes. Elsewhere in the country the numbers were 1% and 13%,
respectively. Credit for industrialization accounted for 0.05% of the number – and 2% of the
amount – of contracts in the Cerrado, compared to 0.1% and 8% in the rest of the country.
Figure 11. Number of Contracts and Rural Credit Volume by Credit Type in the Cerrado, 2002/03 – 2019/20
Figure 11. Number
11a. Number of Contracts and Rural Credit Volume by Credit Type in the Cerrado, 2002/03 – 2019/20
of Contracts
700,000
600,000
Number of Contracts
500,000
400,000
300,000
200,000
100,000
0
03 4 5 6 07 8 9 10 11 12 13 14 15 16 17 18 19 0
02/ 03/0 04/0 05/0 06/ 07/0 08/0 09/ 010/ 011/ 012/ 013/ 014/ 015/ 016/ 017/ 018/ 019/2
20 20 20 20 20 20 20 20 2 2 2 2 2 2 2 2 2 2
Agricultural Year
Working Capital Investment Trade Industrialization
Figure 11 continues in the next page.
11b. Rural Credit Volume
80
21 According to the Rural Credit Manual (Manual de Crédito Rural), the purpose of commercialization credit is to provide rural producers or their
70 cooperatives with the resources necessary to commercialize their products on the market. Credit for industrialization is intended for rural
agricultural
producers or cooperatives seeking to industrialize agricultural products, provided that, at least, 50% of the production to be processed is produced by
60 itself (or by associates).
the company
illions (R$)
50 17
40Agricultural Year
Working Capital Investment Trade Industrialization
11b. Rural Credit Volume
80
70
60
Billions (R$)
50
40
30
20
10
0
3 4 5 6 7 8 9 /10 /11 /12 /13 /14 /15 /16 /17 /18 /19 0
/0 /0 /0 /0 /0 /0 /0 /2
0 02 003 004 005 006 007 008 009 2010 2011 2012 2013 2014 2015 2016 2017 2018 2019
2 2 2 2 2 2 2 2
Agricultural Year
Working Capital Investment Trade Industrialization
Note: December
Note: December 2020
2020 constant
constant values
values (inflation
(inflation adjusted
adjusted by
by IPCA).
IPCA).
Source: CPI/PUC-Rio
Source: CPI/PUC-Rio with
with data
data from
from RECOR
RECOR and and SICOR
SICOR from
from Central
Central Bank
Bank of
of Brazil,
Brazil,2021
2021
5. CREDIT DISTRIBUTION CHANNELS
The share of public banks in the Cerrado rural credit market is considerably higher than that of
private banks. Figure 12 shows the three main financial institutions offering rural credit in each
Cerrado municipality, defined as those that lend the largest volume of credit locally. Overall,
competition in rural credit markets is low in the Cerrado, much like in the rest of Brazil.
In most municipalities, the main credit provider is Banco do Brasil. Banco do Nordeste and
Bradesco are also relevant, despite being the main credit provider in only a significantly smaller
number of municipalities compared to Banco do Brasil.
18Figure 12. Main Rural Credit Provider by Municipality in the Cerrado, 2019/20
Note: The main financial institutions are defined as those that lend the highest volume of credit in each municipality.
Source: CPI/PUC-Rio with data from SICOR from Central Bank of Brazil, 2021
19Figure 13 shows that the competitive landscape has remained unchanged since the 2002/03
agricultural year, with the predominance of public banks. In 2019/20, Banco do Brasil was the
main provider of rural credit in 757 municipalities, while Banco do Nordeste was the predominant
provider in 197 municipalities, which means that one of these two institutions is the main credit
provider for more than 90% of the municipalities of the biome. These same banks accounted for
50% and 5% (respectively) of the volume borrowed in that agricultural year.
Bradesco is the largest lender in only 13 municipalities but is the second largest in 223
municipalities and the third largest in 195 municipalities. This explains Bradesco’s relatively high
share of credit volume in the biome. In 2019/20, the bank was responsible for 7% of the total
amount borrowed in the Cerrado. The other financial institutions accounted for the remaining
38%.22 In any case, they do not enjoy the same degree of capillarity as the main prominent
financial institutions, which prevents many producers from having access to competitors in the
credit market. Promoting greater competition among financial institutions – through the creation
of instruments to ensure greater participation by private banks and cooperatives – can improve
the efficiency of the credit distribution system in the region.
The next section shows that there was a relevant increase in private funding sources for rural
loans. However, public banks, especially Banco do Brasil and Banco do Nordeste, are still the main
financial institutions in the provision of rural credit. Thus, there is room for an increase of private
sector participation and for more banking competition in the region.
Figure 13. Number of Municipalities and Share of Total Volume by Financial Institution in the Cerrado,
Figure 13. Number of Municipalities and Share of Total Volume by Financial Institutions in the Cerrado,
2002/03-2019/20
2002/03 – 2019/20
13a. Number of Municipalities by Main Financial Institution
850
765
680
Number of Municipalities
595
510
425
340
255
170
85
0
3 4 5 6 7 8 /09 /10 /11
/0 /0 /0 /0 /0 /0 /12 /13 /14 /15 /16 /17 /18 /19 20
0 02 003 004 005 006 007 008 009 2010 2011 2012 2013 2014 2015 2016 2017 2018 019/
2 2 2 2 2 2 2 2 2
Agricultural Year
Banco do Brasil Banco do Nordeste Bradesco
Figure 13 continues in the next page.
22 Among
13b. Sharethem is Santander,
of Credit Volumewith
by 4.7% of theInstitution
Financial total amount borrowed in the biome, and Caixa Econômica Federal, with 3.7%.
20
7002 03 04 05 06 07 08 0 1 11 012 013 014 015 016 017 018 019
20 20 20 20 20 20 20 20 20 20 2 2 2 2 2 2 2 2
Agricultural Year
Banco do Brasil Banco do Nordeste Bradesco
13b. Share of Credit Volume by Financial Institution
70
60
50
Credit Volume (%)
40
30
20
10
0
3 4 5 6 7 8 /09 /10
/0 /0 /0 /0 /0 /0 /11 /12 /13 /14 /15 /16 /17 /18 /19 20
0 02 003 004 005 006 007 008 009 2010 2011 2012 2013 2014 2015 2016 2017 2018 019/
2 2 2 2 2 2 2 2 2
Agricultural Year
Banco do Brasil Banco do Nordeste Bradesco
Source: CPI/PUC-Rio with data from RECOR and SICOR from Central Bank of Brazil, 2021
Source: CPI/PUC-Rio with data from RECOR and SICOR from Central Bank of Brazil, 2021
6. SOURCES OF RURAL CREDIT FUNDS
Despite the prevalence of public banks, the Cerrado stands out in terms of use of private and less
subsidized funding sources. In the 2019/20 agricultural year, the three main sources of funds for
rural credit in the Cerrado were Compulsory Resources, LCA, and Rural Savings - Unrestricted.
Elsewhere in the country, Compulsory Resources also feature as the main source of funds, with
Rural Savings - Restricted in second place and LCA in third.
The other relevant sources for the Cerrado are Rural Savings - Restricted and Unrestricted
Resources. Constitutional Funds for the Northeast, Midwest, and North, on the other hand, are
present in certain regions of the biome, but are of lesser importance for the biome as a whole.
Figure 14 shows that earmarked resources have been losing ground over time to private resources
in the Cerrado. Compulsory Resources and Rural Savings - Restricted accounted for 43% and
21% of the credit value in the biome in 2002/03 and 25% and 13% in 2019/20, respectively. On
the other hand, LCA (which did not exist in 2002/03)23 and Rural Savings - Unrestricted – which
accounted for 0.04% in 2002/03 – increased to 19% and 15% in 2019/20. In the rest of the
country, the contribution of these two sources to the total value of rural credit increased from 0%
and 0.05% in 2002/03 to 12% and 11% in 2019/20, in that order. The Cerrado has attracted more
private resources for financing its agriculture than the rest of the country.
23 The LCA was created in 2004, and its contribution only became non-negligible as of the 2014/15 agricultural year, when it accounted for 0.7%
of rural credit funds in the Cerrado and 0.4% elsewhere in the country. The share of this particular source of funds increased significantly in the
following agricultural year, reaching 7% and 9% in the Cerrado and the rest of the country, respectively.
21Figure 14. Evolution of Rural Credit Volume by Funding Source in the Cerrado, 2002/03 – 2019/20
Figure 14. Evolution of Rural Credit Volume by Funding Source in the Cerrado, 2002/03 – 2019/20
80
70
60
50
Billions (R$)
40
30
20
10
0
3 4 5 6 7 8 /09 /10 /11 20
/0 /0 /0 /0 /0 /0 /12 /13 /14 /15 /16 /17 /18 /19
0 02 003 004 005 006 007 008 009 2010 2011 2012 2013 2014 2015 2016 2017 2018 019/
2 2 2 2 2 2 2 2 2
Agricultural Year
Compulsory Resources Rural Savings – Restricted BNDES – FINAME
LCA Constitutional Funds Other Funding Sources
Rural Savings – Unrestricted Unrestricted Resources
Note: December
Note: 2020
December constant
2020 values
constant (inflation
values adjusted
(inflation by IPCA).
adjusted The “Constitutional
by IPCA). Funds”Funds”
The “Constitutional category includes:
category includes:
TheThe
Constitutional Funds
Constitutional for the
Funds forMidwest, for the
the Midwest, forNorth and for
the North andthe
forNortheast. The “Other
the Northeast. Funding
The “Other Sources”
Funding Sources”
category includes:
category BNDES
includes: - Unrestricted,
BNDES External
- Unrestricted, Funding,
External StatesStates
Funding, and Municipalities, FAT, FTRA,
and Municipalities, FUNCAFÉ,
FAT, FTRA, HybridHybrid
FUNCAFÉ,
Instrument (IHCD),
Instrument Unrestricted
(IHCD), Resources
Unrestricted – Subsidized,
Resources National
– Subsidized, Treasury,
National Commodity
Treasury, Fund, DER,
Commodity Fund,Mandatory
DER, Mandatory
FAC,FAC,
Extra Market, INCRA, and PIS/PASEP.
Extra Market, INCRA, and PIS/PASEP.
Source: CPI/PUC-Rio
Source: CPI/PUC-Riowithwith
datadata
fromfrom
RECOR and SICOR
RECOR from from
and SICOR Central Bank Bank
Central of Brazil, 2021 2021
of Brazil,
Compulsory Resources are the first or second most relevant source of funds in terms of value in
all states except Maranhão (where it is only the fourth biggest source). Constitutional Funds are
the main source of funds for the Northern and Northeastern states located in the biome.24 LCA is
more relevant in the Midwest, Southeast, and South.25
24 Tocantins, Bahia, Maranhão, and Piauí.
25 Federal District, Goiás, Mato Grosso, Mato Grosso do Sul, Minas Gerais, São Paulo, and Paraná.
227. RURAL CREDIT PROGRAMS
The most striking difference between the Cerrado and other biomes is the lower relevance of
credit for small and medium producers (from PRONAF and, to some extent, also PRONAMP).
In the 2019/20 agricultural year, PRONAMP, PRONAF and MODERFROTA – the three programs
with the highest volumes – were responsible for, respectively, 13%, 4%, and 3.8% of the total
amount of credit operations in the biome. In the rest of the country, loans associated with
PRONAMP, PRONAF, and MODERFROTA accounted for 16%, 22%, and 3%, respectively.
It should be noted that most of the loaned amount (76% in the 2019/20 agricultural year) was
not tied to a specific program. These loans are generally associated with larger producers. In the
rest of the country, loans not linked to programs constituted 56% of the total amount in 2019/20.
This difference is associated with significantly higher average contract values than in the rest of
the country, as noted above. When credit is not linked to a program, the contract follows the rules
and conditions of the source of funds.
An analysis of the temporal evolution in the Cerrado reveals a 12 percentage point increase in
the participation of credit operations tied to PRONAMP between the 2002/03 and 2019/20
agricultural years. In 2019/20, PRONAF and MODERFROTA accounted for levels like those of
2002/03 (a variation less than one percentage point).
Public policy should focus on whether smaller producers have access to adequate financing for
their operations. Previous studies by CPI/PUC-Rio show that when small and medium sized
producers have better access to credit they intensify their production, leading to improved land
use and less deforestation.26
Finally, it is important to note the growth of the National Program for Low-Carbon Emissions
in Agriculture (Programa para Redução da Emissão de Gases de Efeito Estufa na Agricultura – ABC
Program). In 2010/11, the first agricultural year in the program’s historical series, the amount
borrowed in the Cerrado biome and linked to the ABC Program was R$ 19 million. By 2019/20 it
had reached R$ 1 billion. As a result, in 2019/20 the ABC Program represented 1.5% of the total
amount borrowed.
26 Assunção, Juliano and Priscila Souza. The Impacts of Rural Credit on Agricultural Outcomes and Land Use. Rio de Janeiro: Climate Policy Initiative,
2020. bit.ly/3i94BOs.
23Figure 15. Evolution of Rural Credit Volume by Credit Line in the Cerrado, 2002/03 – 2019/20
Figure 15. Evolution of Rural Credit Volume by Credit Line in the Cerrado, 2002/03 – 2019/20
80
70
60
50
Billions (R$)
40
30
20
10
0
3 4 5 6 7 8 9 0 1 2 13 14 5 16 17 /18 9 0
2 /0 3/0 4 /0 5/0 6/0 7/0 8/0 9/1 10/1 11/1 2/ 13/ 4 /1 5/ 6/ 1 7 8 /1 9/2
0 0 0 0 1 1 1 1 1 1
20 20
0
20
0
20
0
20
0
20 20
0
20 20 2 20 20 20 20 20 20 20 20
Agricultural Year
Loans with Program Rules Loans with Funding Source Rules
PRONAMP LCA Rural Savings – Unrestricted
PRONAF Compulsory Resources Other Funding Sources
MODERFROTA Rural Savings – Restricted
Other Programs Constitutional Funds
ABC Unrestricted Resources
Note: December 2020 constant values (inflation adjusted by IPCA). The “Constitutional Funds” category includes:
The Constitutional
Note: Fund credit
Data built for rural for thecontracts.
Midwest,December
for the North,
2020and for the values
constant Northeast. The “Other
(inflation Funding
adjusted Sources”
by IPCA). The
category includes: BNDES - Unrestricted, States and Municipalities, FAT, FTRA, FUNCAFÉ, Hybrid Instrument
“Constitutional Funds” category includes: The Constitutional Fund for the Midwest, for the North, and for the
(IHCD), Non-Controlled
Northeast. Resources
The category "Other – Subsidized,
Funding National BNDES
Sources" includes: Treasury, CommoditiesStates
– Unrestricted, Fund, DER, Mandatory FAC, Extra
and Municipalities,
Market,
FAT, FTRA,INCRA, and PIS/PASEP.
FUNCAFÉ, The “Other
Hybrid Instrument Programs”
(IHCD), category
Unrestricted includes:
Resources MODERAGRO,
– Subsidized, MODERINFRA,
National Treasury, PROCAP
AGRO, PROCAP
Commodity CRED,Compulsory
Fund, DER, INOVAGRO, PRODECOOP,
FAC, Extra Market, PRORENOVA, and over 100
INCRA, and PIS/PASEP. other
The programs.
category "Other Programs"
Source: CPI/PUC-Rio with data from RECOR and SICOR from Central Bank of Brazil,
includes: MODERAGRO, MODERINFRA, PROCAP AGRO, PROCAP CRED, INOVAGRO, PRODECOOP, PRORENOVA, 2021
and more then 100 other programs.
Source: CPI/PUC-Rio with data from RECOR and SICOR from Central Bank of Brazil, 2021
24The total amount of credit operations without a specific program is predominant across all states
of the biome. Regarding contracts linked to programs, PRONAMP ranks first in the states of
Bahia, Goiás, Mato Grosso, Mato Grosso do Sul, Minas Gerais, Paraná, São Paulo, and Tocantins.
PRONAF takes the lead in the states of Maranhão and Piauí. MODERFROTA, in turn, is the
number one such program in the Federal District; however, it accounts for only 4% of the total
contracted amount, while contracts with no program attached account for 93% of the amount.
CONCLUSION
This brief examines rural credit in the Cerrado biome, adding depth to previous CPI/PUC-Rio
analyses of credit at the national level and enabling a comparison with credit in the Amazon.27
Rural credit in the Cerrado has grown in recent years, and the average contracted amount is
significantly higher than in the rest of the country. Thus, there has been a concentration of
financial flows associated with the increase in soy production.
There is also a low volume of credit available for small and medium producers. Public policy
should pay attention to the issue of credit access for small and medium-sized producers. Previous
studies by CPI/PUC-Rio show that credit for these smaller producers is essential to achieving
productivity gains in agriculture and reducing pressures on native vegetation.
The Cerrado has experienced an increase in private funds for credit, with an emphasis on LCA
and Rural Savings - Unrestricted. Compulsory Resources and Rural Savings - Restricted, on
the other hand, have seen a reduction in their participation in the total amount of operations,
although they remain significant as credit sources.
Nonetheless, this increase in private resources has not yet had a significant impact with regard
to the financial institutions that dominate credit distribution in the region. In recent decades, the
predominant institution has been Banco do Brasil, followed far behind (i.e., at below 10% each)
by Bradesco and Banco do Nordeste, showing that there is very little competition and limited
options for rural producers. As such, there seems to be room for increasing the participation of
the private sector and developing a more dynamic and less concentrated credit market.
Finally, native vegetation areas in the biome are shrinking with each passing year. With
sustainability issues increasingly relevant to international markets and trade agreements, a
more transparent and efficient credit policy can help preserve this biome. Access to credit must
be directed to environmentally responsible producers who employ good land use practices and
comply with the Forest Code, thus contributing to sustainable development. With all this, public
policy should be able to generate incentives to promote economic and social well-being.
27 Souza, Priscila et al. 6 Peculiarities of Rural Credit in the Amazon: New Research Shows Credit Restrictions and Extensive Land Use in Agriculture. Rio de
Janeiro: Climate Policy Initiative, 2021. bit.ly/3kdxUlC.
25AUTHORS
PRISCILA SOUZA
Head of Policy Evaluation, Financial Instruments, CPI/PUC-Rio
priscila.souza@cpiglobal.org
BARBARA INTROPIDI
Assistant Analyst, Financial Instruments, CPI/PUC-Rio
GABRIEL DE CAMPOS
Assistant Analyst, Financial Instruments, CPI/PUC-Rio
PEDRO VOGT
Assistant Analyst, Financial Instruments, CPI/PUC-Rio
JULIANO ASSUNÇÃO
Executive Director, CPI/PUC-Rio
The authors would like to thank Solange L. Gonçalves, Eloiza R. F. de Almeida, and Nathalia Lima de Oliveira for research assistance, Natalie
Hoover El Rashidy, Giovanna de Miranda, and Jennifer Roche for the editing and revision of the text and Nina Oswald Vieira and Matheus
Cannone for formatting and graphic design.
Suggested citation
Souza, Priscila, Barbara Intropidi, Gabriel de Campos, Pedro Vogt, and Juliano Assunção. 7 Peculiarities of Rural Credit in
the Cerrado: Private Resources Attracted to Finance Large Producers Contrast with Scarcity of Credit for Family Farming. Rio de
Janeiro: Climate Policy Initiative, 2021.
AUGUST 2021
Climate Policy Initiative (CPI) is an analysis and advisory organization with deep expertise in finance and policy. Our mission is to help
governments, businesses, and financial institutions drive economic growth while addressing climate change. In Brazil, CPI partners with the
Pontifical Catholic University of Rio de Janeiro (PUC-Rio). This work is funded by Colaboração para Florestas e Agricultura (CFA), WWF-Brasil.
This publication does not necessarily represent the view of our funders and partners.
Contact CPI/PUC-Rio: contato.brasil@cpiglobal.org
www.climatepolicyinitiative.org
Content licensed under Creative Commons Attribution 4.0 International. The texts in this publication may be reproduced in whole
or in part provided that the source and the respective authors are cited.
26You can also read