Review of Illiquid Asset Classes - Rhode Island State Investment Commission Los Angeles New York - Office of the General Treasurer ...

Page created by Freddie Turner
 
CONTINUE READING
Review of Illiquid Asset Classes - Rhode Island State Investment Commission Los Angeles New York - Office of the General Treasurer ...
Los Angeles   •   New York

Review of Illiquid Asset Classes

Rhode Island State Investment Commission

Tom Lynch, Senior Managing Director, CFA

February 27, 2019
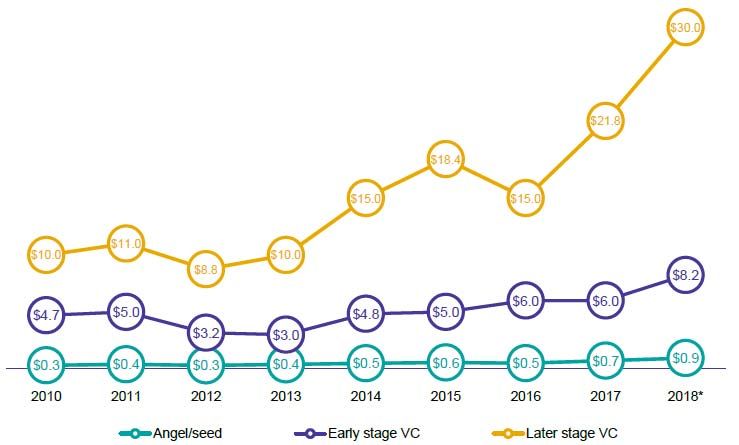
Review of Illiquid Asset Classes - Rhode Island State Investment Commission Los Angeles New York - Office of the General Treasurer ...
Table of contents
Section 1        Private Equity……………………….…………………….. …………………………..                                                           3

Section 2        Opportunistic Credit………………….………………………………………………..                                                          9

Section 3        Non-Core Real Estate……………………..…………….……............................. …                                    15

Section 4        Private Credit..………………… ………………………………………………………                                                            19

Section 5         Infrastructure …………………………………………………..…………………..… .                                                        24

Appendix

                 ERSRI Target Asset Allocation……… ..….. ………….……............................. …                            30

                 Secondary Investing…………… ………….…………………………………………                                                           32

                  Private Asset Markets Outlook………………………………..…………………..… . 36

    Notes:
    •   Due to the lag in reporting for illiquid asset classes, all market values and performance information are as of
        September 30, 2018
    •   Unless otherwise noted, all performance information is net of fees and annualized

2
Review of Illiquid Asset Classes - Rhode Island State Investment Commission Los Angeles New York - Office of the General Treasurer ...
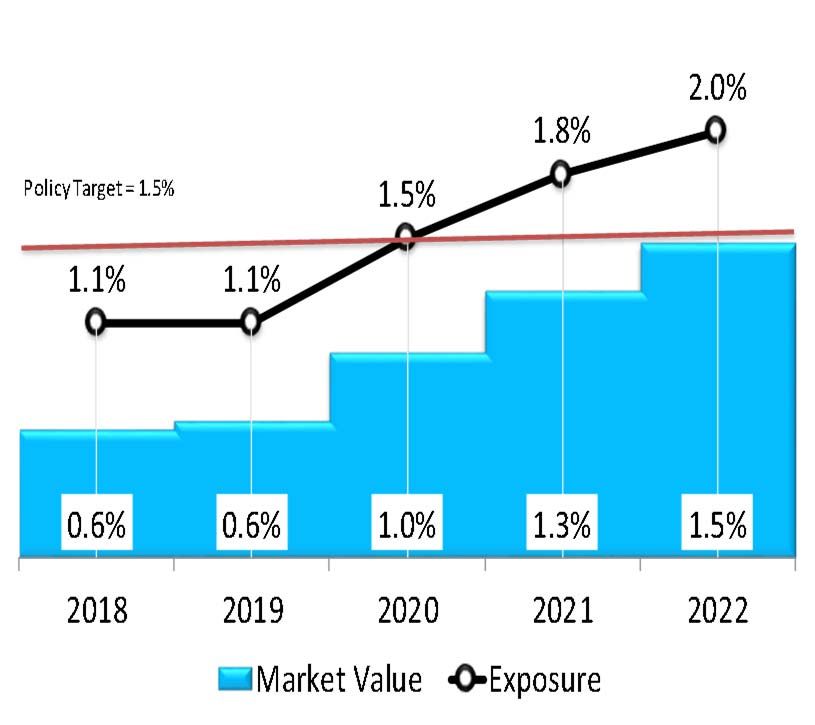
Section 1: Private Equity
Review of Illiquid Asset Classes - Rhode Island State Investment Commission Los Angeles New York - Office of the General Treasurer ...
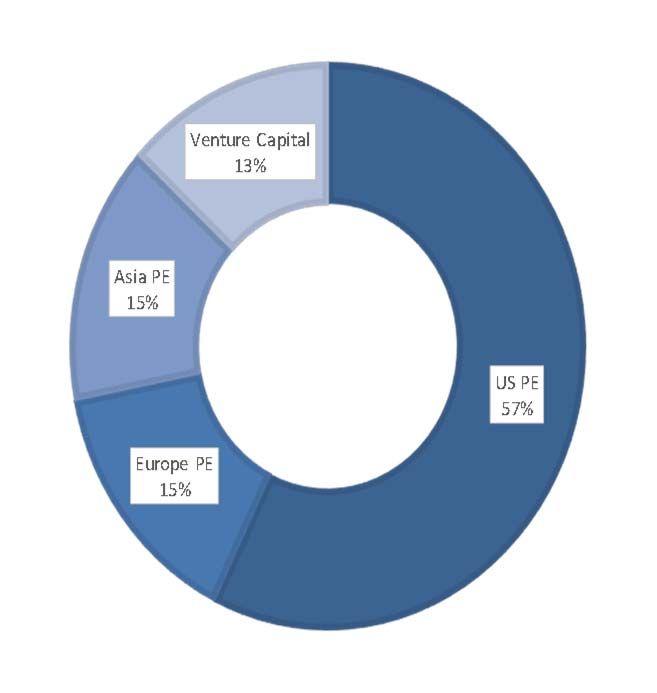
Private Equity – Current Status (active funds only)
                                           Strategy Diversification by Exposure
    $1,536 million committed to 78 funds

    74% of commitments have been
    invested

    Diversified by strategy, geography,
    and vintage year

            Value Creation in Millions

                                                  Commitments by Year in Millions
                                           $350
                                                          2000-2019
                                           $300
                                           $250
                                           $200
                                           $150
                                           $100
                                            $50
                                             $0
                                                  2000 2003 2006 2009 2012 2015 2018

4
Review of Illiquid Asset Classes - Rhode Island State Investment Commission Los Angeles New York - Office of the General Treasurer ...
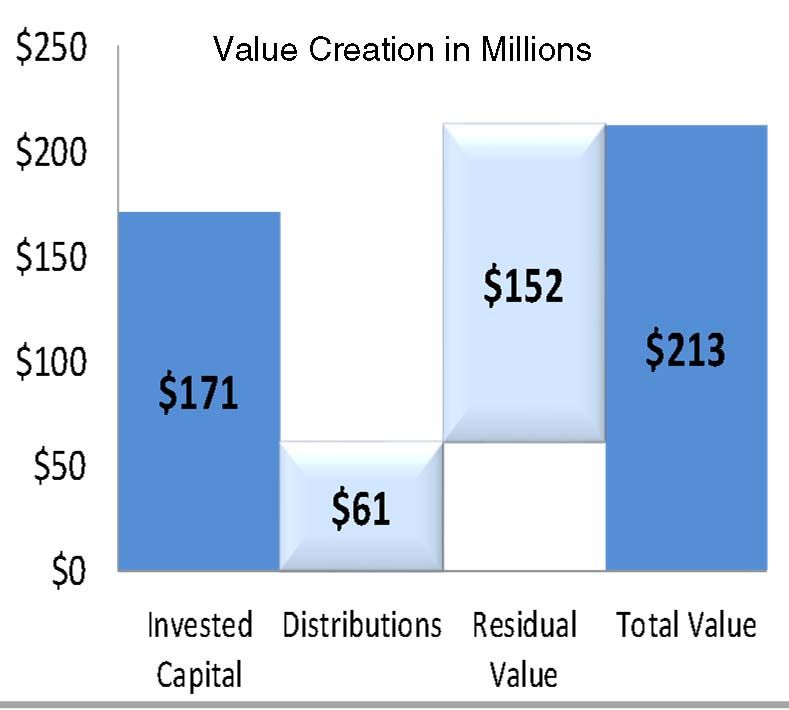
Company Holdings and Exposures
      Over 700 company investments                                  Business Sector Exposure by Market Value

      No investment larger than 1% of                                 Agriculture          Other
      total                                                   Com/Media 4%                  1%
                                                                 6%

      Diversified by business sector                                                           Info Tech
                                                                       Energy
                                                                                                  25%
                                                                        10%
            Examples of Larger Company Holdings
                                                                    Industrial
 Company              Fund                 Sector                      10%
                                                                                               Health Care
Allakos, Inc.        Alta Partners VIII    Health Care                   Fin/Bus                  17%
                                                                         Services
SAFEbuilt            Riverside MC Fund III Fin/Bus Services                12%
                                                                                    Consumer
                                                                                      15%
Analogic Corporation Altaris Health        Health Care

CradlePoint, Inc.    Sorenson Capital      Info Tech

Meadows Food         Paine Schwartz Food   Agriculture

FNB Housing Finance Carlyle Asia IV        Fin/Bus Services

 5
Review of Illiquid Asset Classes - Rhode Island State Investment Commission Los Angeles New York - Office of the General Treasurer ...
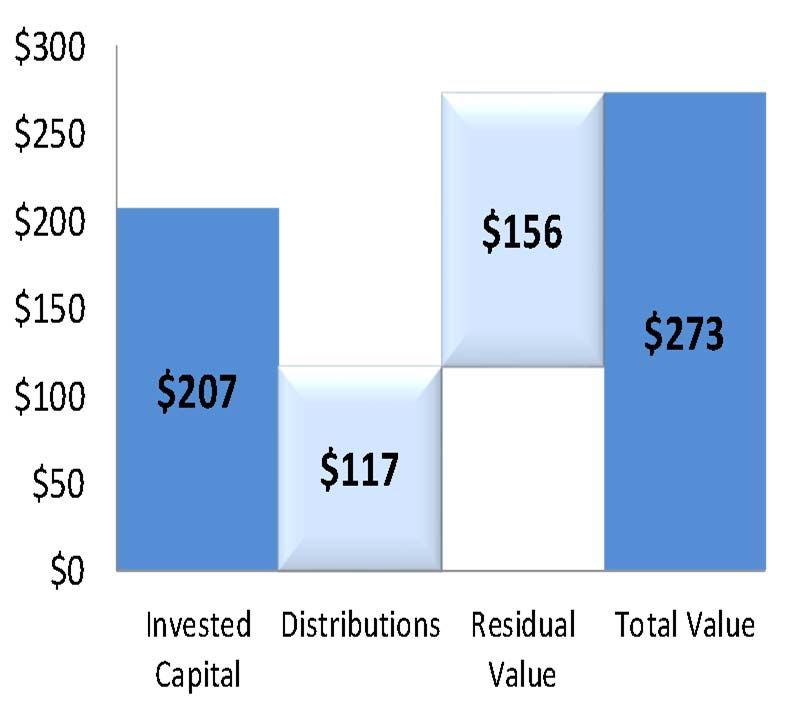
Pacing Plan: Private Equity
   Policy target of 11.25% within Growth Class
                                                                               Pacing Plan
   Allocation starts at 6.7% (current                        Market Value and Exposure as a Percent of Total Fund
   allocation*), increasing to 11.25% by 2022

   Unfunded commitments = 5% to 7% of
   total fund

   Opportunistic and diversified pacing:
         •   Vintage year
              – Maintain level vintage year
                  commitments averaging
                  $270 mm per year
         •   Funds:
              – ~5-10 funds per year/$20-60mm per
                  fund
         •   Potential Strategies:
              – US Buyouts
              – Growth Equity
              – International Private Equity
              – Venture Capital                                            Exposure equals market value plus
                                                                                unfunded commitments

(*9/30/18 private equity portfolio market value divided by
12/31/18 total fund market value)

    6
Review of Illiquid Asset Classes - Rhode Island State Investment Commission Los Angeles New York - Office of the General Treasurer ...
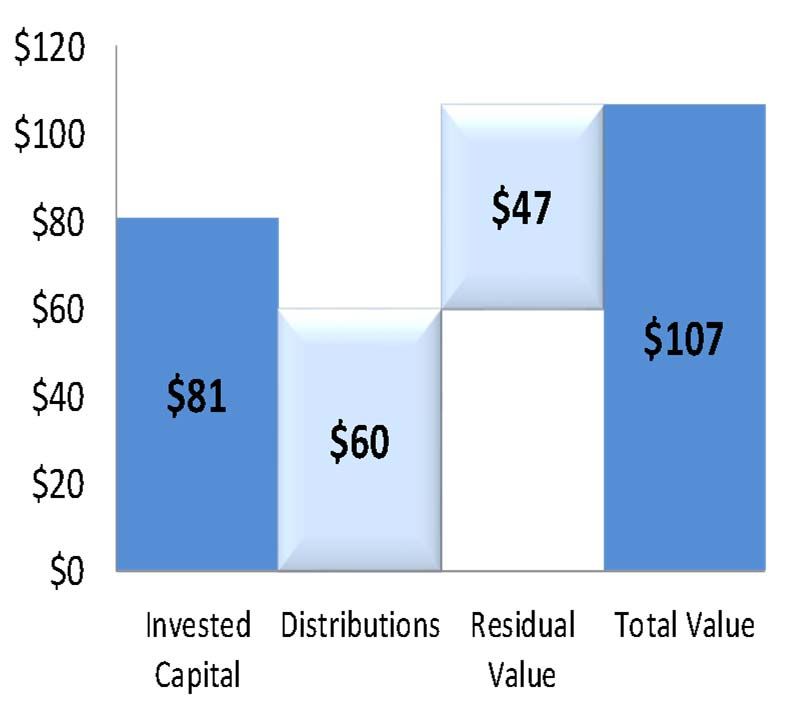
Private Equity Pacing Plan
    ERSRI - Pacing Plan                                     12/31/2018    12/31/2019    12/31/2020       12/31/2021    12/31/2022
    Forecast Plan Total Assets                               7,810,625     8,044,944     8,286,292        8,534,881     8,790,927
    New Commitments                                                          305,000       265,000          265,000       255,000
    Private Equity Fair Value by Sector:

    Private Equity Total                                       521,629       571,009       712,406           854,341      990,999

    Private Equity Fair Value as % of Total Plan Assets          6.68%        7.10%         8.60%            10.01%       11.27%
    Private Equity Target Asset Allocation                      11.25%       11.25%        11.25%            11.25%       11.25%

    Unfunded Commitments and Fair Value                     12/31/2018    12/31/2019    12/31/2020       12/31/2021    12/31/2022
    Private Equity Unfunded Commitments                        370,953       564,424       579,146          600,424       602,877
    Unfunded Commitments + FV                                  892,582     1,135,433     1,291,552        1,454,765     1,593,876
    Unfunded Commitments + FV as % of Assets                    11.4%         14.1%         15.6%            17.0%         18.1%
    Ratio of Unf Com + FV to Target Allocation                   1.02x         1.25x         1.39x            1.52x         1.61x

    Net Cash Flow Requirements                                            12/31/2019    12/31/2020       12/31/2021    12/31/2022
    Total Net Cash Flow to Private Equity                                     3,213        (83,843)         (70,096)      (50,462)

    Total Plan Assets assumed to grow at 3.0%

                                                              Cash flow Forecast
                                  Total                   12/31/2019   12/31/2020     12/31/2021      12/31/2022
                                  Drawdowns                (215,529)    (250,278)      (243,722)       (252,547)
                                  Distributions             218,742      166,435        173,626         202,085
                                  Net Cash Flows              3,213       (83,843)       (70,096)        (50,462)
                                  Fair Market Value         571,009      712,406        854,341         990,999
       Amounts in $000

7
Review of Illiquid Asset Classes - Rhode Island State Investment Commission Los Angeles New York - Office of the General Treasurer ...
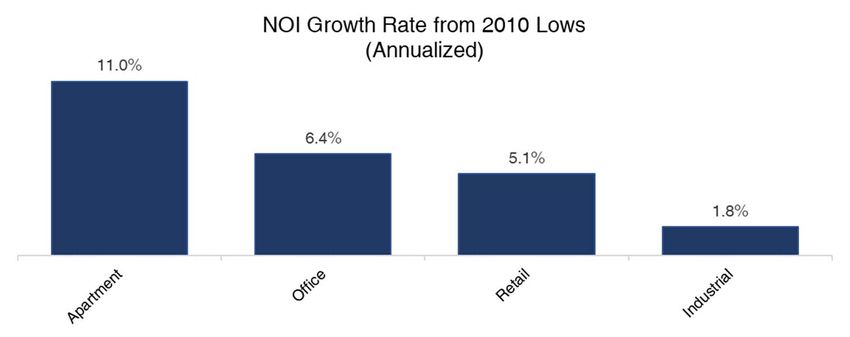
Recommended Model Portfolio
Strategy                   Current Portfolio   Target Portfolio    Range

Total Buyout                     82%                80%           60-100%

    Global Buyout                3%                 10%           0%-20%

    US Buyout                    54%                50%           30%-70%
       Large                      6%                10%            5-20%

       Middle Market             39%                25%            5-50%

       Small                     13%                15%            0-30%

    Europe Buyouts               9%                 12%           10-30%

    Asia Buyouts                 12%                 8%            0-20%

    Latin Am Buyouts             0%                  0%            0-5%

Growth Equity                    3%                 10%            0-20%

Venture Capital                  14%                10%            0-20%

Other (e.g. secondaries)         1%                  0%            0-10%

8
Review of Illiquid Asset Classes - Rhode Island State Investment Commission Los Angeles New York - Office of the General Treasurer ...
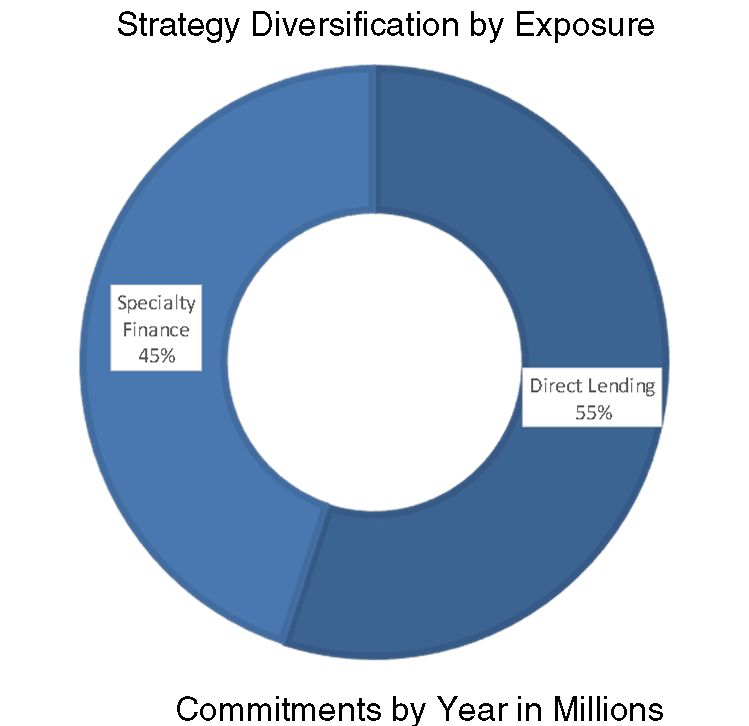
Performance versus Public Markets and Private Universe*
           Performance versus Public Markets                                                           Performance by Year versus Private Equity Universe**
Since inception annualized internal rate of returns net of fees                                             Since inception annualized returns net of fees
                                                                                                                               Vintage               ERSRI PE            Universe
                                                                                                                                  Year               Portfolio      Median Return

                                  ERSRI         MSCI ACWI                                                                           1998                 10.81%              8.40%
                                                                                                                                    1999                  9.97%             ‐0.19%
         13.72%                                                                                                                     2000                 14.70%              3.32%

                                                                                                 Superior                           2001                 31.60%              9.85%
                                                          11.22%                                 Performance                        2002                 17.73%             10.88%
                                                                           8.78%                                                    2003                 14.18%             10.21%
                          7.27%                                                                                                     2004                 10.96%              7.64%
                                                                                                                                    2005                  8.13%              7.39%
                                                                                                                                    2006                  5.82%              7.49%
                                                                                                  Mixed
                                                                                                  Performance                       2007                 10.01%              9.19%
                                                                                                                                    2008                  8.96%              8.17%
                                                                                                                                    2009                                    13.39%
                                                                                                  Only One
           Since Inception                                         8 Year                         investment                        2010                                    12.40%
                                                                                                                                    2011                  0.48%             13.75%
                                                                                                                                    2012                 20.79%             13.05%
                                                                                                                                    2013                 15.59%             12.81%
                                                                                                  Recent
     * Performance as of September 30, 2018                                                       investments                       2014                 17.18%             14.65%
     For Since Inception period, R3000 Index used for 1982‐2001; ACWI used for 2001‐2018.
     Public market IRR is calculated by calculating a terminal value equal to the compounded                                        2015                 13.85%             14.53%
     return on all cash inflows (i.e. capital calls) by the return of the public market index.
     Monthly returns and cash flows are used. The 8 Year return represents cash flows and all                                       2016                 13.97%             10.09%
     funds in the portfolio from 2011 – 2018.                                                         ** Cambridge Global Private Equity/Venture Capital Universe

 9
Review of Illiquid Asset Classes - Rhode Island State Investment Commission Los Angeles New York - Office of the General Treasurer ...
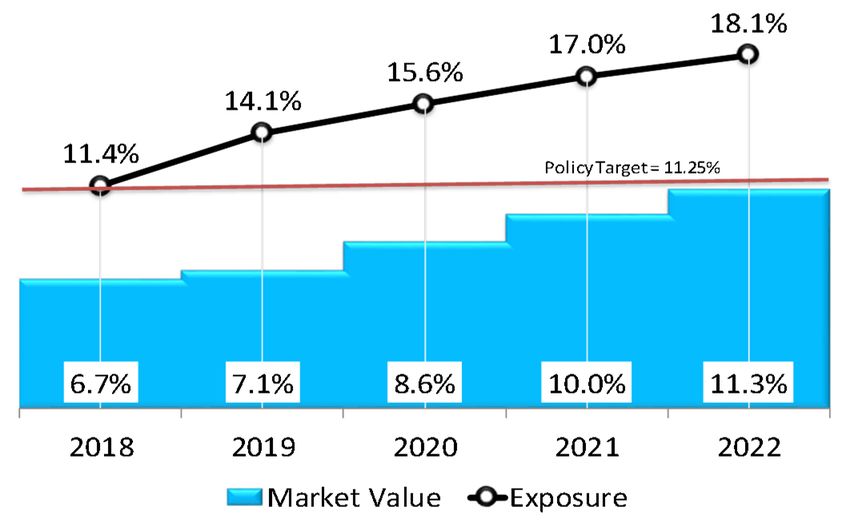
Section 2: Opportunistic Credit
Opportunistic Credit– Current Status (active funds only)
     $123 million committed to 7 funds

     66% of commitments have been
     invested

     Mostly distressed investing in US
     and Europe
                                              Value Creation in Millions
     Over 80 underlying investments

     Since Inception net IRR 7.26%

            Commitments by Year in Millions

      $60

      $40

      $20

       $0
            2006
            2007
            2008
            2009
            2010
            2011
            2012
            2013
            2014
            2015
            2016
            2017
            2018

11
Pacing Plan: Private Opportunistic Credit
Policy target of 1.5% within Growth Class
                                                                  Pacing Plan
Allocation starts at 0.6% (current              Market Value and Exposure as a Percent of Total Fund
allocation), increasing to 1.5% by 2022

Unfunded commitments = 0.5% to 0.6% of
total fund

Opportunistic and diversified pacing
     •   Vintage year
          – Maintain level vintage year
              commitments averaging
              $35mm per year
     •   Funds
          – ~1-2 funds per year/$20-35 mm per
              fund
     •   Potential Strategies:
          – Distressed corporate debt
          – Distressed real estate debt                       Exposure equals market value plus
                                                                   unfunded commitments
          – Other non-performing debt

12
Pacing Plan Opportunistic Private Credit
     ERSRI - Pacing Plan                                        12/31/2018    12/31/2019    12/31/2020     12/31/2021      12/31/2022
     Forecast Plan Total Assets                                  7,810,625     8,044,944     8,286,292      8,534,881       8,790,927
     New Commitments                                                              35,000        35,000         35,000          35,000
     Private Opportunistic Credit Fair Value by Sector:

     Private Opportunistic Credit Total                              46,840        51,715       78,699        106,854         128,824

     POC Fair Value as % of Total Plan Assets                        0.60%         0.64%        0.95%              1.25%       1.47%
     POC Target Asset Allocation                                     1.50%         1.50%        1.50%              1.50%       1.50%

     Unfunded Commitments and Fair Value                        12/31/2018    12/31/2019    12/31/2020     12/31/2021      12/31/2022
     Private Opportunistic Credit Unfunded Commitments              42,350        40,705        44,412         45,523          45,857
     Unfunded Commitments + FV                                      89,190        92,420       123,111        152,377         174,681
     Unfunded Commitments + FV as % of Assets                        1.1%          1.1%          1.5%           1.8%             2.0%
     Ratio of Unf Com + FV to Target Allocation                      0.76x         0.77x         0.99x          1.19x           1.32x

     Net Cash Flow Requirements                                               12/31/2019    12/31/2020     12/31/2021      12/31/2022
     Total Net Cash Flow to Private Opportunistic Credit                            (262)      (21,890)       (20,402)        (11,445)

     Total Plan Assets assumed to grow at 3.0%
                                                                Cash flow Forecast
                                  Total                    12/31/2019    12/31/2020    12/31/2021    12/31/2022
                                  Drawdowns                   (36,645)      (31,294)      (33,888)      (34,666)
                                  Distributions                36,383         9,404        13,486        23,221
                                  Net Cash Flows                 (262)      (21,890)      (20,402)      (11,445)
        Amounts in $000           Fair Market Value            51,715        78,699      106,854       128,824

13
Opportunistic Credit Performance
         Since Inception Net IRRs
10.00%

 9.00%
                                8.39%
                                                 Cambridge Associates
                                                 Universe of Distressed
 8.00%
           7.26%                                 Funds (VY 2006‐2018)
 7.00%                                           is used
 6.00%
                                                 Underperformance
 5.00%                                           versus this benchmark
                                                 is primarily the result
 4.00%
                                                 of no commitments in
 3.00%                                           2013‐2017 and one
                                                 commitment made in
 2.00%
                                                 2018 that is immature.
 1.00%

 0.00%
          ERSRI         MEDIAN DISTRESSED FUND

14
Section 3: Non-Core Real Estate
Non-Core Real Estate– Current Status (active funds only)
     $270 million committed to 11 funds

     77% of commitments have been
     invested                                                                                              Value Creation in Millions

     Value-add and Opportunistic
     strategies

     Including legacy funds, IRR since
     inception is 0.8%

          Commitments by Year in Millions
 $80
 $70
 $60
 $50
 $40
 $30
 $20
 $10
  $0
         2005
                2006
                       2007
                              2008
                                     2009
                                            2010
                                                   2011
                                                          2012
                                                                 2013
                                                                        2014
                                                                               2015
                                                                                      2016
                                                                                             2017
                                                                                                    2018

16
Pacing Plan: Non-Core Real Estate
Policy target of 2.25% within Growth Class
                                                                 Pacing Plan
Allocation starts at 1.99% (current            Market Value and Exposure as a Percent of Total Fund
allocation), increasing to 2.25% by 2022

Unfunded commitments = 0.8% to 1.2% of
total fund

Opportunistic and diversified pacing
     •   Vintage year
          – Maintain level vintage year
              commitments averaging
              $65 mm per year
     •   Funds
          – ~1-2 funds per year/$30-65mm per
              fund
     •   Potential Strategies:
          – Distressed Real Estate
          – Value-Add Real Estate                            Exposure equals market value plus
                                                                  unfunded commitments

17
Non-Core Real Estate Pacing Plan
     ERSRI - Pacing Plan                                        12/31/2018   12/31/2019    12/31/2020      12/31/2021    12/31/2022
     Forecast Plan Total Assets                                  7,810,625    8,044,944     8,286,292       8,534,881     8,790,927
     New Commitments                                                             65,000        65,000          65,000        65,000

     Non-Core Real Estate at Fair Value                           155,661      159,621        164,165          176,871      197,172

     Non-Core Real Estate at Fair Value as % of Total Plan As       1.99%        1.98%          1.98%           2.07%        2.24%
     Non-Core Real Estate Target Asset Allocation                   2.25%        2.25%          2.25%           2.25%        2.25%

     Unfunded Commitments and Fair Value                        12/31/2018   12/31/2019    12/31/2020      12/31/2021    12/31/2022
     Non-Core Real Estate Unfunded Commitments                      63,696       85,473       100,383         107,839       111,566
     Unfunded Commitments + FV                                     219,357      245,094       264,548         284,709       308,738
     Unfunded Commitments + FV as % of Assets                         2.8%         3.0%          3.2%            3.3%          3.5%
     Ratio of Unf Com + FV to Target Allocation                      1.25x        1.35x         1.42x           1.48x         1.56x

     Net Cash Flow Requirements                                              12/31/2019    12/31/2020      12/31/2021    12/31/2022
     Total Net Cash Flow to Non-Core Real Estate                                 9,349         9,103           1,330         (5,179)

     Annual Commitments by Strategy                                          12/31/2019    12/31/2020      12/31/2021    12/31/2022
     Total Annual Commitments to Non-Core Real Estate                           65,000        65,000          65,000        65,000

     Total Plan Assets assumed to grow at 3.0%
                                                                  Cash flow Forecast
                                  Total                    12/31/2019    12/31/2020      12/31/2021     12/31/2022
                                  Drawdowns                   (43,223)      (50,090)        (57,545)       (61,272)
                                  Distributions                52,572        59,193          58,875         56,093
                                  Net Cash Flows                9,349         9,103           1,330         (5,179)
                                  Fair Market Value          159,621       164,165         176,871        197,172
         Amounts in $000

18
Section 4: Private Credit
Private Credit – Current Status (active funds only)
                                            Strategy Diversification by Exposure
     $205 million committed to 6 funds

     69% of commitments have been
     invested

     Direct lending and specialty finance

             Value Creation in Millions

                                                   Commitments by Year in Millions

                                             $60

                                             $50

                                             $40

                                             $30

                                             $20

                                             $10

                                              $0
                                                    2011 2012 2013 2014 2015 2016 2017 2018 2019

20
Pacing Plan: Private Credit
Policy target of 3.2% within Income Class
                                                                 Pacing Plan
Allocation starts at 1.4% (current             Market Value and Exposure as a Percent of Total Fund
allocation), increasing to 3.2% by 2022

Unfunded commitments = 1.1% to 2.4% of
total fund

Opportunistic and diversified pacing
     •   Vintage year
          – Maintain level vintage year
              commitments averaging
              $130 mm per year
     •   Funds
          – ~2-3 funds per year/$30-70mm per
              fund
     •   Potential Strategies:
          – Direct lending
          – Real estate debt                                 Exposure equals market value plus
                                                                  unfunded commitments
          – IP Royalties
          – Insurance linked
          – Other

21
Private Credit Pacing Plan
     ERSRI - Pacing Plan                                      12/31/2018    12/31/2019    12/31/2020        12/31/2021    12/31/2022
     Forecast Plan Total Assets                                7,810,625     8,044,944     8,286,292         8,534,881     8,790,927
     New Commitments                                                           130,000       130,000           130,000       130,000
     Private Credit Fair Value by Sector:
     Private Credit at Fair Value                                109,718       130,604       169,304           223,855       270,411

     Private Credit Fair Value as % of Total Plan Assets            1.4%          1.6%         2.0%              2.6%          3.1%
     Private Credit Target Asset Allocation                         3.2%          3.2%         3.2%              3.2%          3.2%

     Unfunded Commitments and Fair Value                      12/31/2018    12/31/2019    12/31/2020        12/31/2021    12/31/2022
     Private Credit Unfunded Commitments                          67,547       137,519       182,083           199,908       207,038
     Unfunded Commitments + FV                                   177,266       268,122       351,387           423,763       477,450
     Unfunded Commitments + FV as % of Assets                       2.3%          3.3%          4.2%              5.0%          5.4%
     Ratio of Unf Com + FV to Target Allocation                    0.71x         1.04x         1.33x             1.55x         1.70x

     Net Cash Flow Requirements                                             12/31/2019    12/31/2020        12/31/2021    12/31/2022
     Total Net Cash Flow to Private Credit                                     (12,876)      (29,167)          (42,191)      (30,215)

     Annual Commitments by Strategy                                         12/31/2019    12/31/2020        12/31/2021    12/31/2022
     Total Annual Commitments to Private Credit                               130,000       130,000           130,000       130,000

     Total Plan Assets assumed to grow at 3.0%
                                                              Cash flow Forecast

                                    Total                  12/31/2019    12/31/2020    12/31/2021       12/31/2022
                                    Drawdowns                 (60,028)      (85,436)    (112,175)        (122,870)
                                    Distributions              47,153        56,269        69,983           92,655
                                    Net Cash Flows            (12,876)      (29,167)      (42,191)         (30,215)
        Amounts in $000             Fair Market Value        130,604       169,304       223,855          270,411

22
Private Credit Performance
             Since Inception Net IRRs
                       9.42%                           No active universe of
     9.03%
                                                       similar strategies is
                                                       available

                                                       Cambridge Associates
                                                       Universe of Mezzanine
                                         4.83%
                                                       Funds (VY 2011‐2018)
                                                       is used. However,
                                                       portfolio is lower risk
                                                       (more senior credits)

                                                       Public benchmark is
                                                       S&P Leverage Loan
                                                       Index
     ERSRI       MEDIAN MEZZANINE S&P LEV LOAN INDEX
                       FUND

23
Section 5: Infrastructure
Infrastructure – Current Status
                                          Strategy Diversification by Exposure
     $228 million committed to 6 funds

     75% of commitments have been
     invested

     Core and value-added strategies

             Value Creation in Millions

                                                 Commitments by Year in Millions
                                          $140
                                          $120
                                          $100
                                           $80
                                           $60
                                           $40
                                           $20
                                            $0
                                                    2015   2016    2017   2018

25
Pacing Plan: Private Infrastructure
Policy target of 2.4% within Income Class
                                                                 Pacing Plan
Allocation starts at 1.9% (current             Market Value and Exposure as a Percent of Total Fund
allocation), increasing to 2.4% by 2022

Unfunded commitments = 0.9% to 1.3% of
total fund

Opportunistic and diversified pacing
     •   Vintage year
          – Maintain level vintage year
              commitments averaging
              $50 mm per year
     •   Funds
          – ~1-2 funds per year/$20-50mm per
              fund
     •   Potential Strategies:
          – Core infrastructure
          – Value –add                                       Exposure equals market value plus
                                                                  unfunded commitments
          – International

26
Private Infrastructure Pacing Plan
     ERSRI - Pacing Plan                                     12/31/2018    12/31/2019    12/31/2020       12/31/2021    12/31/2022
     Forecast Plan Total Assets                               7,810,625     8,044,944     8,286,292        8,534,881     8,790,927
     New Commitments                                                           50,000        50,000           50,000        50,000
     Private Infrastructure Fair Value by Sector:
     Private Infrastructure at Fair Value                       151,630       174,274       188,376           201,141     210,938

     Private Infra Fair Value as % of Total Plan Assets            1.9%         2.2%           2.3%             2.4%         2.4%
     Private Infra Target Asset Allocation                         2.4%         2.4%           2.4%             2.4%         2.4%

     Unfunded Commitments and Fair Value                     12/31/2018    12/31/2019    12/31/2020       12/31/2021    12/31/2022
     Private Infra Unfunded Commitments                          69,849        84,667        99,754          108,052       112,616
     Unfunded Commitments + FV                                  221,479       258,941       288,130          309,194       323,554
     Unfunded Commitments + FV as % of Assets                      2.8%          3.2%          3.5%             3.6%          3.7%
     Ratio of Unf Com + FV to Target Allocation                   1.18x         1.34x         1.45x            1.51x         1.53x

     Net Cash Flow Requirements                                            12/31/2019    12/31/2020       12/31/2021    12/31/2022
     Total Net Cash Flow to Private Infrastructure                            (11,272)       (1,031)          1,363         5,289

     Annual Commitments by Strategy                                        12/31/2019    12/31/2020       12/31/2021    12/31/2022
     Total Annual Commitments to Private Infrastructure                       50,000        50,000           50,000        50,000

     Total Plan Assets assumed to grow at 3.0%

                                                              Cash flow Forecast
                                    Total                 12/31/2019    12/31/2020     12/31/2021      12/31/2022
                                    Drawdowns                (35,182)      (34,913)       (41,702)        (45,436)
                                    Distributions             23,910        33,882         43,065          50,725
                                    Net Cash Flows           (11,272)       (1,031)         1,363           5,289
          Amounts in $000           Fair Market Value       174,274       188,376        201,141         210,938

27
Infrastructure Performance
        Since Inception Net IRRs

     12.42%
                                                 Cambridge Associates
                                                 Universe of
                                                 Infrastructure Funds
                                                 (VY 2011‐2018) is used

                              7.06%

      ERSRI         MEDIAN INFRASTRUCTURE FUND

28
Appendix
ERSRI Target Asset Allocation
ERSRI Asset Allocation Tracking

Functional   Aggregate      Aggregate                             Strategic   (a)Target       (b)Actual
                                             AssetClass          Benchmark        Asset    exposure as of
  Bucket     AssetClass     Allocation                                                                      (b) ‐(a)
                              Weight                               Weight     Allocation      01/31/19

                                                USEquity            21.8%         21.8%           25.1%        3.3%

                Global        40.0%
                Equity

GROWTH
                                            International
                                                                    13.5%         13.5%           14.7%        1.2%
                                         Developed Equity

                                                EMEquity            4.7%          4.7%            5.3%         0.6%

               Private                             PE               11.0%        11.25%           6.5%         ‐4.7%

               Growth         15.0%

                                               Non‐coreRE           2.5%          2.25%           1.9%         ‐0.3%
                                            Opp Private Credit      1.5%          1.5%            0.5%         ‐1.0%
                                                 HYInfra            1.5%          1.0%            1.9%         0.9%

                                                  REITs             0.0%          1.0%            0.0%         ‐1.0%
 INCOME        Income          8.0%
                                               LiquidCredit         3.5%          2.8%            3.9%         1.1%

                                              PrivateCredit         3.0%          3.2%            1.4%         ‐1.8%

                                            Treasury Duration       4.0%          4.0%            3.9%         ‐0.1%
                  CPC          8.0%
                                            Systematic Trend        4.0%          4.0%            3.6%         ‐0.4%

                                                 CoreRE             4.0%          3.6%            4.4%         0.8%
              Inflation
             Protection        8.0%            PrivateInfra         2.0%          2.4%            1.8%         ‐0.6%
                                                   TIPs             1.0%          1.0%            2.5%          1.5%
                                              Nat'Resources         1.0%          1.0%            0.0%         ‐1.0%
STABILITY

                                             IG FixedIncome         11.5%         11.5%           11.4%        ‐0.1%

              Volatility
                              21.0%
             Protection

                                             AbsoluteReturn         6.5%          6.5%            6.9%         0.4%

                                              StrategicCash         3.0%          3.0%            3.4%         0.4%

                                  ‐          Short‐Term Cash          ‐             ‐             0.6%         0.6%
  OTHER        Short‐term
                                  ‐          RussellOverlay           ‐             ‐             0.4%         0.4%
                Tactical
  TOTAL          Total        100.0%                              100.0%        100.0%          100.0%        0.0%
Secondary Investing
Secondary Investing Objectives and Strategy
•    Three objectives for secondaries:
       1.     Access to “top-tier” general partners
       2.     Deployment of capital and J-curve reduction
       3.     Attractive returns

•    Investment strategy:
            Proactive sourcing of secondary opportunities
            Sourcing secondaries overlaps sourcing primaries
            Disciplined valuation
            Opportunistic capital deployment

33
Investment Process
              Establish
             Guidelines                                       Timely Response Time is
                                                             the Key “non-price” Factor
                                                               in Buying Secondaries
                          Identify Target
                             Universe

                                            Sourcing

                                                       Valuation and
                                                        Preliminary
                                                          Bidding
Standardizing the Process
Facilitates Fast Response                                              Due Diligence
                                                                         and Final
           Times                                                          Bidding

                                                                                           Legal
                                                                                       Documentation

34
Investment Process

     Identify Target
        Universe

                                           Access Secondaries

                       Target Universe
                                            Funds of Top Tier
                                               Managers

                                          Exposure Secondaries
                                          Funds Currently in the
                                                Portfolio

                                         Opportunistic Secondaries
                                          High Return/Low Risk
                                               Secondaries

35
Private Assets Market Outlook
Cliffwater Private Assets Quarterly Outlook – Q1 2019
                         Highly competitive market across all sectors has led to increased use of debt and continued high prices. Firms with the ability to complete more
U.S. Large Buyout                                                                                                                                                         Underweight
                         complicated transactions or provide creative solutions are best positioned in the current environment.

                         Deal flow remains strong as company owners grow increasingly confident about selling into the current market. More options on exit than the larger
U.S. Mid/Small Buyout                                                                                                                                                       Neutral
                         buyout market.
                         Recent repricing in the secondary market and other signs in the credit markets reinforce a potential distressed cycle on horizon, though timing and
Distressed                                                                                                                                                                           Neutral
                         magnitude remain uncertain. Current opportunities include European bank deleveraging and funds focused on smaller markets.
                         Despite volatility in the broader credit markets, private debt continues to provide investors with consistent income at attractive yields relative to other
Private Debt                                                                                                                                                                         Overweight
                         income oriented investments. A recent decline in private debt fundraising is positive for lenders.
                         Record levels of capital continue to be invested in a smaller number of venture-backed companies. Strategic and sovereign wealth investors continue
Venture                                                                                                                                                                              Neutral
                         to aggressively invest capital, pressuring valuations and extending the length of time that companies stay private.
                         The European market has become more competitive as private equity managers grow more accepting of the economic and political environments
Europe                                                                                                                                                             Neutral
                         across the region. Managers with flexible mandates, strong origination, discipline, and true value creation capabilities have an edge.

                         Trade war concerns continue to impact the public exit markets, as a significant portion of Internet-related companies that have listed since 2017 have
Asia                     subsequently traded down from their IPO price. Venture capital activity remains consistent, however, and USD-funds are benefitting from a reduction Neutral
                         in competition from RMB funds.

                         Exit activity remains limited following a challenging 2018 in which LatAm currencies depreciated significantly relative to the USD. Fundraising activity
Latin America                                                                                                                                                                     Neutral
                         remains muted and entry valuations are attractive on a comparative basis.

                         Large cap E&P transactions remain subdued and negatively affected by declining commodity prices. Small cap transactions offer better return
Energy                   potential and are a focus of small upstream funds. Opportunities in midstream infrastructure remain and offer a lower exposure to commodity price Neutral
                         volatility.
                         Fundraising remains highly active with mega funds and multiple large-sized funds being raised. Fund investment pipelines primarily consist of energy
Infrastructure           and transportation assets. Many funds are now targeting telecommunication infrastructure including the build out of fiber optic to residential users and Neutral
                         data warehousing.
                         Agriculture markets experienced positive change with the re-writing of NAFTA though the tariffs enacted by China have partially offset those gains.
Natural Resources                                                                                                                                                            Neutral
                         Timberland continues to be negatively impacted by low demand and low prices. The mining sector will be highly affected by slowing growth in China.
                         Fully priced environment has created a challenging buying market. Widely available debt has promoted asset refinancing to generate proceeds for
Real Estate – Equity                                                                                                                                                         Neutral
                         stabilized assets.
                         Increased lending activity across traditional banks and debt funds have created a competitive market. Lenders have reacted to increased competition
Real Estate – Debt                                                                                                                                                           Neutral
                         through more flexible terms and covenants.

 The information on this page contains Cliffwater’s current views, projections regarding future events, and forecasts regarding the
 strategies
   37       described herein. There is no assurance that such events or forecasts will be achieved, and may be significantly different
 from that shown here.
U.S. Private Equity Buyout Trends
                                     U.S. Deal Activity (#) by Sector1                                                                                      U.S. Activity (#) by Size of Deal2
                                  January 1, 2008 to December 31, 2018                                                                                   January 1, 2008 to December 31, 2018

               5,000                                                                                                               5,000
                                                                                                             B2B
               4,500                                                                                                               4,500
               4,000                                                                                                               4,000                                                                                $2.5B+
                                                                                                             B2C
               3,500                                                                                                               3,500
                                                                                                                                                                                                                        $1B-$2.5B
               3,000                                                                                                               3,000
# of Deals

                                                                                                             Energy
               2,500                                                                                                               2,500                                                                                $500M-$1B

               2,000                                                                                                               2,000
                                                                                                             Financial Services                                                                                         $100M-$500M
               1,500                                                                                                               1,500
                                                                                                                                   1,000                                                                                $25M-$100M
               1,000                                                                                         Healthcare
                 500                                                                                                                 500                                                                                Under $25M
                   0                                                                                                                   0
                                                                                                             IT

                                                                                                                                           2008
                                                                                                                                                  2009
                                                                                                                                                         2010
                                                                                                                                                                2011
                                                                                                                                                                       2012
                                                                                                                                                                              2013
                                                                                                                                                                                     2014
                                                                                                                                                                                            2015
                                                                                                                                                                                                   2016
                                                                                                                                                                                                          2017
                                                                                                                                                                                                                 2018
                         2008
                                2009
                                       2010
                                              2011
                                                     2012
                                                            2013
                                                                   2014
                                                                          2015
                                                                                 2016
                                                                                        2017
                                                                                               2018

                                                                                          U.S. PE-Backed Exits (#) by Type & Year3
                                                                                           January 1, 2008 to December 31, 2018
              100%

                80%         37%                      33%                    39%                       40%          44%            43%        43%                45%                  46%
                60%             3%                   7%                                                                                                                                                   Secondary Buyout
                                                                             6%                       4%              4%          6%          6%                 3%                  3%
                40%                                                                                                                                                                                       IPO
                            60%                      61%                    55%                       56%          52%                                                                                    Corporate Acquisition
                                                                                                                                  51%        51%                51%                  51%
                20%

                  0%
                            2008                     2009                   2010                      2011         2012           2013      2014                2015                 2016

             1 Source: PitchBook Data Inc.
             38
             2 Source: PitchBook Data Inc.
             3 Source: PitchBook Data Inc
Recent secondary market volatility indicates uncertainty ahead
                            Private debt performance continues to be strong
                                                   Barclays High Yield Option-Adjusted Spread
                                                                                                                                                                      Middle Market Loan Spreads, January 2016 to September 20182
                                                           Through December 20181
                             20.0%
                                                                                                                                                               1000                                                                                              4.0
                             18.0%
                                                                                                                                                                900
HY Option-Adjusted Spread

                             16.0%                                                                                                                                                                                                                               3.5
                                                                                                                                                                                                                                               741
                                                                                                                                                                800                                                                                      713
                             14.0%                                                                                                                                    702675 681             706                                      690                        3.0
                                                                                                                                                                                                    675
                                                                                                                                                                700             618 607         643
                                                                                                                                                                                                       612 604

                                                                                                                                                                                                                                                                       3 Month LIBOR
                                                                                                                                           Spread over LIBOR
                             12.0%                                                                                                                                                                                 591       592                                 2.5
                                                                                                                                                                600                    544                                               520
                                                                                                                                                                                                             512
                                                                                                                                                                                                                      461      458                 510     479
                             10.0%                                                                                                                              500                                                                                              2.0
                                                             Average: 5.57%
                              8.0%                                                                                                                              400                                                                                              1.5
                                                                                                                                 5.26%
                              6.0%                                                                                                                              300
                                                                                                                                                                                                                                                                 1.0
                                                                                                                                                                200
                              4.0%                                                                                                                                                                                                                               0.5
                                                                                                                                                                100
                              2.0%
                                                                                                                                                                  0                                                                                              0.0
                              0.0%

                                                                                                                                                                                              All‐In Yield   All‐In Spread         3 Month LIBOR

                                                     Distressed Debt and Opportunistic Funds                                                                                                      Direct Lending Funds

                            AnaCap Credit Opps                  • Invests in non‐performing and performing                                                       Silver Point Specialty       • Directly originate loans to lower middle market
                            Fund IV*                              European loan portfolios                                                                       Credit II                      non‐sponsor businesses
                            2Q 2019 final close                 • Long track record and focus on smaller, less                                                   2Q 2019 first close          • Niche strategy focused on less competitive
                                                                  competitive markets                                                                                                           situations

                            Clearlake                           • Non‐control stressed debt and structured                                                       TCP Direct Lending           • Direct lending to non‐sponsor middle market
                            Opportunities                         equity investments                                                                             IX                             businesses
                            Partners II                         • High quality platform and upside potential in                                                  2Q 2019 first close          • Sector focused team with long track record and
                            2Q 2019 final close                   most investments                                                                                                              strong performance
                               *Notes Cliffwater approved fund.
                               1   Source: Bloomberg
                               2   Source: S&P Leveraged Buyout Review 3Q 2018, Institutional Loans backing Middle-Market LBOs with less than $50 million of EBITDA.
                                   39
Record Levels of Venture Capital Investing
                                               U.S. VC Fundraising by Year                                                                                                                  U.S. Venture Capital Investments
                                            As of December 31, 2018 ($ Billions)                                                                                                           As of December 31, 2018 ($ Billions)
                         $60                                                                                            350                                             $140                                                                                                     12,000
                                                          Capital Raised ($B)                      310
                                                                                                                                                                                                                                       10,573 10,740
                                                          # of Funds Closed           288   289                                                                                                                                                     9,200
                         $50                                                                                            300                                             $120           Deal Value ($B)
                                                                                                           254
                                                                                                                  256                                                                                                         9,301                             9,489            10,000
                                                                                                                                                                                       # of Deals Closed                                                                 8,948

                                                                                                                              Number of Funds Closed
                                                                                                                        250                                                                                           7,882

                                                                                                                                                                                                                                                                                     Number of Deals Closed
                                                                                                                                                                        $100
   Capital Raised ($B)

                         $40                                                    217
                                                                       202                                                                                                                                                                                                       8,000
                               192    184    190                                                                                                                                                             6,759

                                                                                                                                                           Deal Value ($B)
                                                                                                                        200
                                                                                                                                                                             $80
                         $30                              150    152                                                                                                                                5,409                                                                        6,000
                                                                                                                        150                                                        4,727 4,487
                                                    119                                                                                                                      $60
                         $20
                                                                                                                        100                                                                                                                                                      4,000
                                                                                                                                                                             $40
                         $10                                                                                            50                                                                                                                                                       2,000
                                                                                                                                                                             $20

                                                                                                                                                                                                                                                                        $130.9
                                $34

                                      $35

                                              $32

                                                    $12

                                                           $20

                                                                 $26

                                                                        $24

                                                                                $21

                                                                                      $36

                                                                                             $36

                                                                                                    $41

                                                                                                            $34

                                                                                                                  $55

                                                                                                                                                                                   $36.9

                                                                                                                                                                                           $27.2

                                                                                                                                                                                                     $31.3

                                                                                                                                                                                                              $44.7

                                                                                                                                                                                                                      $41.5

                                                                                                                                                                                                                               $47.5

                                                                                                                                                                                                                                        $71.0

                                                                                                                                                                                                                                                $83.0

                                                                                                                                                                                                                                                        $77.2

                                                                                                                                                                                                                                                                $83.0
                         $0                                                                                             ‐
                               2006 2007 2008 2009 2010 2011 2012 2013 2014 2015 2016 2017 2018                                                                              $0                                                                                                  0
                                                                                                                                                                                   2008 2009 2010 2011 2012 2013 2014 2015 2016 2017 2018
                                                    Diversified Technology Funds
                                                                                                                                                                                                             Sector Focused Funds
Andreessen                                      • Multi‐stage investments in technology investments
Horowitz V                                      • High profile investment team and large group of                                                      Data Collective V*                          • Seed and early stage investments in deep science
2Q 2019 final                                     operating partners                                                                                   2Q 2019 final                               • Strong sector expertise and research capabilities
close                                                                                                                                                  close                                       • Leading brand in focused sector

NEA 17                                          • Multi‐stage investments in technology and life                                                       Lux Ventures VI                             • Early‐stage investments in deep‐tech companies
3Q 2019 final                                     sciences                                                                                             3Q 2019 final                                 including AI, next‐gen genomics, software
close                                           • Established team and brand recognition, deep                                                         close                                         companies, autonomous vehicle tech, and robotics
                                                  performance                                                                                                                                      • Differentiated and long‐standing sector focus

Spark Capital VI*                               • VC investments in technology companies, with a                                                       The Column                                  • Focused on formation of early stage biotech
Spark Growth III*                                 primary focus on consumer‐facing businesses                                                          Group IV                                      companies based on firm research and network
2Q 2019 final                                   • Dedicated growth‐focused and early‐stage focus                                                       3Q 2019 final                               • Strong scientific and operating team led by former
close                                                                                                                                                  close                                         Chief Scientist at Genentech

                                                                                            1 Source:     PitchBook Data Inc.
     40Cliffwater approved fund.
*Notes                                                                                      2 Source:     PitchBook Data Inc.
European Market Trends and Opportunities
                                    European Deal Activity (#) by Region1
                                   January 1, 2008 to September 30, 2018
                                                                                                                                                                      Mix of Opportunities Across Europe
100%
 90%                                                                                                                              UK/Ireland        Advent GPE IX         • Buyouts of large companies across Western
 80%                                                                                                                                                2Q 2019 final close     Europe, the U.S., and opportunistically in Asia
                                                                                                                                  Southern Europe                         • Diversified sector approach investing in
 70%
                                                                                                                                                                            companies with enterprise values to €3 billion
 60%                                                                                                                              Nordic Region
 50%
                                                                                                                                  DACH              Altor V               • Invests in middle market companies primarily
 40%
 30%                                                                                                                                                2Q 2019 first close     in the Nordic region
                                                                                                                                  France/Benelux
                                                                                                                                                                          • Operationally‐oriented, long‐term approach to
 20%
                                                                                                                                  Central &                                 value creation
 10%
                                                                                                                                  Eastern Europe
  0%
                                                                                                                                                    EMH II                • Founded by brother entrepreneurs, seeks
         2008

                  2009

                            2010

                                          2011

                                                        2012

                                                                 2013

                                                                         2014

                                                                                 2015

                                                                                           2016

                                                                                                            2017

                                                                                                                   Q3 2018
                                                                                                                                                    2Q 2019 final close     growth equity investments across the DACH
                                                                                                                                                                            region
                                      European Deal Activity (#) by Sector2
                                     January 1, 2008 to September 30, 2018                                                                          OpCapita III          • Targets scalable, underperforming companies
100%                                                                                                                                                2Q 2019 first close     across Europe with up to €1.0 billion revenue
                                                                                                                             B2B
 90%                                                                                                                                                                      • Consumer, retail, and leisure sectors
 80%                                                                                                                         B2C
 70%                                                                                                                         Energy                 Synova Capital IV     • Lower middle market growth equity
 60%                                                                                                                                                2Q 2019 final close     investments across the UK
                                                                                                                             Financial Services
 50%                                                                                                                                                                      • Seek entrepreneur or family owned
 40%                                                                                                                         Healthcare                                     businesses in off‐market processes
 30%
                                                                                                                             IT
 20%
 10%                                                                                                                         Materials &            Wise Equity V         • Targets family‐owned, lower middle market
  0%                                                                                                                         Resources              Q3 2019 first close     companies across Northern Italy
        2008

                2009

                         2010

                                   2011

                                                 2012

                                                          2013

                                                                  2014

                                                                         2015

                                                                                2016

                                                                                        2017

                                                                                                  Q3 2018

                                                                                                                                                                          • Control investor across multiple sectors

   1 Source:    PitchBook Data Inc.
   41
   2 Source:    PitchBook Data Inc.
Asia: Attractive Venture Capital Market Dynamics
    Asia Venture Fundraising (January 1st, 2010 – December 31, 2018)1                                                       Asia Corporate VC Participation
                                                                                                                        (January 1st, 2014 – December 31, 2018)1

                                                                                                                                                                   % of Total Deal Count
                                                                                       Capital Invested ($B)
                            China Venture Capital Funds
Joy Capital           • Seed, series A, and later investments in consumer
Opportunity             technology and B2B companies in China                                                               Median Deal Size ($M), by Stage
                                                                                                                        (January 1st, 2010 – December 31, 2018)1
Fund 3Q Final         • Outsized Fund I performance and liquidity and strong
Close & Joy             Fund II and Opportunity Fund write‐ups

                                                                                                Median Deal Size ($M)
Capital III           • Visible & differentiated pipeline for the Opp. Fund
4Q final Close
Sky9 Fund IV          • Early and growth stage investments in technology
2Q 2019 final           companies based in China
close                 • Strong prior track record at Lightspeed and early
                        momentum of Fund III
Source Code           • Early and growth stage investments in technology
Fund IV &               companies based in China
Growth II             • Differentiated network of “Code Class” strategic LPs
2Q 2019 final         • Significant value‐add team
close
1 Source:   Venture Pulse, Q4’18, Global Analysis of Venture Funding, KPMG Enterprise. Data provided by PitchBook, January 15,
 42
 2019.
Asia Buyouts / GE: Consistent Growth in Opportunities, Focus on
                High-Growth Sectors
                                       Investment Activity Evolution, by Region / Country                                             PE Market Penetration
                                                  As of December 31, 20171                                            (% of Companies with $500 m - $5B revenue * PE Owned)2
$ in Billions

                                                             Buyout Funds
                CITIC Capital          • Control buyout investments in Chinese companies                                   Technology / Internet Share of Total Deal Volume3
                China IV               • Focus on privately‐owned and state‐owned enterprises
                1Q 2019 final          • Strong Fund I and Fund II outperformance to peers and meaningful
                close                    liquidity
                Warburg                • Large‐cap growth equity and control investments in Greater
                Pincus China             China and Southeast Asia
                Fund II                • Focus on technology, healthcare, real estate, and services
                2Q 2019 first            companies
                close                  • Strong performance and meaningful liquidity
                Quadria                • Control and growth equity investments in healthcare companies
                Capital Fund II          based in Southeast Asia and India
                1Q 2019 first          • Differentiated sector‐focused strategy and team
                close

                1    Source: “2018 Asia Pacific private equity investment opportunity”, March 2018, Bain & Company.
                43
Infra Fund Raising Gaining on Real Estate, Energy Declining

                                Infrastructure Funds                                                 Energy & Mining Funds
Brookfield                • Global Core+/Value Add strategy. Large asset       Taurus Mine           • Senior secured debt to production or near
Infrastructure IV           management team globally                           Finance 2*              production mines
Q2 2019 first             • GP is meeting its stated performance targets for   Q1 2019 first close   • Experienced credit team backed by mining
close                       prior funds                                                                technical professionals
GIP Infra IV*             • Global Core+/Value Add strategy. Operating
Q4 2018 first               partner group has added significant value          Tailwater             • Small to medium cap midstream investments in
close                     • Strong realizations from prior funds               Midstream IV            the U.S.
                                                                               Q3 2019 first close   • Strong prior fund exits
Star America II           • U.S. PPP focused infrastructure with strong
Q1 2019 first               construction company network                       Ridgewood Energy      • Deep water Gulf of Mexico resources profitable
close                     • Strategy of exiting after stabilizing projects     Oil & Gas Fund IV       at low crude oil pricing
                                                                               Q2 2019 first close   • >80% success rate of developing substantial
                                                                                                       reserves
   *Notes Cliffwater approved fund.
  1 Source:   Preqin (Real Estate & Infrastructure)
   44
  2 Source:   PitchBook Data Inc. (Energy)
Diverging Real Estate NOI Growth Trends Across Sectors

                 8%
     Cap Rates

                 6%

                 4%
                   2005       2006     2007   2008   2009   2010   2011      2012   2013         2014   2015     2016   2017   2018

                                                     Apartment      Retail          Industrial          Office
                      Source: NCREIF

45
Cliffwater Disclosures
Important Notice

This presentation has been provided to you for the purpose of discussing an investment advisory relationship. The material contained herein is
confidential and is intended for one-on-one or small group meetings with qualified, sophisticated, institutional investors. It may not be copied,
transmitted, given, or disclosed to any person other than your authorized representatives. This presentation is not an advertisement and is not
intended for public use for distribution. This material is not meant to be, nor shall it be construed as, an offer or solicitation of an offer for the
purchase or sale of any security.

This presentation was prepared exclusively for information and discussion purposes, and is not meant to be, nor shall it be construed as, an
attempt to define all information that may be material to you. All information including opinions or facts expressed herein are current as of the
date appearing in this presentation and is subject to change without notice. All information has been obtained from sources believed to be
reliable. No representation, warranty, or undertaking, express or implied, is given as to the accuracy or completeness of the information or
opinions contained in this presentation. The information and opinions in this presentation do not constitute investment advice. The list of clients
included in this presentation is a partial list selected to illustrate size and type and does not represent an endorsement or approval of Cliffwater
or the advisory services provided.

This presentation may include sample or pro forma performance. Such information is presented for illustrative purposes only and is based on
various assumptions, not all of which are described herein. Such assumptions, data, or projections may have a material impact on the returns
shown. Nothing contained in this presentation is, or shall be relied upon as, a representation as to past or future performance, and no
assurance, promise, or representation can be made as to actual returns. Past performance does not guarantee future performance.

References to market or composite indices (such as the S&P 500), benchmarks or other measures of relative market performance over a
specified period of time (each, an “index”) are provided for information only. Reference to an index does not imply that a portfolio will achieve
returns, volatility or other results similar to the index. The composition of an index may not reflect the manner in which a portfolio is constructed
in relation to expected or achieved returns, portfolio guidelines, restrictions, sectors, correlations, concentrations, volatility or tracking error
targets, all of which are subject to change over time.

  •    Hedge Fund Research, Inc. (“HFR”) is the source and owner of the HFR data contained or reflected in this report and all trademarks
       related thereto.
  •    Frank Russell Company (“FRC”) is the source and owner of the Russell Index data contained or reflected in this material and all
       trademarks and copyrights related thereto. The Russell Index data may contain confidential information and unauthorized use,
       disclosure, copying, dissemination or redistribution is strictly prohibited.
  •    Thomson Financial Inc. is the owner and/or licensor of the Cambridge Associates LLC data contained or reflected in this material.

46
You can also read