Microblogging Sentiment Investor, Return and Volatility in the COVID-19 Era: Indonesian Stock Exchange
←
→
Page content transcription
If your browser does not render page correctly, please read the page content below
Putri FARISKA, Nugraha NUGRAHA, Ika PUTERA, Mochamad Malik Akbar ROHANDI, Putri FARISKA /
                                      Journal of Asian Finance, Economics and Business Vol 8 No 3 (2021) 0061–0067                                          61

Print ISSN: 2288-4637 / Online ISSN 2288-4645
doi:10.13106/jafeb.2021.vol8.no3.0061

                     Microblogging Sentiment Investor, Return and Volatility in
                          the COVID-19 Era: Indonesian Stock Exchange

                                                  Putri FARISKA1, Nugraha NUGRAHA2, Ika PUTERA3,
                                                  Mochamad Malik Akbar ROHANDI4, Putri FARISKA5

                               Received: November 20, 2020                    Revised: January 25, 2021 Accepted: February 03, 2021

                                                                                        Abstract
The covid-19 pandemic scenario caused the most extensive economic shocks the world has experienced in decades. Maintaining financial
performance and economic stability is essential during the pandemic period. In these conditions, where movement is severely restricted,
media consumption is considered to be increasing. The social media platform is one of the media online used by the public as a source
of information and also expressing their sentiment, including individual investors in the capital market as social media users. Twitter
is one of the social media microblogging platforms used by individual investors to share their opinion and get information. This study
aims to determine whether microblogging sentiment investors can predict the capital market during pandemics. To analyze microblogging
sentiment investors, we classified sentiment using the phyton text mining algorithm and Naïve Bayesian text classification into level
positive, negative, and neutral from November 2019 to November 2020. This study was on 68 listed companies on the Indonesia stock
exchange. A Vector Autoregression and Impulse Response is applied to capture short and long-term impacts along with a causal relationship.
We found that microblogging sentiment investor has a significant impact on stock returns and volatility and vice-versa. Also, the response
due to shocks is convergent, and microblogging investors in Indonesia are categorized as a “news-watcher” investor.

Keywords: Microblogging Investor Sentiment, Volatility, Return, VAR, Naïve Bayesian

JEL Classification Code: C11, C63, G11, G41, O16

1. Introduction                                                                                  movement to break the chain of virus spread caused economic
                                                                                                 shocks. Conditions where movement is severely restricted
   World Bank has released data related to economic shocks                                       in the last few months, media consumption is considered to
caused by pandemic Covid-19 that has occurred for the last                                       be increasing along with internet consumption worldwide.
several decades. The imposition of restrictions on human                                         The social media platform is one of the media online used by
                                                                                                 the public as a source of valid nor hoax information and also
                                                                                                 used to express their sentiment on a daily basis.
 First Author. Doctoral Student in Pasca Sarjana, Universitas
1
                                                                                                     Information is considered as something that can influence
 Pendidikan Indonesia, Indonesia. Email: putri.fariska@upi.edu
 Professor. Faculty of Economics and Business, Universitas
2                                                                                               stock price movements towards a new equilibrium known as
 Pendidikan Indonesia, Indonesia. Email: nugraha@upi.edu                                         the concept of market efficiency. Qian and Rasheed (2006)
 Lecturer. Faculty of Economics and Business, Universitas Pendidikan
3
                                                                                                 have indicated that news is difficult to predict, so the stock
 Indonesia, Indonesia. Email: ikaputerawaspada@upi.edu                                           market price will follow a random walk pattern and produce
 Corresponding Author. Lecturer, Faculty of Economics and
4

 Business, Universitas Islam Bandung, Indonesia [Postal Address:                                 predictions with no more than 50% accuracy. The development
 Purnawarman Street, No. 59, Tamansari, Bandung Wetan, Bandung,                                  of research in the field of behavioral finance with a big data
 West Java, 40117, Indonesia] Email: moch.malik@gmail.com                                        approach showed that even though news or information is
 Lecturer. Faculty of Economics and Business, Telkom University,
5

 Indonesia. Email: putrifariska@telkomuniversity.ac.id
                                                                                                 unpredictable, the initial indicators can be extracted from
                                                                                                 social media, one of which is Twitter (Bollen et al., 2011).
© Copyright: The Author(s)
This is an Open Access article distributed under the terms of the Creative Commons Attribution       The behavioral finance research area that discusses
Non-Commercial License (https://creativecommons.org/licenses/by-nc/4.0/) which permits
unrestricted non-commercial use, distribution, and reproduction in any medium, provided the
                                                                                                 how a person’s sentiment can predict the stock market is
original work is properly cited.                                                                 sentiment investor. Research conducted by Antweiler and
Putri FARISKA, Nugraha NUGRAHA, Ika PUTERA, Mochamad Malik Akbar ROHANDI, Putri FARISKA /
62 Journal of Asian Finance, Economics and Business Vol 8 No 3 (2021) 0061–0067
Frank (2004) has indicated that the stock message board can of internet users and social media, it has become making
predict market volatility with a statistically significant stock measurement easier than before (Sahana & Anuradha, 2019).
return. Microblogging investor sentiment also has a strong Additionally, Sahana and Anuradha (2019) have indicated
prediction on market returns. The accuracy of this prediction that the internet and social media, as a development of
is consistent with the behavioral finance hypothesis information technology, provide a platform to express
(Oh & Sheng, 2011). In making decisions, investors not emotions to the public and greatly influence overall public
only look at financial information (P/E, Tobin Q) but also opinion. Twitter, Facebook, or Web blog, and other social
at information from social media to reflect their sentiments media provide a form of blogging that allows users to text
besides liquidity, and VIX explains the relationship between write short updating is called microblogging service. Through
social media and the stock market (Chousa et al., 2016). microblogging service, people easily share information and
Maintaining stock market volatility is one of the indicators opinions by writing short updating because of the function of
of financial performance that every country must maintain microblogging as a mediated social practice (Dijck, 2011) or
during this pandemic period. High volatility indicates a container of interacting activities.
uncertainty in the market and tends to fluctuate, and the Some scholars have indicated that through social media such
volatility of stock returns has a significant impact on future as Twitter, blogs or forums such as Yahoo! Financial message
market movements under the impact of shocks (Nguyen & boards or news website can capture investor sentiments, which
Nguyen, 2019). Baker and Jeffrey (2006) have indicated that have an impact on the capital market (Antweiler & Frank,
stocks with high volatility generate low returns in subsequent 2004; Sahana & Anuradha, 2019; Petit et al., 2019). Sentiment
periods. Investor interest is positively influenced by previous investor microblogging divided into three categories: those are
stock price performance, and investor sentiment from news media content (Tetlock, 2007), data search or a query
posting on the internet has predictive power for volatility on the internet (Da et al., 2014), and posting on social media
and trading volume (Kim & Kim, 2014). It makes sentiment (Antweiler & Frank, 2004; Bollen et al., 2011).
investors predict future stock returns either in aggregate or at To capture investor sentiment on social media, some
the corporate and individual level. Furthermore, Zhang et al. scholars use the text classifier method to convert and measure
(2011) also have indicated that opinion on Twitter shows a sentiment investor microblogging. Some of the methods
significant positive correlation with stock market volatility. It used are naive bayesian classification methods (Antweiler &
has indicated that the social media platform has a significant Frank, 2004; Sprenger et al., 2013). We use the top-down
impact on a stock market’s financial feature. analysis in this research; investors’ sentiment is measured
The increase in the number of social media users during and its impact on the stock market. Some researchers with
the Covid-19 pandemic, especially for those in developing this approach are (Sprenger et al., 2013; Coelho, 2019),
countries, has influenced the way people look in terms of which summarizes investor sentiment as a determinant of
seeking out information or sharing information with the public the stock market.
because social influence originating from expert investors is
more influential than the Book Value Per Share (Rahayu et al., 2.2. Hypotheses
2021). This pandemic situation makes people anxious from a
health perspective causes psychological instability for investors According to the theoretical model developed by Van
when investing in the market (Luu & Luong, 2020). From the Bommel (2003), investors who have information with limited
description above, the purpose of this study is to determine transaction capacity are motivated to disseminate information
whether microblogging investor sentiment can predict the about share prices or have the desire to post messages about
stock market in terms of market volatility and return. the shares they are trading. Individual investors are market
members with limited access to information. Individual
2. Literature Review investors are market members with limited access to
information (Hirshleifer & Teoh, 2003). With the improvement
2.1. The Relation between Microblogging Investor of information technology, social media platforms can be
Sentiment Volatility and Stock Returns sources of information for individual investors. Capturing
every opinion that appears on social media can be measured
Sentiment Investor is a study that discusses the easily and even becomes a driving force for developing
relationship between social interaction and investment research in the area of behavioral finance, especially on
(Cabarcos et al., 2019). It is not easy to measure sentiment investor sentiment through text classification technology.
or human emotions because they used surveys as a tool Emotions, opinions, or information conveyed by investors
to determine investor emotions in traditional ways. With can be easily analyzed with the naïve Bayesian classification
technological advancement and the increase in the number method (Antweiler & Frank, 2004; Sprenger et al., 2013) toPutri FARISKA, Nugraha NUGRAHA, Ika PUTERA, Mochamad Malik Akbar ROHANDI, Putri FARISKA /
Journal of Asian Finance, Economics and Business Vol 8 No 3 (2021) 0061–0067 63
deduce the relationship between the general public’s views Table 1: Training Set Tweet Manual Classification
on stocks and changes in the stock market (Bourezk et al.,
2020). Sprenger et al. (2013) use a limited rationality model Manual
Sample Tweets
approach in which individuals are subject to the persuasion Classification
bias proposed by DeMarzo et al. (2003), and assume that Trimmed Profit, AKRA Soars 15.38%
Positif
individual investors on social media platforms reflect the @ MarketMover.ID
nature of the model where group opinion is not only seen Alumina Makes Antam Loss Negatif
from its accuracy but also seen from how well a person is
#BKSL #BlueGolden Shares #Stockpick
connected to their social network. today - Early stock pick on 11/10/19 - Positif
We will look at the causal relationship between the Currently increasing + 3.4%
variables. Recent research describing the relationship
#BBCA - still eagerly awaiting
between local daily happiness sentiment extracted from Netral
bbca - TradingView
Twitter and stock returns indicate an interdependence
between online activities and the stock market (Zhao, Will it happen or not? #BBCA Netral
2020). Moreover, also to see the shocks caused by sentiment Hopefully, tomorrow #bbni will rise
Netral
investor microblogging, volatility, and return on the stock sharply. So you can just thin again
market during the Covid-19 pandemic. Based on the previous
researches, we propose the following hypothesis:
Table 2: Automatic Classification
H1: Sentiment investor microblogging can predict
volatility and returns on the capital market. Random Tweet Positif Negative Neutral
H2: Sentiment investor microblogging, volatility, and The coal mine owned 0% 11% 89%
return on the capital market have a causal relationship. by PT Adaro Indonesia
H3: The shocks sentiment investor microblogging, is one of the seven
volatility, and returns on the capital market are convergent. first-generation PKP2Bs
whose contracts expire
3. Research Method in the next few years.
“AKR Corporindo’s Net 100% 0% 0%
3.1. Naïve Bayesian Text Classification Profit Increases #AKR
“Cut Profits, AKRA Soars 0% 100% 0%
To measure opinion or information on microblogging 15.38% #AKR #AKRA
investor sentiment, we conducted a message classification
Company Hary Tanoe 0% 52% 48%
approach in line with the Naïve Bayesian classification Fight Back Moody’s
method and research indicated by (Antweiler & Frank, 2004;
Sprenger et al., 2013). Naïve Bayesian is the most widely today technical rebound 92% 0% 8%
.. hit gain out .. #bmtr
used algorithm in text classification. Daily messages or
opinions are taken from the social media platform Twitter
based on #stockcode, which are listed on the exchange From the automatic classification data, 33.45% were
consisting of 68 active stock codes taken from November negative signals, 10.92% were neutral signals, and 55.63%
2019 – November 2020. The method of taking mining were positive signals. It shows that the sentiment signals
data in the form of daily data uses the approach taken by given by microblogging sentiment investors are more
(Oh & Sheng, 2011), consists of 5 (five) phases pipeline balanced on positive signals. The accuracy of sample
system technique (1) Downloading data, (2) Pre-processing, classification is 88.02%. For this reason, errors in positive,
(3) Sentiment Analysis, (4) Prediction Classification, and negative, or neutral labeling are acceptable compared to
(5) Evaluation and Analysis. After Data Cleansing was the manual interpretation. After the classification process,
performed, the number of opinions about 2,840 tweets the next step is to convert the data set into −1 for negative
with 324 usernames. Furthermore, the data is entered into signals, 0 for neutral signals, and +1 for positive signals.
the Naïve Bayesian model, consisting of 80% training data,
namely 2,272 data and 20% testing data of 586 data. The 3.2. Financial Data Set, Variables
following is a table that presents sample data for tweets that
were randomly selected for training data with manual labels The financial data used were taken from November
as follows: 2019 – November 2020 using daily data. In this study we usePutri FARISKA, Nugraha NUGRAHA, Ika PUTERA, Mochamad Malik Akbar ROHANDI, Putri FARISKA /
64 Journal of Asian Finance, Economics and Business Vol 8 No 3 (2021) 0061–0067
daily volatility based on intra-day data constructed Parkinson 4. Results and Discussion
(1980), as follows:
We used a unit root test using the ADF (Augmented
(ln
H t
ln
Lt
) 2 Dickey-Fuller) method to see stationary data. It can be seen
VOL (1)
4 ln
2
in table 6 that the three variables used are considered to be
stationary at the level * α < 0.01, * α < 0.05, and *** α < 0.10
Where Ht and Lt show the highest and lowest daily stock provided that the absolute value of the F-statistic is < critical
prices, while the data for stock returns, the calculations used value. For this reason, all data is stationary, and the next step
in this study are based on simple return calculations, namely is to create a VAR model.
as follows: Table 4 shows the VAR model based on the optimal lag.
Rt 1
Rt In the first VAR model, where volatility is the dependent
Return = (2) variable, it is known that microblogging investor sentiment
Rt
in the t−1 and t−2 periods has an opposite relationship with
Rt is the return in a certain period, the stock return for the volatility of period t. According to Hoffmann and Post
one period in the future, so that the stock return calculation (2015), this is caused by a structural change in the mindset
is the quotient between the difference between the stock of investors related to previous investment experience
price next year and the current stock price divided by the or interpreting situations subjectively (Mitroi & Oproiu,
stock price. Both the opinion on Twitter and the volatility 2014; Malmendier et al., 2020). This result is in line with
and rate of return on shares are calculated based on each the opinion of research conducted by (Petit et al., 2019) that
stock code. The definitions of the variables used in this study argues sentiment appears as vital information and captures
are as follows: information on market variables related to microblogging
investor sentiment as well as market volatility. Like-wise
3.3: Model Specifications with the stock returns in period t−1 has an opposite
relationship with volatility. However, the stock returns in the
The VAR model is a statistical approach used in this period t−2 have a unidirectional relationship. Meanwhile, the
study, with several important analyses, including forecasting, volatility in period t−1 and t−2 has a direct relationship with
Impulse Response, forecast decomposition variance, and the sentiment in period t. Whereas in the second VAR model,
causality test (Juanda & Junaidi, 2012). In addition, in this where the return is the dependent variable, it can be seen that
study, to prove the proposed hypothesis, the Causality Test in period t-1, microblogging investor sentiment has a direct
is testing the causal relationship between the variables of the relationship with stock returns, but in period t−2, there is
Vector Autoregressive (VAR) system, which is tested using an opposite relationship; this is due to a consistent reversal
the Granger Causality test. Based on the literature review, pattern. With sentiment errors that lead to temporary price
the regression model proposed is as follows: errors (Da et al., 2014). However, the volatility in period t−1
and t−2 has a direct relationship with the return of shares,
Volatility =
f{Sentiment Investor, Return}(3) as well as return in period t−1 and period t−2 has a direct
Return = f
{Volatility, Sentiment Investor}(4) relationship with the rate of return in period t.
In the third model, where microblogging investor
Sentiment Investor = f{Volatility, Return}(5) sentiment becomes the dependent variable, the result is
that the sentiment in period t−1 and period t−2 has a direct
relationship with a sentiment in period t. This illustrates
Table 3: Definition of Variables that sentiment in the previous period still affects sentiment
in period t; this is due to the bias of conservatism, where
Variable Definition once individuals form an impression, they are slow
Microblogging Positive, Negative, and Neutral
to change that impression in the face of new evidence.
Sentiment Signals from Twitter User Investors remain skeptical about new information and only
Investor daily Opinions gradually update their views (Pompian, 2011). While the
rate of return in period t−1 and t−2 has a direct relationship
Volatility Stock movements in short - term active
with the sentiment in period t, volatility in the t−1 period
trader are calculated daily
has a significant negative effect. However, contrary to
Stocks Return Return Shares are calculated based the t−2 volatility, which has a significant positive effect,
on 68 share codes of issuers listed on this is due to the momentum where momentum occurs
the exchange because “traders” move slowly when news appears, orPutri FARISKA, Nugraha NUGRAHA, Ika PUTERA, Mochamad Malik Akbar ROHANDI, Putri FARISKA /
Journal of Asian Finance, Economics and Business Vol 8 No 3 (2021) 0061–0067 65
Table 4: Var Model
Dependent variable Dependent variable
Variable Variable
Return Sentiment Volatility Return Sentiment Volatility
Return (−1) 0.484897 0.968769 −0.026374 Sentiment (−2) −0.001058 0.135101 −0.000423
0.02029) (0.54059) (0.01039) (0.00076) (0.02028) (0.00039)
[23.9041] [1.79206] [−2.53917] [−1.39004] [6.66201] [−1.08531]
Return (−2) 0.120784 0.211554 0.024481 Volatility (−1) −0.113161 −2.833.515 0.510211
0.02024) (0.53929) (0.01036) (0.03939) −104.978 (0.02017)
[5.96871] [0.39228] [2.36253] [−2.87269] [−2.69915] [25.2945]
Sentiment (−1) 0.002209 0.264342 −0.000638 Volatility (−2) 0.049697 0.386345 0.138707
0.00076) (0.02025) (0.00039) (0.03942) −105.059 (0.02019)
[2.90646] [13.0534] [−1.63863] [1.26062] [0.36774] [6.87131]
R-squared 0.325750 0.126198 0.373203 Mean −1,36 −0,000831 −2,59
F-statistic Model 193,8151 579,3802 238,8595 Std.Dev 0,038689 1,1217 0,019595
F-statistic 156,0836 149,1304 183,9306
t-statistic −13,76337 −9,181872 −13,80163
Table 5: Granger Causality Test Table 5 use to answer the second hypothesis in this
study; it appears that microblogging investor sentiment
Null Hypothesis F-statistic Prob. has a significant effect on stock returns and vice versa at
Sentiment does not Granger the significance level or α < 0.01 and α < 0.05, so it can be
4.65196 0.0096
Cause Return concluded that between microblogging investor sentiment
Return does not Granger and stock returns have a two-way causality relationship.
3.21555 0.0403 This is in line with the opinion proposed by (Hoffmann
Cause Sentiment
& Post, 2015), which states that the rate of return has a
Volatility does not Granger
Cause Return
4.54950 0.0107 strong impact on the rate of return on sentiment formation.
Petit, et al. (2019) states that sentiment influences the
Return does not Granger future return rate. Volatility is also considered a two-way
4.17022 0.0156
Cause Volatility
causal relationship with microblogging investor sentiment
Volatility does not Granger at the significance level or α < 0.01 and α < 0.10. Like
5.06410 0.0064
Cause Sentiment Antweiler and Frank (2004), who use the online sentiment
Sentiment does not Granger on yahoo finance to predict volatility in the market, and
2.97086 0.0514
Cause Volatility Da et al. (2014), investor sentiment is closely related
to transitory daily volatility. This study also captures a
momentum appears when “ trader” overreacts to previous two-way causality relationship on volatility and stock returns
news when other news comes. According to Hong and at a significance level or α < 0.05. In other words, volatility
Stein (2007), the news will spread slowly to “news- has a significant effect on the rate of return and vice versa.
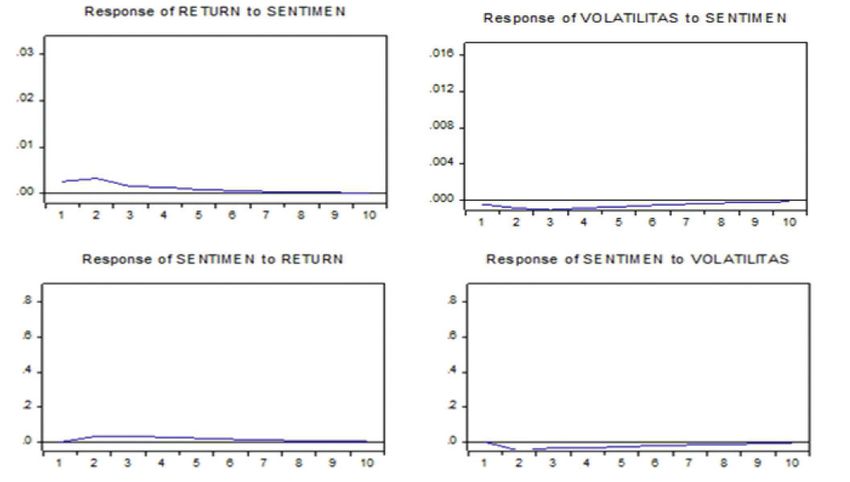
watchers” and react gradually to the news resulting in Figure 1 shows the convergent effect of each variable
“underreaction.” For this reason, it can be concluded that used in this study using the Impulse Response Function or
Indonesia’s microblogging investors are “news-watcher” IRF analysis approach. In the first graph, the response of
investors. From the results of the description above, it can return to sentiment shows a movement that is getting closer
be concluded that microblogging investor sentiment can to the balance point or returning to the previous balance
predict the volatility and rate of return of shares and, at point. This shows that the impact of the response received by
the same time, answer the first hypothesis in this study. stock returns due to 10 months of investor sentiment shocksPutri FARISKA, Nugraha NUGRAHA, Ika PUTERA, Mochamad Malik Akbar ROHANDI, Putri FARISKA /
66 Journal of Asian Finance, Economics and Business Vol 8 No 3 (2021) 0061–0067
Figure 1: Impulse Response Graph
is convergent, or the shock response will disappear over microblogging investors in Indonesia are included in the
time and will not leave a permanent effect on stock returns. “news-watcher” investor category. Second, microblogging
The response return to shocks caused by investor sentiment investor sentiment, stock returns, and market volatility
at the beginning of the response will be positive and move have a two-way causality, this is in line with the opinion of
closer to the equilibrium point. The response received by previous research built by (Hoffmann & Post, 2015) for the
volatility due to shocks to the investor is also convergent. relationship between sentiment and stock returns, and Da
The response to these shocks will disappear over time. It will et al. (2014) stated investor sentiment is closely related to
not leave a permanent effect on volatility in the stock market transitory daily volatility. Third, shocks during the Covid-19
with a negative initial response and move closer to zero. pandemic will not leave a permanent impact or shows a
Like-wise, with the response received by investor sentiment convergent effect for microblogging investor sentiment
due to shocks caused by stock returns and stock market shocks on stock returns and market volatility
volatility; as a result, these shocks will eventually disappear
and leave no permanent effect. The impact of investor References
sentiment on volatility and stock returns or vice versa has a
short term impact, and this factor is in line with the results Antweiler, W. & Frank, M. Z. (2004). Is all that talk just noise?
of research on investor underreaction where they sometimes The information content of internet stock message boards.
make mistakes where they do not react to financial news and The Journal of Finance, 59(3), 1259–1294. https://doi.org/
10.2139/ssrn.282320
over the next six months, these errors are gradually corrected
because stock prices slowly move towards levels that should Baker, M., & Wurgler, J. (2006). Investor Sentiment and the Cross-
be (Barberis et al., 1998). This explanation also indicates Section of Stock Returns. The Journal of Finance, 61(4),
that the market is inefficient. 1645–1680. https://doi.org/10.1111/j.1540-6261.2006.00885.x
Barberis, N., Shleifer, A., & Vishny, R. (1998). A model of investor
5. Conclusions sentiment. Journal of Financial Economics, 49(3), 307–343.
https://doi.org/10.1016/s0304-405x(98)00027-0
First, with the increasing number of social media users Bollen, J., Mao, H., & Zeng, X. (2011). Twitter mood predicts the
during the Covid-19 pandemic, information, news, or stock market. Journal of Computational Science, 2(1), 1–8.
opinions posted on social media, especially on the Twitter https://doi.org/10.1016/j.jocs.2010.12.007
platform, have been converted into positive, negative, and Bourezk, H., Raji, A., Acha, N., & Barka, H. (2020). Analyzing
neutral sentiments. This sentiment appears as a strong source Moroccan Stock Market using Machine Learning and Sentiment
of opinion or information. It impacts stock returns with a Analysis. 2020 1st International Conference on Innovative
significant positive impact and a significant negative impact Research in Applied Science, Engineering and Technology.
on market volatility. The conservatism bias is a factor in https://doi.org/10.1109/iraset48871.2020.9092304
the relationship between microblogging investor sentiment Coelho, J., D’almeida, D., Coyne, S., Gilkerson, N., Mills, K., &
and financial features, and the research concludes that Madiraju, P. (2019). Social Media and Forecasting StockPutri FARISKA, Nugraha NUGRAHA, Ika PUTERA, Mochamad Malik Akbar ROHANDI, Putri FARISKA /
Journal of Asian Finance, Economics and Business Vol 8 No 3 (2021) 0061–0067 67
Price Change. 2019 IEEE 43rd Annual Computer Software and Nguyen, C. T., & Nguyen, M. H. (2019). Modeling Stock Price
Applications Conference (COMPSAC). https://doi.org/10.1109/ Volatility: Empirical Evidence from the Ho Chi Minh
compsac.2019.10206 City Stock Exchange in Vietnam. The Journal of Asian
Da, Z., Engelberg, J., & Gao, P. (2014). The Sum of All FEARS Finance, Economics, and Business, 6(3), 19–26. https://doi.
Investor Sentiment and Asset Prices. Review of Financial org/10.13106/JAFEB.2019.VOL6.NO3.19
Studies, 28(1), 1–32. https://doi.org/10.1093/rfs/hhu072 Oh, C., & Sheng, O. (2011). Investigating predictive power of
DeMarzo, P. M., Vayanos, D., & Zwiebel, J. (2003). Persuasion stock micro blog sentiment in forecasting future stock price
Bias, Social Influence, and Unidimensional Opinions. directional movement. In: ICIS, 1–19.
The Quarterly Journal of Economics, 118(3), 909–968. https:// Parkinson, M. (1980). The extreme value method for estimating
doi.org/10.1162/00335530360698469 the variance of the rate of return. Journal of Business, 53(1),
Dijck, J. (2011). Tracing Twitter: The rise of a microblogging 61–65. https://doi.org/10.1086/296071
platform. International Journal of Media & Cultural Politics, Piñeiro-Chousa, J. R., López-Cabarcos, M. Á., & Pérez-Pico,
7(3), 333–348. https://doi.org/10.1386/macp.7.3.333_1 A. M. (2016). Examining the influence of stock market
García Petit, J. J., Vaquero Lafuente, E., & Rúa Vieites, A. (2019). variables on microblogging sentiment. Journal of Business
How information technologies shape investor sentiment: Research, 69(6), 2087–2092. https://doi.org/10.1016/j.
A web-based investor sentiment index. Borsa Istanbul Review, jbusres.2015.12.013
19(2), 95–105. https://doi.org/10.1016/j.bir.2019.01.001 Pompian, M. M. (2011). Behavioral Finance and Wealth
Hirshleifer, D., & Teoh, S. H. (2003). Limited attention, information Management: How to Build Optimal Portfolios That Account
disclosure, and financial reporting. Journal of Accounting for Investor Biases (Wiley Finance Book 318) (1st ed.). Wiley.
and Economics, 36(1–3), 337–386. https://doi.org/10.1016/j. Qian, B., & Rasheed, K. (2006). Stock market prediction with
jacceco.2003.10.002 multiple classifiers. Applied Intelligence, 26(1), 25–33. https://
Hoffmann, A. O. I., & Post, T. (2015). How return and risk doi.org/10.1007/s10489-006-0001-7
experiences shape investor beliefs and preferences. Accounting Rahayu, S., Rohman, S., & Harto, P. (2021). Herding Behavior Model
and Finance, 57(3), 759–788. https://doi.org/10.1111/acfi.12169 in Investment Decision on Emerging Markets: Experimental
Hong, H., & Stein, J. C. (2007). Disagreement and the Stock in Indonesia. The Journal of Asian Finance, Economics, and
Market. Journal of Economic Perspectives, 21(2), 109–128. Business, 8(1), 53–59. https://doi.org/10.13106/JAFEB.2021.
https://doi.org/10.1257/jep.21.2.109 VOL8.NO1.053
Juanda, B. & Junaidi, J. (2012). Time Series Econometrics. Bogor, Sahana, T. P., & Anuradha, J. (2019). Analysis and Prediction of
Indonesia: IPB Press. Stock Market Using Twitter Sentiment and DNN. Advances
in Intelligent Systems and Computing, 38–45. https://doi.
Kim, S.-H., & Kim, D. (2014). Investor sentiment from internet org/10.1007/978-3-030-30465-2_5
message postings and the predictability of stock returns.
Journal of Economic Behavior & Organization, 107, 708–729. Sprenger, O. T., Tumasjan, A., Sdanner, G. P., & Welpe, M. I.
https://doi.org/10.1016/j.jebo.2014.04.015 (2013). Tweets and Trades: the information content of
stock microblogs. European Financial Management. 20(5):
López-Cabarcos, M. Á., Pérez-Pico, A. M., Vázquez-Rodríguez, P., 926–957. https://doi.org/10.1111/j.1468-036x.2013.12007.x
& López-Pérez, M. L. (2019). Investor sentiment in the
theoretical field of behavioural finance. Economic Research- Tetlock, P. (2007). Giving Content to Investor Sentiment:
Ekonomska Istraživanja, 33(1), 2101–2119. https://doi.org/10. The Role of Media in the Stock Market. The Journal of
1080/1331677x.2018.1559748 Finance, 62(3), 1139–1168. https://doi.org/10.1111/j.
1540-6261.2007.01232.x
Luu, Q. T., & Luong, H. T. T. (2020). Herding Behavior in Emerging
and Frontier Stock Markets During Pandemic Influenza Panics. Van Bommel, J. (2003). Rumors. The Journal of Finance, 58(4),
The Journal of Asian Finance, Economics and Business, 7(9), 1499–1520. https://doi.org/10.1111/1540-6261.00575
147–158. https://doi.org/10.13106/jafeb.2020.vol7.no9.147 Zhang, X., Fuehres, H., & Gloor, P. A. (2011). Predicting Stock
Malmendier, U., Pouzo, D., & Vanasco, V. (2020). Investor Market Indicators Through Twitter “I hope it is not as bad as
experiences and international capital flows. Journal of I fear.” Procedia - Social and Behavioral Sciences, 26, 55–62.
International Economics, 124, 103302. https://doi.org/ https://doi.org/10.1016/j.sbspro.2011.10.562
10.1016/j.jinteco.2020.103302 Zhao, R. (2020). Quantifying the cross sectional relation of daily
Mitroi, A., & Oproiu, A. (2014). Behavioral finance: new research happiness sentiment and stock return: Evidence from US.
trends, socionomics and investor emotions. Theoretical and Physica A: Statistical Mechanics and its Applications, 538,
Applied Economics, XXI,4(593), 153–166. 122629. https://doi.org/10.1016/j.physa.2019.122629You can also read