PREDICTION OF THE INDIAN STOCK INDEX USING NEURAL NETWORKS
←
→
Page content transcription
If your browser does not render page correctly, please read the page content below
Jharkhand Journal of Development and Management Studies
XISS, Ranchi, Vol. 16, No.1, March 2018, pp. 7609-7621
      PREDICTION OF THE INDIAN STOCK INDEX USING
                  NEURAL NETWORKS

                Sitaram Pandey1 & Amitava Samanta2

        Stock prices prediction is an issue of interest in stock markets.
        Many prediction techniques have been reported in stock forecasting.
        Now a days, neural networks are viewed as one of the most suitable
        techniques. In this study also, an experiment on the forecasting of
        the nifty index of national stock exchange was conducted by using
        feed forward back propagation neural networks. The local and global
        fac to rs influencing the natio nal sto ck mark et we re used in
        developing the models that includes gold prices, dollar-rupee
        exchange rates & nifty volume. Three years’ historical data were
        used to train and test the models. Four suitable neural network
        models identified by this research are a four layer neural network.
        But it was found through performance measure MSE (Mean Square
        Error) that movement of nifty index is insensitive to gold prices’
        fluctuations & dollar exchange rate fluctuations.

        Keywords : Artificial Neural Network, Nifty Index, Stock Prediction,
        Performance measures

Introduction
Prediction of future trends of any financial market is still a most
lucrative field of research. Here, we are focusing our research on Indian
stock market. There are innumerable numbers of researches based on
different models from fundamental analysis to machine learning
techniques are available globally on this topic but fewer in Indian
context. Prediction in the stock market is the need of all the stock
traders to take informed decisions in trading of stocks. Many
researchers have concluded that Indian stock market does not follow
efficient market hypothesis (EMH) which specifies that there is a room
for stock market forecasting. While the debate on the various issues
related to efficiency of market, predictive models, tools etc. is ongoing,
this encourages various researchers to seek better model for stock
prediction. Techniques of prediction vary greatly based on the availability
of data, quality of data, requirement specification, and the underlying
assumptions used.
       There are various linear and non-linear models to describe the
behavior of time series but their success rate is diminishing in predicting
the financial markets, though these techniques are statistically powerful.

1
    Assistant Professor, Department of MBA, Cambridge Institute of Technology,
    Ranchi Jharkhand. Phone No. 7858882626, Mail Id : spandey1203@gmail.com
2
    Associate Professor, Department of Commerce & Management, Vinoba Bhave
    University, Hazaribag, Jharkhand. Phone Number: 09431795999, Email ID:
    dramitava1@yahoo.com

                                       7609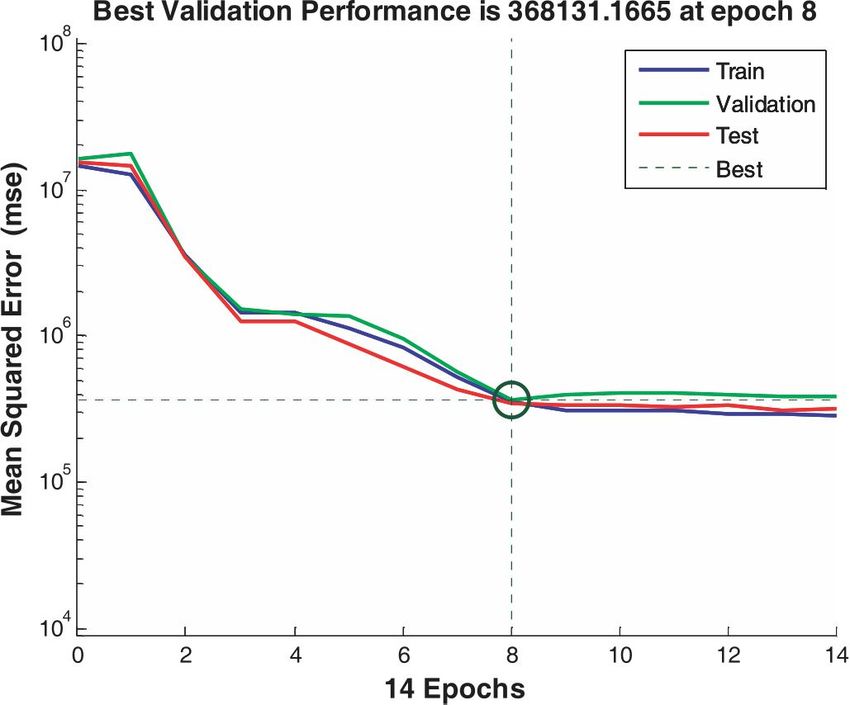
7610                                                    Pandey & Samanta

As we know, stock markets are very unpredictable so their high
frequency data are highly time-variant and in non-linear pattern. It is
a challenging task to predict future prices of a stock based on past
experiences. Bollerslev (1986) has given a solution in the form of general
autoregressive conditional heteroscedasticity (GARCH) model which has
solved the problem of time-series data to a greater extent. This model
was proven as one of the strongest weapon since it was invented for the
analysis of time-series data and successfully has been used for last 20
years. This model has a capacity to capture all the irregularities of
economic time series data but these days the model has started losing
its shine now. Now, neural networks has started replacing these models.
Now a days, neural networks are regarded as more suitable for stock
prediction than other techniques. Unlike other techniques that construct
functional forms to represent relationships of data, neural networks
are able to learn patterns of relationship from data itself. In modern
quantitative and empirical finance, Artificial neural networks (ANN)
are proven as one of the most powerful tool and have emerged as a
significant statistical modeling technique. The ANN models are
emerging technology that has capacity to detect the underlying
functional relations within a set of data and perform data analysis in
applications such as pattern recognition, prediction, classification,
modeling, evaluation and control. Therefore, a variety of neural network
models have been created. Several features of ANN model making it
successful now a day. Firstly, it can handle non-linear data and able to
model nonlinear systems without prior knowledge of relationship
between the input and output variables. The back propagation neural
network is a popular neural network model; there are many successful
applications for back propagation neural networks in science,
engineering and finance. Secondly, ANN models are capable of handling
the limitations of time series data.
       Stock market is considered as the mirror of the economy whether
developed or developing. It is now considered as a barometer to measure
the economic condition of a country because every major change in
economy is reflected in the prices of share. The rise and fall in the
share prices indicates the boom or recession cycle of the economy. Now,
it has been proved by various researchers that a well regulated stock
market renders various economic services to their people. Emerging
stock markets have recently been of great importance to the worldwide
investment community. So, India is considered as one of the fastest
emerging markets in the world due to its established stock exchanges
with a long history of organized trading in securities. Over the last few
years, there has been a rapid change in the Indian capital market in
terms of technology, trading styles & settlement processes. According
to the recent survey, there are around 28 emerging markets in the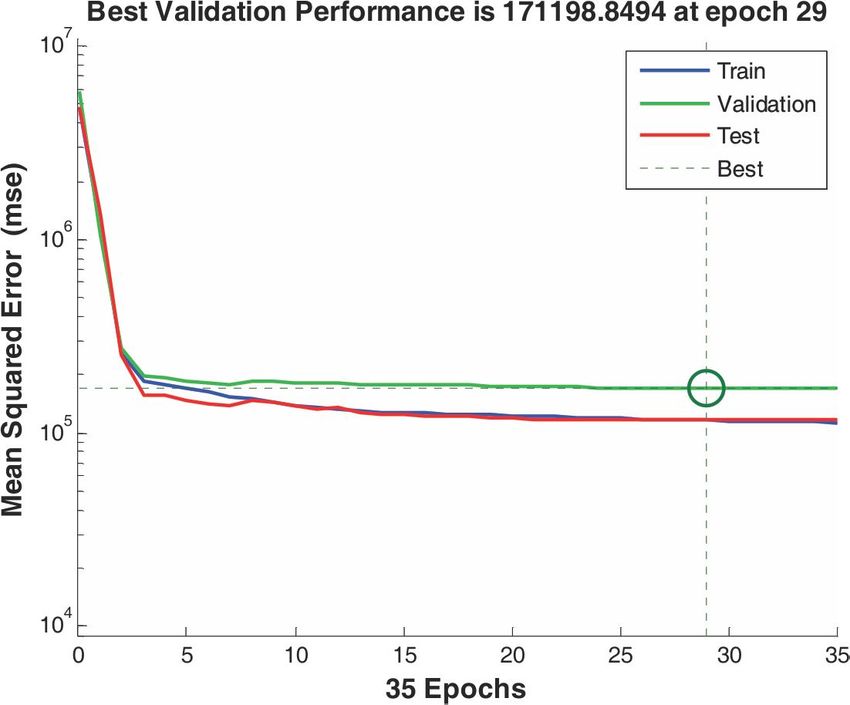
Prediction of the Indian stock index using neural networks            7611

world out of which India ranks in the second place. Currently, India is
the 4th largest economic system in the world in terms of the purchasing
power parity. In this research, we are basically focusing on the behavior
of share prices which are governed by the various rational, emotional,
economic, geographical and psychological factors.
       In this study, we are taking the S&P CNX Nifty as our national
stock index for study, it is a stock market index and benchmark index
for Indian equity market. The S&P CNX Nifty covers 22 sectors of the
Indian economy and offers investment managers exposure to the Indian
market in one portfolio. The S&P CNX Nifty stocks represent about
67.27% of the free float market capitalization of the stocks listed
at National Stock Exchange (NSE) as on September 30, 2017.
      This study investigated the Indian stock market using feed
forward back propagation neural networks. It aimed to find suitable
neural network models for the prediction of the next day of the S&P
CNX Nifty index by applying three time series data, expected to be the
factors influencing the stock market, to the models created. The rest of
the paper is organized as follows: Section 2 examines the literature
review. Section 3 presents the objective of the study. Section 4 discusses
the variables, data sources, research design & methodology, ANN &
performances measures. Section 5 presents the data analysis &
discussion and Section 6 summarizes and concludes.
Artificial Neural Network
According to Christos Stergiou and Dimitrios Siganos, Artificial neural
network (ANN) is an information processing model where the
constituents called neurons, process the information and is motivated
by biological nervous system of human brain. The key element of this
model is its unique method of information processing system. It is made
up of several numbers of interconnected processing constituents working
together to solve specific problems. As per Burgund and Marsolek (1997),
in Advances in Psychology, any ANN can be thought of as a set of
interconnected units broadly categorized into three layers of processing
units. These three layers are the input layer, the hidden layer and the
output layer. Inputs are fed into the input layer, and its weighted outputs
are passed onto the hidden layer . The input signal passes through the
network in the forward direction. These processing units can be referred
as nodes. The directed graphs consists of nodes and each nodes are
connected to perform some basic calculations and each connection
carries a signal from one node to another labeled by some unique number
termed as weight that modulate signal. Here in this paper, we are
taking into account feed forward networks , in which connection is
forwarded from layer 0 to layer 1 , layer 1 to layer 2 & layer 2 to layer
3. Each layer consists of nodes. The connection is represented by a
7612 Pandey & Samanta
sequence of numbers indicating number of nodes in each layer. For
example, 3-3-2-1 feed forward network; it indicates three nodes in the
input layer (layer 0), three nodes in the first hidden layer (layer 1) , two
nodes in second hidden layer (layer 2) , and two nodes in the output
layer (layer 3). Here back propagation algorithm (Rumelhart, Hinton
& McClellnad, 1986) is used in layered feed-forward ANNs. The network
is a multi-layer perception that contains at least one hidden layer along
with input and output layers.
Review of literature
Bashambu, Sikka & Negi (2018) in their paper applied machine learning
techniques on the past data to predict the movement of the stock prices
and found that although neural networks are not perfect in prediction
but they are outperforming all other methods.
Hafezi, Shahrabi & Hadavandi (2015) in their research proposed a new
intelligent model in a multi-agent framework called bat-neural network
multi-agent system (BNNMAS) to predict stock prices of DAX. The
results have shown that BNNMAS is better than the genetic algorithm
neural network (GANN) and some standard models like generalized
regression neural network (GRNN), etc.
Laboissiere, Fernandes & Lage (2015) through their research
proposed a methodology that forecasts the maximum and minimum
day stock prices of three Brazilian power distribution companies and
actual prediction was carried out by ANNs whose performances were
evaluated through MAE, MAPE & RMSE calculations and found results
effective and helpful for investors.
Adebiyi, Adewumi & Ayo (2014) in their paper “comparison of
ARIMA and artificial neural networks models for stock price prediction”
examined the forecasting performance of ARIMA and artificial neural
networks model with data of NYSE and concluded superiority of neural
networks model over ARIMA model.
Al-Radaideh, Assaf, & Alnagi (2013) used data mining techniques
for prediction of stock prices. In their study, they tried to help the
investors in the stock market to decide the better timing for buying or
selling stocks on the basis of information obtained from the historical
prices of stocks. Their decisions based on decision tree classifier, which
is based on CRISP-DM methodology, are used over real historical data
of major companies listed in Amman Stock Exchange (ASE).
Niaki & Hoseinzade (2013) have tried to forecast S&P 500 index
using artificial neural networks and design of experiments. The results
of employed methodology show that the ANN is able to forecast the
daily direction of S&P 500 significantly better than the traditional logitPrediction of the Indian stock index using neural networks 7613
model and ANN could significantly improve the trading profit as
compared with the buy-and-hold strategy.
Sureshkumar & Elango (2012) analyzed the performance of model
of stock price prediction using artificial neural network. They found
that multi layer perception (MLP) architecture with back propagation
algorithm has the ability to predict with greater accuracy than other
neural network algorithms. This would help the investor to analyze
better in business decisions such as buy or sell a stock.
Dase, Pawar & Daspute (2011) elaborated methodologies for
prediction of stock market and focused on an artificial neural network
and found that ANN model was more useful for stock market prediction.
Artificial neural network, a computing system containing many simple
non-linear computing units as neurons interconnected by links, is a
well-tested method for financial analysis on the stock market.
Dase & Pawar (2010) used artificial neural network model (ANN)
for stock market predictions and found that prediction of stock index
with ANN model is easier and more suitable than traditional time series
analysis. A neural network has the ability to extract useful information
from large set of data.
Ahangar, Yahyazadehfar, & Pournaghshband (2010) in their
research paper “The comparison of methods artificial neural network
with linear regression using specific variables for prediction stock price
in Tehran stock exchange” considered 10 macro economic variables
and 30 financial variables to estimate the stock price using Independent
components analysis (ICA) and later they found that artificial neural
network method is more efficient than linear regression method.
Ganatr & Kosta (2010) focused to build neural network for stock
market predictions. Authors used R tool to implement the neural
network with closing price, turnover, global indices, interest rate, and
inflation as a neural network input. Authors also proposed to include
other indicator like news, currency rate and crude price as input to the
neural network. Subsequently, an attempt was made to build and
evaluate a neural network with different network parameters and also
with technical and fundamental data and found that the price prediction
proves to be successful.
Dutta, Jha, Laha & Mohan (2006) have used artificial neural
network models for forecasting stock price index in the Bombay stock
exchange. They study the efficacy of ANN in BSE Sensex weekly closing
values. They had developed two networks with three hidden layers for
the purpose of this study. The root mean square error (RMSE) and
mean absolute error (MAE) are chosen as indicators of performance of
the networks.7614 Pandey & Samanta
Thenmozhi (2006) has applied neural network models to predict
the daily returns of the BSE (Bombay Stock Exchange) Sensex.
Multilayer perception network is used to build the daily return’s model
and the network is trained using Error Back Propagation algorithm. It
was found that the predictive power of the network model is influenced
by the previous day’s return than the first three-day’s inputs. The study
showed that satisfactory results can be achieved when applying neural
networks to predict the BSE Sensex.
Objectives of the study
The main objective of this study is to use neural networks prediction
tool to predict stock prices with more accuracy and to use performance
measures for their evaluation. The study makes an attempt to identify
extent of impact of various factors on stock prices through neural
networks. The study wants to help participants of the market to predict
the prices more accurately by reducing error percentage.
Data collection & methodology
The actual problem discussed in this paper is to forecast the Nifty index
of national stock exchange of India. For this purpose, we have used
available daily data of Nifty from the NSE beginning from 01 –January-
2015 to 31- December- 2017. For this study, we have taken data of
closing prices of three above mentioned years, Volume of Nifty, Data of
exchange rates & Gold prices of said years. In order to predict the stock
price, past data is necessary and it has been collected for the trading
days from 01 –January-2015 to 31- December- 2017. The historical
data was collected from different websites1,2,3.
The main task is to predict whether the price of nifty index will
be up or down tomorrow by using the historical values of the Nifty
index. In this research we have chosen three important dependent
variables which include gold prices, exchange rates of dollar-rupees &
Nifty volumes. The result of any neural network is mostly dependent
on the composition of the neural network. Intricacy of any neural
network depends on the level of task and accordingly hidden layers can
be added to the network to achieve the desired level of accuracy. The
software chosen in this paper for creating, training and testing the
networks is MATLAB Neural Network Toolbox, which has an extensive
capability in terms of creating and training different types of networks.
Input data variables & methodology
The two types of input variables can be used for stock market index
forecasting with neural networks. The first type of variables is related
to macroeconomic indicators such as GDP rate, Inflation, FDI, Currency
exchange rates, gold prices, developed market indicators etc, the otherPrediction of the Indian stock index using neural networks 7615
types of variables are market related indicators such as prices, dividends,
trading volume, turnover, etc. In this study we have used exchange
rates & gold prices as macroeconomic indicators and prices & volumes
as market indicators.
Input data was processed to achieve better predictive results in
the application of neural networks on financial time series. In this study,
data were collected and transformed through first differencing and
logarithmic transformation of the return variable.
As in the most other studies (Maciel & Ballini, 2010), in this
study also for neural networks the time series data was partitioned
into three different sets, first set for the training, second set for the
testing and the third set for the validation of networks and it is the
common practice to split dataset into three partitions with different
quantum of data set in different partitions to make the network more
robust. The training set is the largest set and it is used in the neural
networks to learn the patterns present in the data. The testing set
whose range vary up to 30% of the training set is used to figure out the
generalization capacity of estimated trained network. At last, validation
set should be of size that can evaluate a trained network efficiently and
this set should consist of most recent observations. Although validation
set uses past values to test the neural networks and to evaluate the
generalization capability of the model. In this work we have partitioned
data as follows: training set -70%, testing set -15% & validation set -
15%. The application of these three divided sets are as follows: Training
set was used to adjust the network to make it error free. Validation set
was used to measure network generalization and testing set was used
to measure the network performance during and after training. In this
model, random regression function was split to overcome over fit models.
Neural Network Structure
In neural network algorithm each independent variable that has been
processed is represented by its own input neurons. A two-layer-feed-
forward network, with sigmoid hidden and soft max output neurons,
can classify vectors arbitrarily well, given enough neurons in its hidden
layer. Tansig is used here as a neural transfer function. Transfer
functions calculate a layer’s output from its net input. This is
mathematically equivalent to tanh (N). N is the S-by-Q matrix of net
input vectors. The network will be trained with scaled conjugate gradient
back propagation. In the broadest sense, there are three main
requirements for any successful ANN model:
In-sample accuracy
The ability of the model to perform with new data.
Stability, consistency of the network output.7616 Pandey & Samanta
To ensure the above points are successfully met, a large number
of considerations need to be taken into account. Our tests included data
pre-processing techniques, the number of layers, the choice of activation
function, learning rate, training time and the number of hidden neurons.
After several combinations of experiments, the architecture was finalized
for all the main experiments. The goal is to use the least amount of
neurons which generate the best results for out-of-sample. A simple
approach was used in this paper based on starting with very small
number of neurons and training and testing the networks to a fixed
number of iterations. The hidden neurons are increased gradually until
the optimal number of neurons is found. There is no any rule of thumb
to find optimal number of neurons required in hidden layers. Here, it
was found through trial and error method for the minimum squared
error (MSE) and through test set. Every time a new input (or lagged
value of the same variable) was added, we started with 1 hidden neuron
and added one each time up to 10.
Performance measures
The ultimate goal of this study is to forecast the direction of the price,
since it is very difficult to correctly predict the magnitude of the price
for financial data. Hence, prediction of direction of nifty index is sufficient
to fulfill this goal. The success ratio for direction prediction (or the hit
rate) was considered.
h= (1)
z =1 if , > 0, and 0 otherwise.
Where: n is the sample size, +1 , +1 , are the value of the
target and the output at time t+1 consecutively.
The MSE (Mean squared error) is by far the most used metric for
ANN performance regardless of the network goal. Furthermore, the
correlation coefficient R and 2 was also used; as a measure of the
linear correlation between the forecasted value and the actual one. Mean
squared error was calculated. Finally, the information coefficient given
by equation 2 was used.
∑ =1( − )2
IC = (2)
∑ =1( − −1 )2
Where: y is the predicted value, and x is the actual value. This
ratio provides an indication of the prediction compared to the trivial
predictor based on the random walk, whereas IC >1 indicates poor
prediction, and IC < 1 means the prediction is better than the random
walk. The different neural network models were constructed by usingPrediction of the Indian stock index using neural networks 7617
the three input nodes in an input layer. Some models are shown in
table 1, where the first number is the number of nodes in the input
layer, the second number is the number of nodes in the first hidden
layer and so on. The last number is the node of the output layer, which
is 1.
Results & analysis
Starting from one lag up to 20 lagged value of the spot price was tested.
The results obtained from input transformed by equation (3) were very
poor and the hit rate was 46% for out-of-sample.
− −1
=( ) (3)
−
−2 −1 +
=( −2
) (4)
−
While the results generated by equation (4) was much better
around 60% (equation 4 contains 2 step differencing) the combination
of eq (3) & eq (4) as input with eq (4) alone as output seems to produce
much better results. For different combinations of data and parameters,
this performance curve varies. Training of the model stops either when
it reaches to the stated number of epochs (fig.1) or when Mean Squared
Error (MSE) is almost not improving after certain epochs. The circle in
the performance curve shows the best validation performance. The
following networks were trained to identify the best performing networks.
The networks trained and retrained using levenberg-marquardt and
scaled conjugate gradient. The first network is 3-3-1-1 which is trained
and retrained using levenberg-marquardt and scaled conjugate gradient.
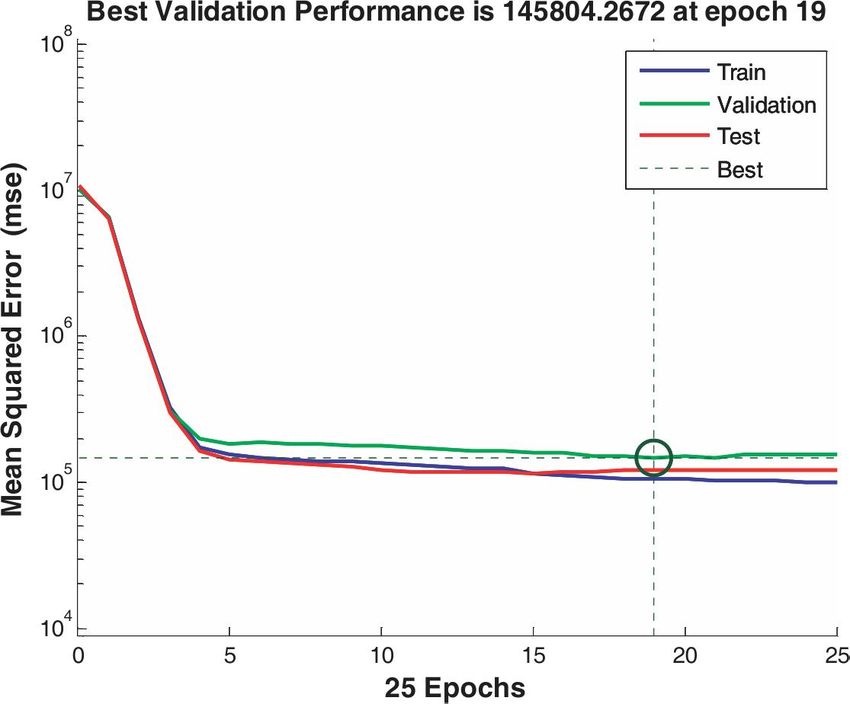
Fig-1. Performance curve of Primary Working Set Data of network 3-3-1-1
Source : Matlab7618 Pandey & Samanta
Next network is 3-7-1-1 which is also trained using above method.
Fig-2 : Performance curve of Primary Working Set Data of
network 3-7-1-1
Source : Matlab
The other network is 3-10-1-1 trained as above.
Fig-3 : Performance curve of Primary Working Set Data of
network 3-10-1-1
Source : MatlabPrediction of the Indian stock index using neural networks 7619
Next network is 3-13-1-1 which is also trained by the same procedure.
Fig-4 : Performance curve of Primary Working Set Data of
network 3-13-1-1
Source : Matlab
The best model for four layered neural networks was 3-7-1-1.
The summary of performance measures of the nifty Index through
the network 3-7-1-1.
Metrics Samples MSE R2
Training 521 0.0002 0.21
Validation 111 0.0005 0.23
Testing 111 0.0007 0.19
Source : Matlab
The network structure for the benchmark consisted of four layers
feed forward with 7 hidden neurons and 0.01 learning rate. The network
was trained with Levenberg-Marquardt algorithm & scaled conjugate
gradient.
Conclusions
The study has presented the prediction of the Nifty index using multi
layer feed forward back propagation neural networks. The most suitable
network model for the Nifty index production is 3-7-1-1 but their
prediction performance measured by MSE is nil and correlation is also
found as nil. Thus this study supports that movement of Nifty index is
insensitive to gold prices’ fluctuations & dollar exchange rate
fluctuations.7620 Pandey & Samanta
REFERENCES
Adebiyi, A. A., Adewumi, A. O., & Ayo, C. K. (2014). Comparison of ARIMA and
artificial neural networks models for stock price prediction. Journal of
Applied Mathematics. Retrieved from file:///C:/Users/Welcome/Downloads/
614342.pdf
Ahangar, R. G., Yahyazadehfar, M., & Pournaghshband, H. (2010). The comparison
of methods artificial neural network with linear regression using specific
variables for prediction stock price in Tehran stock exchange. International
Journal of Computer Science and Information Security, IJCSIS, 7(2), 038-
046.
Al-Radaideh, Q. A., Assaf, A. A., & Alnagi, E. (2013). Predicting stock prices using
data mining technique s. In The Inter national Ar ab Confere nce on
Information Technology (ACIT’2013). Retrieved from http://acit2k.org/ACIT/
2013Proceedings/163.pdf
Bashambu, S., Sikka, A., & Negi, P. (2018). Stock price prediction using neural
networks. International Journal of Advance Research, Ideas and Innovations
in Technology, 4(1), 603-606.
Bollerslev, T. (1986). Generalized autoregressive conditional heteroskedasticity.
Journal of econometrics, 31(3), 307-327.
Burgund, E. D., & Marsolek, C. J. (1997). Case-specific priming in the right cerebral
hemisphere with a form-specific perceptual identification task. Brain and
Cognition, 35(2), 239-258.
Dase, R. K., & Pawar, D. D. (2010). Application of artificial neural network for stock
market predictions: A review of literature. International Journal of Machine
Intelligence, 2(2), 14-17.
Dase, R.K., Pawar, D. D., & Daspute, D.S. (2011). Methodologies for Prediction of
Stock Market: An Artificial Neural Network. International Journal of
Statistika and Mathematika, 1(1), 08-15.
Dutta, G., Jha, P., Laha, A. K., & Mohan, N. (2006). Artificial neural network
mo dels for for ecasting sto ck price index in the Bo mbay sto ck
exchange. Journal of Emerging Market Finance, 5(3), 283-295.
Ganatr, A., & Kosta, Y. P. (2010). Spiking back propagation multilayer neural
network design for predicting unpredictable stock market prices with time
ser ies analysis. Internatio nal Jour nal of Computer Theo ry and
Engineering, 2(6), 963.
Hafezi, R., Shahrabi, J., & Hadavandi, E. (2015). A bat-neural network multi-agent
system (BNNMAS) for stock price prediction: Case study of DAX stock
price. Applied Soft Computing, 29, 196-210.
Laboissiere, L. A., Fernandes, R. A., & Lage, G. G. (2015). Maximum and minimum
stock price forecasting of Brazilian power distribution companies based on
artificial neural networks. Applied Soft Computing, 35, 66-74.
Maciel, L.S., & Ballini, R.(2010). Neural networks applied to stock market forecasting:
An empirical analysis. Journal of the Brazilian Neural Network Society,
8(1), 3-22.
Niaki, S. T. A., & Hoseinzade, S. (2013). Forecasting S&P 500 index using artificial
neural networks and design o f experiments. Jo urnal o f Indus trial
Engineering International, 9(1), 1.
Rumelhart, D. E., Hinton, G. E., & McClelland, J. L. (1986). A general framework
for parallel distributed processing. In Jerome A. Feldman, Patrick J. Hayes
& David E. Rumelhart (Eds.), Parallel distributed processing: Explorations
in the mic rost ruct ure of cognitio n, 1(pp. 45-76). MA, USA: MIT
Press Cambridge.Prediction of the Indian stock index using neural networks 7621
Sureshkumar, K. K., & Elango, N. M. (2012). Performance analysis of stock price
prediction using artificial neural network. Global Journal of Computer
Science and Technology, 2(1). Retrieved from file:///C:/Users/Welcome/
Downloads/426-1-426-1-10-20150122.pdf
Thenmozhi, M. (2006). Forecasting stock index returns using neural networks. Delhi
Business Review, 7(2), 59-69.
Websites
1
https://www.nseindia.com/products/content/equities/indices/
historical_index_data.htm, retrieved on 20/01/2018
2
https://in.investing.com/commodities/gold-historical-data, retrieved on 20/01/2018
3
https://in.investing.com/currencies/usd-inr-historical-data, retrieved on 20/01/2018You can also read