2019 PROTECTING OUR OCEAN - EUROPE'S CHALLENGES TO MEET THE 2020 DEADLINES - Panda
←
→
Page content transcription
If your browser does not render page correctly, please read the page content below

TECHNICAL
     ANNEX
           EU

    2019
PROTECTING OUR OCEAN -
EUROPE’S CHALLENGES TO MEET THE 2020 DEADLINES
OVERVIEW OF DATA AND METHODS FOR THE ASSESSMENTS ON MARINE PROTECTION IN THE EU
Marine Protected Areas (MPAs) are tools designed to provide spatial protection for specific species, habitats or
processes in marine ecosystems. The first stage of MPA development, the legal designation of an area for marine
protection, has been extensively surveyed in Europe.1 However, the following stages of developing a management
plan, implementing it and ensuring effective management of the MPA to achieve the conservation objectives for
the protected species and habitats has not previously been assessed at the EU level. Mere designation of an area
as an MPA does not yet provide any biodiversity protection, therefore assessing the following steps is crucial for
understanding the actual protection provided to the marine environment.

According to internationally agreed goals, which the EU and its Member States have signed up to, 10% of the
ocean must be effectively protected by 2020 (Convention on Biological Diversity Aichi target 11 and the United
Nations Sustainable Development Goal 14). With only a year left to reach this goal, this assessment focussed
on management plan development for the designated MPAs. MPA management plan data, readily available
across international and regional databases, was used as a proxy for an MPA taking the first steps towards an
area effectively protecting marine habitats and species. In an ideal world this assessment would also reveal the
MPAs already under efficient protection (carrying out actions for conservation and/or active nature restoration
that results in actual protection), but due to the lack of detailed reporting and transparency on the MPAs this
assessment could not be carried at the EU level.

The outcome of the assessment is poor. In the final year before the 2020 deadline for 10% of the ocean to be
protected the European seas significantly lack appropriate biodiversity protection. Only 1.8% of the EU seas are
covered by MPAs with management plans, despite 12.4% of the EU marine area being designated for protection.
Eleven EU Member States have not reported any management plans for their MPAs and are unlikely to reach the
target of 10% in the remaining year. A further eight Member States have management plans for less than 10%
of their marine area, which means that one year before the deadline, a total of 19 of the 23 marine EU Member
States are not yet meeting the set targets. In addition to this, the existing MPA network is poorly designed. A
well designed network would support ecological coherence, which links the individual MPAs to form a network
providing biodiversity protection also outside the border of the MPAs. However, this assessment shows that the
current MPA networks in the Baltic Sea, the North East Atlantic and the Mediterranean Sea are not supporting
ecological coherence, and are failing to provide wider network protection.

For further information about the assessments, please contact:
Janica Borg, Marine Protection and Spatial Planning Policy Coordinator
jborg@wwf.eu
epo-marine-team@wwf.eu

1 	HELCOM 2010. Towards an ecologically coherent network of well-managed Marine Protected Areas – Implementation report on the status and ecological coherence of
    the HELCOM BSPA network. Baltic Sea Environmental Proceedings No. 124B.; OSPAR 2017. 2016 Status Report on the OSPAR Network of Marine Protected Areas.
    Biodiversity Series 693/2017.; WWF 2015. An assessment of the network of marine protected areas in the Celtic Seas. 30pp.; HELCOM 2016. Ecological coherence
    assessment of the Marine Protected Area network in the Baltic. Baltic Sea Environmental Proceedings No. 148.; Agnesi et al. 2017. Spatial Analysis of Marine
    Protected Area Networks in Europe’s Seas II, ed. Kunitzer, A. ETC/ICM Technical Report 4/2017, 41pp.

1 | Protecting Our Ocean: Technical Annex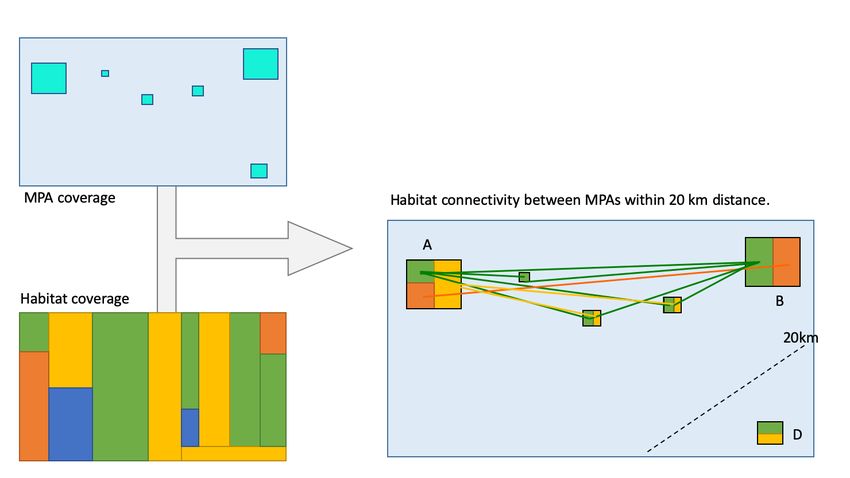
CONTENTS

1. DEFINITION OF ASSESSMENT AREA AND DATA SOURCES                 3

     1.1. Assessment area                                         3

     1.2. Data sources for assessing MPAs                         4

2. MPA DEVELOPMENT                                                7

     2.1 Designated MPAs                                          7
     2.2. MPAs with a management plan                             7

     2.3. Effectively managed MPAs                                9

     2.4. Results of assessing MPA development                    9

3. ECOLOGICAL COHERENCE OF MPA NETWORKS IN THE EU                11

     3.1. Data sources for the ecological coherence assessment   12

     3.2. Methodology for the ecological coherence assessment    13

     3.3. Results of the ecological coherence assessment         14

2 | Protecting Our Ocean: Technical Annex
1. DEFINITION OF ASSESSMENT AREA AND DATA SOURCES
Written by ETC-UMA
1.1. ASSESSMENT AREA
In assessing progress of marine protection in the EU, this study examined designation, management plan
development and ecological coherence of the European Marine Protected Areas (MPA) network. The assessment
area was defined as the marine and coastal waters of the 23 marine Member States of the European Union
(Belgium, Bulgaria, Croatia, Cyprus, Denmark, Estonia, Finland, France, Germany, Greece, Ireland, Italy, Latvia,
Lithuania, Malta, the Netherlands, Poland, Portugal, Romania, Slovenia, Spain, Sweden and the United Kingdom).
The assessment area covers the coastal zone, territorial waters (TW) up to 12 nautical miles and the Exclusive
Economic Zone (EEZ) up to 200 nautical miles from the European continent. However, for Greece the assessment
only covered the Greek territorial sea (i.e. from the coastline out to 6 nautical miles), as neither Greece nor Turkey
has declared an EEZ in the Mediterranean Sea.2 Overseas territories outside the European continental shelf were
not included in this assessment, as the assessment focuses on the protection of the European marine environment.
Delineation of the assessment was based on the spatial layers of marine boundaries available from World EEZ
v10, World 12 nautical miles zone and World Internal Waters (Figure 1 and Table 1).3 Finally, the European
Environment Agency coastline layer was used as reference to delimitate the terrestrial extent of the assessment
area.
The assessments were carried out per country and per regional sea. The country assessments were based on the
internal and territorial waters (TW) and Exclusive Economic Zone (EEZ) of each country. The regional seas were
separated by the following boundaries:
• Baltic Sea and North East Atlantic: The southern limit of the Kattegat was defined as the boundary
between the Baltic Sea and the North East Atlantic, including the Kattegat as part of the North East
Atlantic. 4
• North East Atlantic and Mediterranean Sea: The Strait of Gibraltar was considered as the
boundary between the North East Atlantic and the Mediterranean Sea.
• Mediterranean Sea and Black Sea: The Bosporus Strait was considered as the boundary between the
Mediterranean Sea and the Black Sea.
2 The assessment area follows that used in MPA assessments carried out by the European Environment Agency, for example Agnesi et al. 2017. Spatial Analysis of
Marine Protected Area Networks in Europe’s Seas II, ed. Kunitzer, A. ETC/ICM Technical Report 4/2017, 41pp.
3 Claus et al. 2019. Flanders Marine Institute. Marine Regions accessed at http://www.marineregions.org on 2019-02-11
4 This follows the regional sea division outlined in the Marine Strategy Framework Directive. Note that this differs from the division used by the Regional Sea
Conventions, as both HELCOM and OSPAR include the MPAs in the Kattegat in their respective regional seas.
3 | Protecting Our Ocean: Technical AnnexMPA Assessment Area
0 500 Km
Source: ETC-UMA, 2019
MPA Assessment Area - Inshore Origin of data:
Land and country boundaries. Eurostat, 2018
MPA Assessment Area - Offshore Maritime Boundaries and Exclusive Economic Zones (200NM). Flanders Marine Institute, 2018.
Figure 1. The assessment area.
1.2. DATA SOURCES FOR ASSESSING MPAs
To calculate the total protected area in the EU waters of the four regional seas, the MPA assessment considered the
maximum spatial extent of MPAs using data available from the Natura 2000 map viewer and Standard Data Form,
the CDDA database and the spatial databases of regional conventions of HELCOM, OSPAR and the Barcelona
Convention. The Black Sea Convention does not provide a specific spatial MPA database (Table 1). Possible MPA
designations include 1) Special Areas of Conservation (SACs); 2) Sites of Community Importance (SCIs); 3) Special
Protection Areas (SPAs); 4) Ramsar sites; 5) Biosphere Reserves; 6) in the Mediterranean Special Protection Areas
of Mediterranean Importance (SPAMIs); 7) Nationally designated MPAs or PAs with some marine area; 8) OSPAR
sites; and 9) HELCOM sites. No national databases were included in this assessment, due to scattered availability
and widely variable data formats and language.
The MPA surface area for this assessment was defined as all protected areas included in the regional MPA
networks and those Natura 2000 sites or national designated areas (CDDA) which, not being included in regional
networks, have a marine coverage. Following this approach only the marine parts of MPAs were included
within the spatial assessment. Marine parts were defined according to the EEA Coastline Layer for use for this
assessment (Figure 2).
4 | Protecting Our Ocean: Technical AnnexReporting on the Natura 2000 sites is mandatory under EU law, and the information on Natura 2000 sites is
collectively updated each December at the same time as the CDDA database. Reporting to the databases of the
regional sea conventions is agreed on through recommendations produced together with the Member States of the
regional sea conventions.
CDDA database
Part of regional network? Part of regional network?
No Yes Yes No
Marine part of rest of N2K Marine part of rest of
site CDDA site
Marine Marine
% %
EU23 MPA
database
Link additional Regional
Link additional
WDPA PA information management Convention
information databases
Figure 2. Decision tree used to build the EU 23 MPA database.
Due to differences in spatial data geometry (scale and level of detail), small artefacts were automatically generated
that contained a very low percentage of marine area. These elements were negligible in terms of total surface
as they represented less than 0.05% of the total area of MPAs derived from the assessment. In order to reduce
potential confounding or cascading errors, artefacts smaller than 0.5km2 in size or covered by less than 1%
of marine surface were excluded from the assessment. In addition, information reported by the Natura 2000
database was used to identify those Natura 2000 sites and CDDA fragments that truly correspond to protected
areas where marine habitats or species occur.5 With these data it was possible to eliminate larger polygons that do
not actually correspond to marine areas.
5 For a list of habitats and species taken into account, please see Annex 2 in EEA 2015. Spatial analysis of marine protected area networks in Europe’s seas. EEA
Technical Report 17/2015, 66pp.
5 | Protecting Our Ocean: Technical AnnexTable 1. Data sources used in this assessment.
Dataset Format Reference Spatial Source Data Url (Metadata)
Date Coverage
World Internal Waters v2, Shapefile 2018 Global VLIZ http://www.marineregions.org/downloads.php (http://www.marineregions.org/eezmethodology.php)
World 12 Nautical Miles
Zone v2, World EEZ v10
World Database on File Geodatabase 2018 Global UN Environment https://www.protectedplanet.net/
Protected Areas WCMC (https://protectedplanet.net/c/wdpa-manual)
Natura 2000 vector Shapefile 12/2017 EU28 EEA https://www.eea.europa.eu/data-and-maps/data/natura-9
(https://sdi.eea.europa.eu/catalogue/srv/eng/catalog.search;jsessionid=8D099E3CA1153D9250F1750691784
3E3#/metadata/1930b66c-18a1-4de8-834d-55bccf533646)
Natura 2000 database MSAccess 12/2017 EU28 EEA https://www.eea.europa.eu/data-and-maps/data/natura-9
database (https://www.eea.europa.eu/data-and-maps/data/natura-9#tab-metadata)
CDDA database MSAccess 12/2017 EU28 EEA https://www.eea.europa.eu/data-and-maps/data/nationally-designated-areas-national-cdda-12#tab-european-
database data (https://www.eea.europa.eu/data-and-maps/data/nationally-designated-areas-national-cdda-12#tab-
metadata)
CDDA vector Shapefile 12/2017 EU28 EEA https://www.eea.europa.eu/data-and-maps/data/nationally-designated-areas-national-cdda-12#tab-european-
data (https://sdi.eea.europa.eu/catalogue/srv/eng/catalog.search;jsessionid=8D099E3CA1153D9250F17506917
843E3#/metadata/c6d98fda-796e-40c0-b953-d716a8db1df5)
HELCOM vector Shapefile 02/2018 HELCOM MS HELCOM http://mpas.helcom.fi/apex/f?p=103:1::::::(http://metadata.helcom.fi/geonetwork/srv/eng/catalog.search#/
metadata/d27df8c0-de86-4d13-a06d-35a8f50b16fa)
OSPAR vector Shapefile 2018 OSPAR MS OSPAR https://odims.ospar.org/layers/geonode: Marine_protected_area__OSPAR____Global_view__polygon_
(https://odims.ospar.org/geoportal/rest/document?id=%7BBAD14881-6F03-43F9-BF7E-6CC8253F8C1A%7D)
MAPAMED Shapefile 04/2017 Barcelona MedPAN / SPA- http://medpan.org/main_activities/mapamed/
Convention RAC
MS
EUSEAMAP Raster / Shapefile 2018 Global EMODnet https://www.emodnet-seabedhabitats.eu/
http://gis.ices.dk/geonetwork/srv/eng/catalog.search#/metadata/02a444c8-bd2d-4e15-8e69-806059103760
6 | Protecting our ocean2. MPA DEVELOPMENT
Written by ETC-UMA
The EU MPA assessment distinguishes between three classes of MPA development: 1) Designated MPAs, 2) MPAs
with a management plan and 3) Effectively managed MPAs (Table 2).
Table 2. Terminology of MPA development used in this assessment (by WWF).
Designated MPAs refers to all areas that have been designated for marine
protection. This is the starting point for marine protection.
MPAs with a management plan are areas that have been designated for marine protection and
are reported to have an implemented or officially endorsed
management plan. This is the first step on the way for an
MPA to be developed to protect the marine environment.
Effectively managed MPAs are areas that have been designated, have an implemented
management plan and are carrying out actions for
conservation and/or active nature restoration that results in
actual protection.
2.1 DESIGNATED MPAS
The area designated as an MPA was defined in terms of total MPA coverage in km2 and percentage of marine
area by country, regional sea, and for all European EU waters (chapter 1.2). The percentage of no-take area in
designated MPAs was not calculated as the information was not uniformly available across all MPAs. The World
Database on Protected Areas includes information regarding no-take areas only in some Italian MPAs, but overall,
information regarding no-take areas is lacking or inconsistent across publicly available databases on regional or
EU level.
2.2. MPAS WITH A MANAGEMENT PLAN
Information on the management plan status is reported only in three of the five databases used for this report
(HELCOM MPA database, OSPAR MPA database and the Natura 2000 Standard Data Form). Neither the CDDA
nor the MAPAMED databases include information about management plans, however, they account for only 5%
of the total MPA coverage in the EU marine area, while the three aforementioned databases reporting on MPA
management together account for 95% of the total MPA coverage. The data for the assessment of management
plans comes from the tabular databases that are linked to the spatial MPA database by the MPA code (Natura
2000 sitecode, HELCOM and OSPAR ID).
7 | Protecting Our Ocean: Technical AnnexThe reporting to the HELCOM and OSPAR MPA databases distinguishes between different phases of management
plans (under preparation, finalised but not implemented and implemented/officially endorsed) while the Natura
2000 database only reports information on the existence of management plans, without clarifying the status
of implementation. For the purpose of this assessment information from HELCOM and OSPAR MPA databases
overrode the information from the Natura 2000 database, and information from the Natura 2000 Standard
Data Form was only used for MPAs not reported to these two regional seas databases (in practice all MPAs in the
Mediterranean Sea and Black Sea, and some MPAs in the Baltic Sea and the Northeast Atlantic).
In MPAs where the HELCOM or OSPAR databases indicated partial implementation of the management plan, and
spatial identification of those parts was possible based on the Natura 2000 or CDDA database, the parts reported
to have a management plan were considered managed in this assessment. If this identification was not possible,
the whole MPA was considered not managed.
The OSPAR MPA database6 reports MPA management plan information for the North-East Atlantic with the
following attributes (answering the question “Are the measures to achieve the conservation objectives being
implemented?”):
• ‘Yes’ = The MPA has an implemented/officially endorsed management plan.
• ‘Partial’ = Only some parts of the MPA has an implemented management plan. In the assessment these
MPAs were considered not to have an implemented management unless the part of the MPA with the
management plan (e.g. nature reserve or national park identified via CDDA database) could be spatially
identified.
• ‘No’ = The MPA has no management plan in place.
• ‘No response’ = No response reported in the database, defined as no management plan for this
assessment.
• ‘Unknown’ = Defined as no management plan for this assessment.
The HELCOM MPA database7 reports MPA management information in the field labelled ‘Status’ in the overview
table, with the following attributes:
• ‘Designated and managed’ = The MPA has an implemented/officially endorsed management plan.
• ‘Designated and partly managed’ = Only some parts of the MPA has an implemented management plan.
In the assessment these MPAs were considered not to have an implemented management unless the part
of the MPA with the management plan (e.g. nature reserve or national park identified via CDDA database)
could be spatially identified.
• ‘Designated’ = The MPA has no management plan in place.
The Natura 2000 database8 is based on the Standard Data Form which includes a section on Site Management
(section 6) and specifically requires information on the Management Plan (Field 6.2 of the Standard Data Form).9
This information is available in the field “Management Status” that was used to calculate the proportion of MPA
area with management plan in force, using the following attributes:
• ‘Y’ = Management plan exists for the MPA.
• ‘P’ = Management plan is in preparation for the MPA, defined as no management plan for this assessment.
• ‘N’ = Management plan does not exist for the MPA.
• ‘No value’ = no management plan information reported in the database, defined as no management plan
for this assessment.
6 http://mpa.ospar.org/home_ospar/mpa_datasheets
7 http://mpas.helcom.fi/apex/f?p=103:1
8 https://www.eea.europa.eu/data-and-maps/data/natura-9#tab-european-data
9 https://eur-lex.europa.eu/legal-content/EN/TXT/PDF/?uri=CELEX:32011D0484&from=EN
8 | Protecting Our Ocean: Technical AnnexThe results of the MPA management plan assessment describes the official endorsement of MPA management
plans in the Baltic Sea and the North-East Atlantic, whereas for the Mediterranean and the Black Sea MPAs only
the existence of a management plan is described. This is a result of the different reporting formats in the MPA
databases available in Europe. Due to artefacts created in the assessment especially around small coastal areas
management of less than 0.5% of a country’s marine area was rounded down to 0% management.
2.3. EFFECTIVELY MANAGED MPAS
The spatial coverage of effectively managed MPAs could not be assessed, as information on these is not available
in the public databases for all 23 marine EU Member States. Effective management of an MPA requires that the
management plan is fully implemented, and that actions for conservation and/or active nature restoration that
result in actual protection are carried out. This level of information is scarcely available throughout Europe, and
no such data is reported in the publicly available databases used in this assessment.10 Therefore information on
MPA management plans (chapter 2.2) was used as a proxy for MPA progress, as it reflects the first step of an area
designated as an MPA to develop into an area providing effective protection to the marine environment.
2.4. RESULTS OF ASSESSING MPA DEVELOPMENT Written by WWF
In all regional seas individually, as well as in the entire EU marine area, over 10% of the seas have been designated
for marine protection. However, when looking at the management plan development, the results are significantly
lower. In the Mediterranean Sea, the Black Sea and the North-east Atlantic there are MPA management plans for
less than 2% of the entire sea basin, while in the Baltic Sea the corresponding number is 6.4%. For all EU seas
combined, the result is very low; only 1.8% of the entire marine area is covered by MPAs with a management plan.
This assessment shows that 19 of 23 marine EU Member States are falling short from having MPA management
plans for 10% of their marine area, and 11 Member States have not developed and reported any management plans
for their marine areas. Only four Member States have MPA management plans for over 10% of their marine area,
however, it should be noted that this assessment does not reveal the content of efficiency of those management
plans.
Due to different national definitions on what constitutes as an MPA, as well as shapefile specific differences used
in the national calculations, the coverage of designated MPAs may deviate slightly from national reporting. The
calculation used in this assessment was created for a pan-European MPA assessment, with the primary objective
of comparing EU Member States with each other through a unified assessment (chapter 1). For exact national
results, please consult the relevant national WWF office or national authorities.
For further discussion on the results, please refer to the main report (pages 14-19 and 28-29).
Table 3. The coverage of MPAs with a management plan is still well below 10% in all regional seas, and only 1.8% for the entire EU marine area. Coverage of
designated MPAs varies from 11.7 and 16.4% in between the regional seas.
Designated MPAs MPAs with management plan
(coverage of marine areas) (coverage of marine areas)
EU marine area 12.4% 1.8%
Baltic Sea 16.4% 6.4%
NE Atlantic Ocean 11.7% 1.7%
Mediterranean Sea 13.5% 0.8%
Black Sea 14.0% 0.1%
10 For the Dutch marine area this information was available and is presented on page 17 of the main report.
9 | Protecting Our Ocean: Technical AnnexMPAs with and without management plans in the EU
10% 20% 30% 40% 50% 60% 70% 80% 90% 100%
MPAs with management plans (% of total national marine area) MPAs without management plans (% of total national marine area)
Figure 3. Almost half of all marine EU Member States have not developed and reported any management plans for their MPAs, and only four Member States have
management plans for more than 10% of their marine area.
10 | Protecting Our Ocean: Technical Annex3. ECOLOGICAL COHERENCE OF MPA NETWORKS IN THE EU
Written by ETC-UMA
Ecological coherence of the MPA networks was assessed per each regional sea and calculated based on the three
criteria of representativity, replication and connectivity, using modelled spatial habitat data (chapter 3.1). The
three criteria must be met at the same time and were defined as:
1. Representativity, which ensures that the MPA network protects the typical and unique nature in each
sea basin, meaning that all habitats found in the sea basin must also be represented within the MPA
network. To be representable the MPA network should include different biogeographical zones and depth
zones of the marine environment, and should reflect the full range of habitats, including all organizational
levels of biodiversity. This assessment examined the proportional coverage of habitats within the MPA
network. The target for the representativity assessment was that at least 30% of each habitat
type found in the regional sea must be represented within the MPA network, based on
scientific advice and aligned with IUCN’s Global Conservation Standards for Marine
Protected Areas.11, 12
2. Replication, which acts as the insurance of the network, ensures that there are several copies of the
natural habitats in the MPA network, and that these copies are not clustered together in only one MPA.
This assessment examined the number of times a habitat was replicated in different MPAs within the
regional seas’ MPA network. Higher replication of habitats in the network generally signifies a network
that is robust to risks and impacts (both natural and anthropogenic). The target of this replication
assessment was that each habitat would occur at least four times within the MPA network
of the regional sea, based on previous large scale assessments.13, 14
3. Connectivity, which acts as the glue of the MPA network, ensures that the individual MPAs of the
network are close enough to each other to allow for species and their larvae to move between MPAs
hosting their required habitat type. This allows for persistence of ecological communities and populations
by enabling species or their larvae to seek refuge within the MPA network if needed. By ensuring
connectivity of all habitats in a sea basin the MPA network supports the survival of all species present,
including species whose different life stages depend on different habitats. Connectivity assessments are
scale dependent, and need to be adjusted for the scale of each individual dataset; assessments carried out
at a smaller geographical scale than this one traditionally include more detailed data on for example sea
currents required for connectivity analyses. Unfortunately this data is not available for an assessment
at sea basin level, and therefore an assessment of proximity was used as a proxy for connectivity, as has
been done in previous large scale assessments.12,13 A 20 km distance was used as the maximum limit for
dispersal.15 The Connectivity assessment examined the number of connections between
the same habitat in different MPAs within the regional sea MPA network (distance of
a connection 0.5 km2). The target of this connectivity
assessment was that 80% of all habitats should have at least 20 or more connections each
(further developed from assessments carried out by the HELCOM regional sea convention and the
European Environment Agency). 12, 13
Previous local and regional assessments of ecological coherence have also included additional criteria such as
adequacy, resilience, viability and management. The definitions of these additional criteria are not as fixed as
for the three main criteria, as they partly overlap and vary between assessments. Therefore this pan-European
assessment focuses on the three main criteria.12, 13, 16
11 I UCN WCPA 2018. Applying IUCN’s Global Conservation Standards to Marine Protected Areas (MPA) https://www.iucn.org/sites/dev/files/content/documents/
applying_mpa_global_standards_final_version_050418.pdf
12 Sala et al. 2018. Assessing real progress towards effective ocean protection. Marine Policy 91: 11-13.
13 HELCOM 2016. Ecological coherence assessment of the Marine Protected Area network in the Baltic. Balt. Sea Environ. Proc. No. 148
14 Agnesi et al. 2017. Assessing Europe’s Marine Protected Area networks - Proposed methodologies and scenarios, ed. Kunitzer, A. ETC/ICM Technical Report 2/2017,
72pp.
15 Shanks et al. 2003. Propagule dispersal distance and the size and spacing of marine reserves. Ecological Applications 13 (Supplement): 159–169.; Abdulla et al.
2008. Status of Marine Protected Areas in the Mediterranean Sea. IUCN, Malaga and WWF, France, pp. 152.; Shanks 2009. Pelagic Larval Duration and Dispersal
Distance Revisited. Biol Bull. 216(3): 373-85.; Rodríguez-Rodríguez 2016. Marine protected area design patterns in the Mediterranean Sea: Implications for
conservation. Marine pollution Bulletin 110 (1), 335-342.
16 Rees et al. 2015. Assessment of the Ecological Coherence of the MPA Network in the Celtic Seas: A report for WWF-UK by the Marine Institute, Plymouth University
and The Marine Biological Association of the United Kingdom. pp 165.
11 | Protecting Our Ocean: Technical Annex3.1. DATA SOURCES FOR THE ECOLOGICAL COHERENCE ASSESSMENT
The ecological coherence assessment is based on the EMODnet Seabed Habitat layers (EUSeaMap)17 as this
represents the most complete and harmonised coverage of the distribution of marine benthic habitats for the
EU marine area. It includes 90 EUNIS habitat classes and types of benthic seabed habitats. For this assessment,
these were aggregated to 33 habitat super classes (Table 3) based on their ecological community and function,
bathymetry, substrate type and biogeography (regional sea). It should be noted that EMODnet data are based on
both observed and modelled data. Although rigorous and standardized, there are some areas that present a higher
level of uncertainty over others given the lack of field data and extrapolations generated through habitat models.
The detailed MPA layer (chapter 1.2) was post-processed to obtain both homogenous MPA patches and separate
MPA polygons that make up multipolygons. A distinction was made between single MPAs, but the original MPA
layer was also modified in cases where MPA patches (single spatial features) from one source (e.g. OSPAR) were
attached to a neighbouring MPA patch from another source (e.g. CDDA), considering them as one MPA patch for
this spatial assessment. This was considered reasonable since ecological coherence is assessed by comparing
representativity, replicates and connections of protected polygons, not administrative units.
Habitat super classes
A. Abyssal soft and mixed substrate A. Infralittoral coarse substrate BA. Baltic Circalittoral hard substrate
A. Deep-sea bed A. Infralittoral soft and mixed substrate BA. Baltic Infralittoral hard substrate
A. Deep-sea hard substrate A. Thenea muricata BS. Black Sea Bathyal soft and mixed
substrate
A. Deep-sea soft and mixed substrate A. Cymodocea beds BS. Black Sea Deep Circalittoral soft
and mixed substrate
A. Deep Circalittoral hard substrate AM. Atlantic and Mediterranean BS. Black Sea Circalittoral hard substrate
Circalittoral hard substrate
A. Deep Circalittoral coarse substrate AM. Atlantic and Mediterranean BS. Black Sea Infralittoral hard substrate
Infralittoral hard substrate
A. Deep Circalittoral soft and mixed M. Mediterranean Bathyal soft and BS. Black Sea Infralittoral coarse substrate
substrate mixed substrate
A. Circalittoral hard substrate M. Mediterranean biocoenosis BS. Black Sea Infralittoral soft and mixed
substrate
A. Circalittoral coarse substrate M. Mediterranean Coralligenous BS. Black Sea Shallow circalittoral seabed
A. Circalittoral soft and mixed substrate M. Mediterranean Shelf edge BS. Black Sea Shallow circalittoral soft
and mixed substrate
A. Infralittoral hard substrate M. Posidonia habitat
Table 4. The 33 habitat super classes used in the assessments of representativity, replication and connectivity (derived from 90 EUNIS habitats).
17 EUSeaMap: http://www.emodnet.eu/seabed-habitats and http://gis.ices.dk/geonetwork/srv/eng/catalog.search#/metadata/02a444c8-bd2d-4e15-8e69-806059103760
12 | Protecting Our Ocean: Technical Annex3.2. METHODOLOGY FOR THE ECOLOGICAL COHERENCE ASSESSMENT
The assessment of representativity and replication of marine biodiversity was carried out by overlapping
surface layers of MPAs with the habitat super class layer described in chapter 3.1 (Figure 3). Using the resulting
GIS information, the number of habitat super classes and their total surface was calculated at the regional
level, and compared against the corresponding numbers within the regional sea MPA network. Based on this
assessment, the value for representativity (habitat coverage) and replication (habitat patch number) were obtained.
In both assessments only MPA patches higher or equal to 0.5 km2 were used. The representativity results were
presented as the habitats of which at least 30% of the total habitat surface was included in the MPA network. The
replication results were presented as the number of habitat super classes which occurred at least four or more
times within the different MPAs of the MPA network.18
Figure 4
Base GIS layer for assessments of representativeness, replication
and connectivity
MPA coverage
Habitat coverage
Figure 4. Schematic illustration of the GIS data overlay.
Proximity of the already mentioned habitat super class patches in different MPAs was used as a proxy for
connectivity. The assessment, which was developed from the connectivity assessment carried out by the
HELCOM regional sea convention,13 was done with the following boundary conditions:
- The centroid of each habitat patch was used for the distance calculation, thus requiring the longest
possible distance between two MPAs19
- 20 km dispersal distance was used as the cut-off value15
- Processing was done on the regional sea level calculating the distance from one patch of habitat type A to
all other patches of habitat type A in the regional sea MPA network (with cut-off at 20 km) (Figure 4).
18 HELCOM 2010. Towards an ecologically coherent network of well-managed Marine Protected Areas – Implementation report on the status and ecological coherence
of the HELCOM BSPA network. Baltic Sea Environmental Proceedings No. 124B.; HELCOM 2016. Ecological coherence assessment of the Marine Protected
Area network in the Baltic. Baltic Sea Environmental Proceedings No. 148.; Agnesi et al. 2017. Assessing Europe’s Marine Protected Area networks - Proposed
methodologies and scenarios, ed. Kunitzer, A. ETC/ICM Technical Report 2/2017, 72pp.
19 Foster et al. 2014. Assessing the Ecological Coherence of the Channel MPA Network. Report prepared by the Marine Institute for the Protected Area Network Across
the Channel Ecosystem (PANACHE) project. INTERREG programme France (Channel) England funded project, 156pp.
13 | Protecting Our Ocean: Technical AnnexFigure 5. Schematic illustration of the connectivity assessment.
Following this approach, MPAs lacking the habitat super class in question were ignored. The total number of
habitats with 20 or more connections was divided by the total number of habitats present in the regional sea area
to get the proportion of habitat super classes that are connected to each other in the regional sea MPA network.
The connectivity result was presented as the percentage of habitat super classes which had at least 20 connections
within a 20 km distance in the regional sea MPA network.
3.3. RESULTS OF THE ECOLOGICAL COHERENCE ASSESSMENT Written by WWF
Ecological coherence is measured against strict cut off lines, where each criterion must be met with 100% success
and all three criteria must be achieved simultaneously. The results of the representativity, replication and
connectivity assessments show that no MPA network in the regional seas fulfil all of the goals set for these three
criteria (Table 4). Representativity scores are low or very low in all regional seas, while replication scores are
slightly better; the North-east Atlantic MPA network already shows high enough replication, while the Baltic Sea
and the Mediterranean Sea networks are 12-17% away from the required levels of replication. Connectivity of the
MPA network is very low in the Mediterranean Sea, and still 38-38% away from the required levels in the Baltic
Sea and the North-east Atlantic.
For further discussion on the results, please refer to the main report (pages 22-25 and 28-29).
Ecological
Regional Sea coherence
(number of habitats) Representativity Replication Connectivity reached?
Baltic Sea (8) 25% 88% 63% No
NE Atlantic (13) 54% 100% 62% No
Mediterranean Sea (18) 33% 83% 17% No
Table 5. The results of the calculations for the assessments of representativity, replication and connectivity, which together determine that the regional sea MPA
networks do not display ecological coherence. Each criterion must be met with 100% success and all three criteria must be achieved simultaneously for the
network to be ecologically coherent. Green = criterion is met (scores 100%); orange = criterion is not met but shows progress (scores over 60 %); red = criterion is
not met and is very far away from being fulfilled (scores less than 60%).
14 | Protecting Our Ocean: Technical Annex100%
RECYCLED
100%
• PROTECTING OUR OCEAN: EUROPE’S CHALLENGES TO MEET THE 2020 DEADLINES
RECYCLED
The data collection and analyses for this assessment, as well as
writing the first draft of this Technical Annex, were carried out by
the European Topic Centre at the University of Malaga (ETC-UMA).
Why we are here
no URL To stop the degradation of the planet’s natural environment and
to build a future in which humans live in harmony and nature.
Why we are here
L To stop the degradation of the planet’s natural environment and
to build a future in which humans live in harmony and nature.
Why we are here
To stop the degradation of the planet’s natural environment and
Regular to build a future in which humans live in harmony with nature.
EU
wwf.eu
Why we are here
To stop the degradation of the planet’s natural environment and
ular to build a future in which humans live in harmony with nature.
wwf.eu
© 1986 Panda symbol WWF – World Wide Fund For Nature (Formerly World Wildlife Fund)
WWF.EU
® “WWF” is a WWF Registered Trademark.
WWF European Policy Office, 123 rue du Commerce, 1000 Brussels, Belgium
For contact details and further information, please visit our website at www.wwf.eu
© 1986 Panda symbol WWF – World Wide Fund For Nature (Formerly World Wildlife Fund)
® “WWF” is a WWF Registered Trademark.
WWF European Policy Office, 123 rue du Commerce, 1000 Brussels, Belgium
For contact details and further information, please visit our website at www.wwf.euYou can also read