40 YEARS OF CHANGE. RECENT EVOLUTION OF THE PORT STEPHENS FLOOD TIDE DELTA
←
→
Page content transcription
If your browser does not render page correctly, please read the page content below
40 YEARS OF CHANGE. RECENT EVOLUTION OF THE PORT
                STEPHENS FLOOD TIDE DELTA

D Wainwright1,2, D Lord,3, B Crawley1
1
 Whitehead & Associates, Cardiff, NSW
2
 University of Queensland, School of Civil Engineering
3
 Coastal Environment, Newcastle, NSW

Abstract

Bathymetry within the eastern parts of Port Stephens is dominated by an extensive flood
tide delta, stretching from the ocean entrance, westward to Corlette and Corrie Island.
The delta is changing and the slow but incessant variation in the form of the Port presents
a series of ongoing and fluid challenges relating to managing the foreshore both to the
north and south of the waterway.

This paper presents a comparison between two historical bathymetric surveys, from 1969
and 2007. Change over the entire flood tide delta has been estimated along with
comparisons within more localised, but important locations. The methods used have
required consideration of the likely accuracy and resolution of the available data. Our
comparison reveals a number of both broad scale and more localised trends of evolution
that have relevance to managing locations around the foreshore.

The paper discusses the evolutionary mechanisms with particular reference to the findings
of previous research. Recent management actions, the mechanisms leading to the
management challenges and a discussion of potential medium term future issues arising
from the ongoing evolution are discussed within the paper.

Background

Based on recent study experience within the Eastern Basin of Port Stephens, we were
interested in examining the broad scale historical morphological changes, through the
comparison of comprehensive hydrosurveys from 1969 and 2007. We are unaware of
such a comparison being undertaken to date. In addition, more localised analyses were
also undertaken, within areas where the overall comparison revealed interesting trends.

The work is of interest as there are a number of foreshore locations adjoining this delta
where the movement of sand is causing ongoing problems through foreshore erosion or
the undesirable shoaling of areas of importance for navigation and/or tidal exchange.
Management often involves the relocation of such sand, which can be an expensive and
thankless task. Natural processes tend to continue their quest to move sand from areas
where we would prefer it to stay, into areas where it causes problems for human activities.

                                                                                         1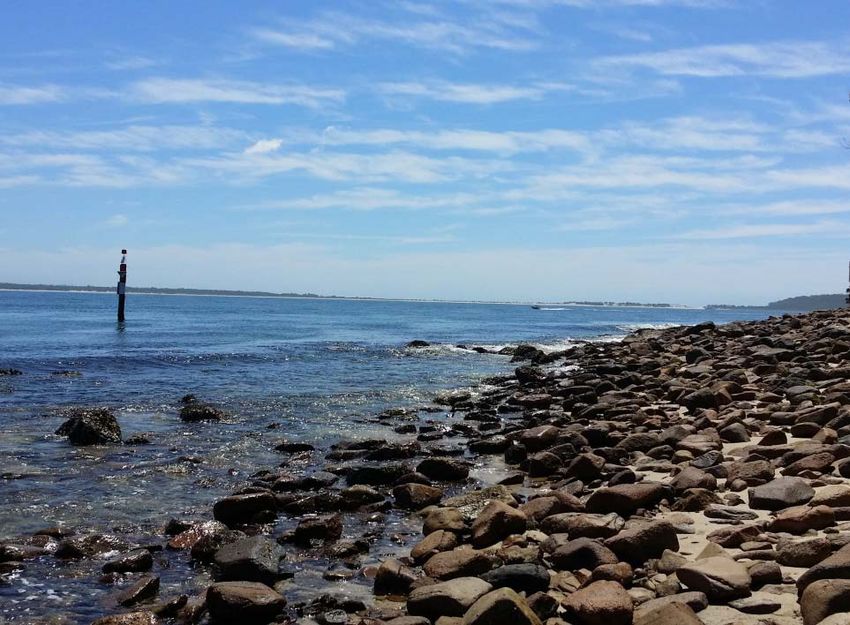
Study area

The flood tide delta of Port Stephens extends westward from the entrance of Port
Stephens with its leading edge descending into deeper water to the north of Corlette. The
flood tide delta is a Holocene feature which is classically understood to be moving
westwards into Port Stephens under the combined action of wind and waves (Thom et al.
1992). However, a closer look at bedforms and historical behaviour across the delta would
suggest a more spatially complex pattern of evolution (Frolich, 2007). The response of
foreshores adjoining the flood tide delta varies depending on local circumstances.

      Figure 1      Flood Tide Delta within the Eastern Basin of Port Stephens

Foreshore problem areas

Shoal Bay and Halifax Park

Problem areas historically studied by the authors include Shoal Bay, Corlette, Jimmys
Beach and Winda Woppa. Shoal Bay is the easternmost embayment on the southern side
of Port Stephens, located just to the west of Tomaree Head. Erosion along Shoal Bay has
been documented since the 1960’s (Lord et al., 1995). The beach here is known to be
                                                                                       2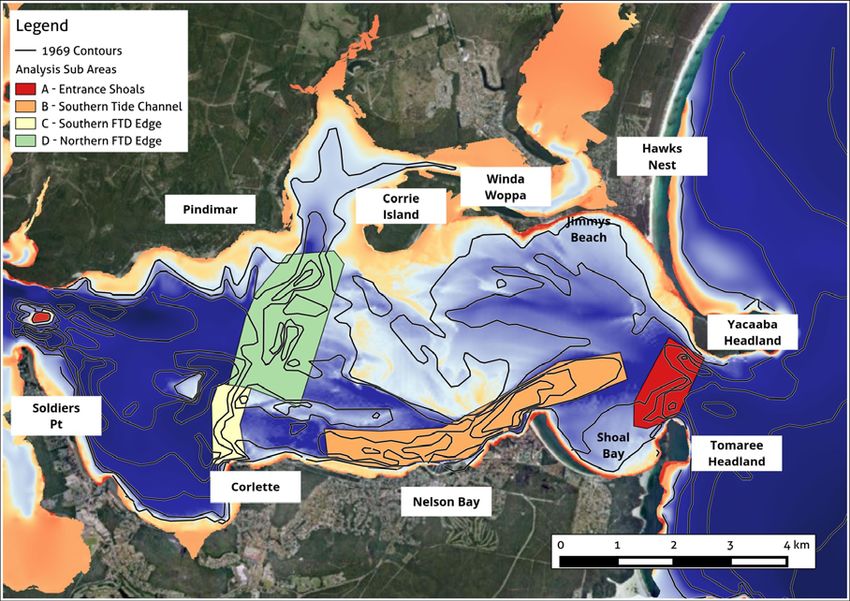
subject to westward sediment transport (Lord et al., 1995; Watson, 1997). That westward
transport acts to widen the beach at the western end of Shoal Bay, which is highly
reflective and aligned almost parallel to the crests of refracted ocean swell at this location.
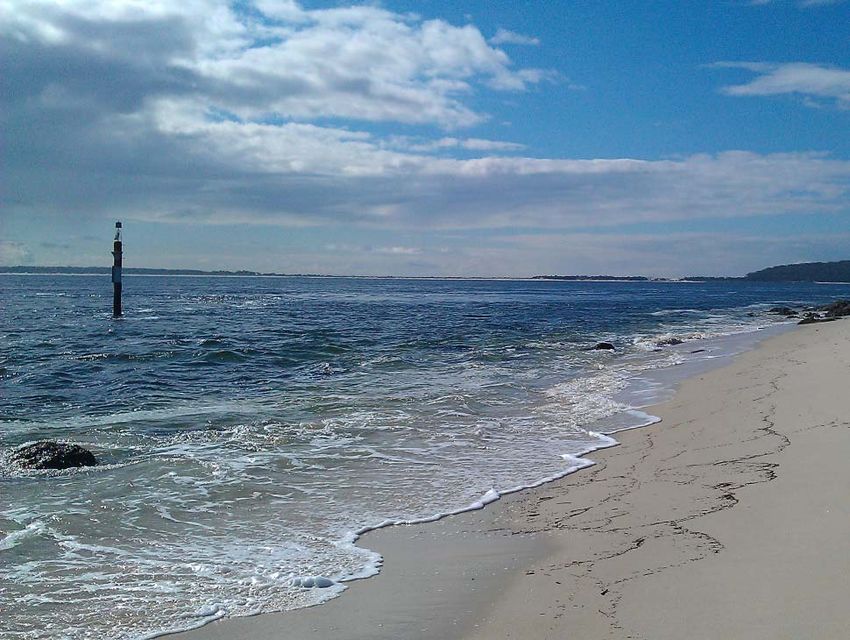
Intermittently, sand builds up to such an extent that westward bypassing occurs around
Nelson Head. Aerial photography shows that this occurred in the 1950’s and 1960’s and
subsequently in 2010/2011 causing the burial of highly valued sponge gardens at Halifax
Park (BMT WBM, 2011). Recently, the sand has largely cleared from the intertidal zone
and comparable photographs from July, 2011 and November 2015 are shown in Figure 2.
Jimmy’s Beach and Winda Woppa
Jimmy’s Beach has received much attention, given its status as a key NSW coastal
erosion “hot spot”. Residential development at the beach began some time around the
1960’s and, since that time, average recession in the order of 1m/year has been
experienced (Vila-Concejo et al., 2010; Watson, 2000). Studies by the Public Works
Department in the 1980’s and 1990’s pointed towards the eastward transport of eroded
sand at the shoreline. However, research work from the University of Sydney implied
alongshore transport towards the west along Jimmy’s Beach (Cholinski, 2004 referenced
in Vila-Concejo et al., 2007). A sand wave feature at the eastern extremity of the beach
has been studied in detail (Vila-Concejo et al., 2010, 2009, 2007) concluding that the
westerly transport was not that clear cut. The prevailing position at the present time
appears to be that, considering all driving processes, the dominant direction of sand
transport is eastwards from the area of most severe erosion, fronting The Boulevard,
Hawks Nest, where the net transport direction reverses, resulting in the formation of the
sand wave (Jiang et al., 2013). However the situation is complex and transport will be in
different directions at different times. Furthermore, in the vicinity of Barnes Rock, a few
hundred metres west of the most severely eroding location, it appears that the dominant
transport direction may switch towards Winda Woppa (i.e. westwards).
Thom et al (1992) provided a comparison of historical surveys since the 1860’s which
demonstrated the historical growth, (until around 1910), shortening and then final
destruction of a feature known as “Myall Point”. This feature was a substantial sand spit
extension of Winda Woppa, projecting towards the south west, but parallel and to the east
of Corrie Island. The Lower Myall River coursed between this spit and Corrie Island before
discharging into Port Stephens. Based on the accounts of community members, it is
understood that destruction occurred during a major storm in the late 1920’s (Thom et al,
1992). Aerial photography from the 1950’s onwards has shown that Winda Woppa spit,
the remaining root of Myall Point, has grown westwards over the past six decades,
pinching the channel of the lower Myall River against Corrie Island. Overall, some 750m
of extension to Winda Woppa spit has occurred since 1950, with ~300m of that occurring
between 1990 and 2010 (BMT WBM, 2011). The patterns of erosion and accretion to the
west of Barnes Rock indicate that a significant portion of the sand needed to extend the
spit has resulted from the recession of the shoreline to the immediate west of Barnes
Rock, although sand moving into the compartment from the east of Barnes Rock cannot
be ruled out.
At the time of writing, a dredging operation was underway to cut a channel across the end
of Winda Woppa Spit, with the spoil used to (i) nourish Jimmy’s Beach, (ii) nourish key
areas to the west of Barnes rock where recession is particularly pronounced at the present
time; and provide a stockpile for future nourishment operations. Photographs of this
operation are presented in Figure 3.
3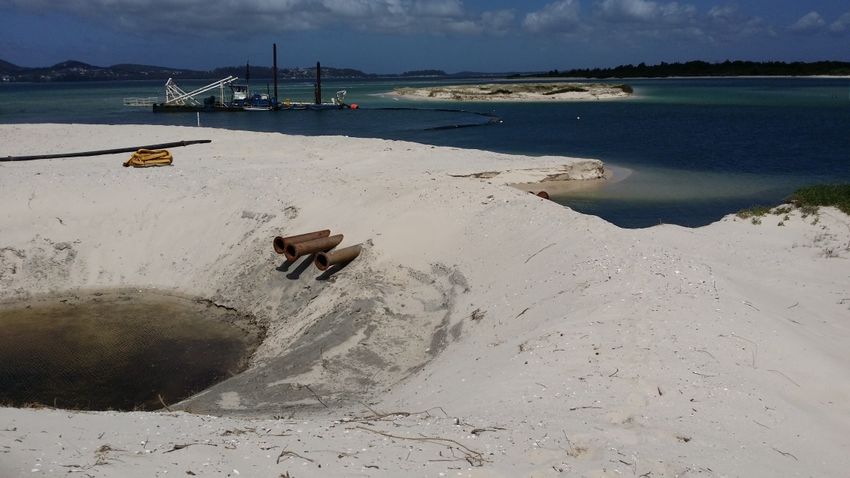
July, 2011

November, 2015

  Figure 2   Comparison of Foreshore at Halifax Park, 2011 and 2015
                                                                      4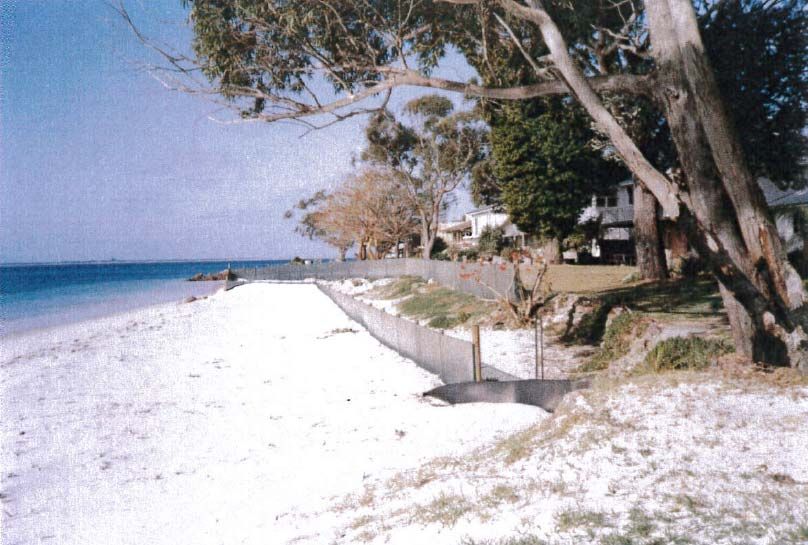
Figure 3     Recent (October, 2015) Dredging and Nourishment Operations at
        Winda Woppa (Top) and Jimmy’s Beach (Bottom) Respectively

                                                                             5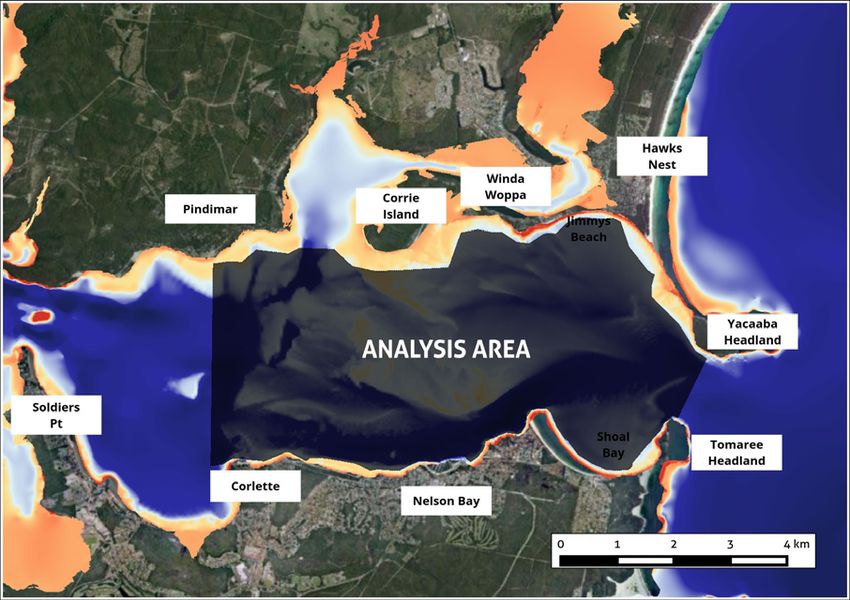
Corlette

Corlette Beach is located on the southern side of Port Stephens, near the eastern end of
the flood tide delta. The beach spans between Sandy Point and “The Anchorage” marina
at Corlette Head. The shoreline here is subject to net westward alongshore transport, and
there has been a progressive pattern of erosion and subsequent foreshore protection
around Sandy Point from east to west since the area was first settled in the post WWII
period (Whitehead & Associates, 2015). The marina was built in the early 1990’s. This
involved construction of a shore normal breakwater at the western end of Corlette Beach
which, as predicted by Geomarine (1991), has caused the western end of the Beach to
widen as sand accumulates adjacent to the breakwater. The western end has accreted,
while the eastern end of the beach has eroded over the past 20-25 years. In effect the
beach has rotated. The differences in character at the western end of the beach between
1992 and 2015 are illustrated in Figure 4. Although this location is well inside the
entrance, near the western extent of the flood tide delta, ongoing changes are still
problematic, and erosion at the foreshore of Conroy Park is an ongoing challenge.

Summary

It is of interest to understand how the ongoing, broad scale evolution of the delta may be
affecting change along the fringing foreshores. Such an understanding helps decision
makers assess the futility or long term implications of adopting foreshore management
strategies such as structural protection or beach nourishment.

Surveying, available plans and GIS processing

By comparing elevations in Geographical Information System (GIS) we can assess how
much different areas are accumulating or losing sand. However, the way in which different
data sets were collected needs to be considered to understand the errors that might arise
from the analysis.

For this paper, we have used hydrosurveys from 1969 and 2007. In 1969, hydro surveying
methods were much different to those applied today. Essentially, three coordinates are
required to capture an individual sounding. The horizontal (x & y) coordinates would have
been captured by locating the vessel using on-shore mechanical theodolite stations and
triangulation. Depths would typically have been recorded using echo sounder but
recorded to a paper trace with the point of horizontal fixes were marked manually on the
trace,. Key issues with these methods included (i) difficulty in accurately triangulating a
vessel location, which may be subject to drifting or pull by tidal currents and winds; (ii) no
compensation for boat movements; and (iii) variations in the tide level to which soundings
were reduced based on manual tide readings taken at intervals during the survey. In
comparison, more recent (i.e. 2007) hydrosurveys, use more accurate positioning (GPS),
and far more accurate depth measurements using an echo sounder with on board
adjustments made to compensate for boat movements. Due to the ease of data collection,
the density of survey points presently collected is much greater than that which could be
achieved historically.

                                                                                            6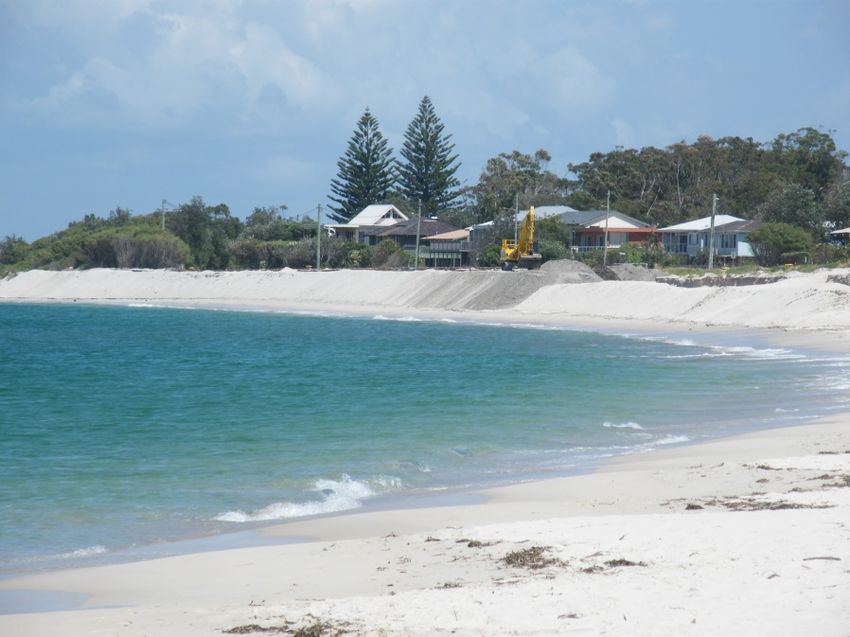
Figure 4       Changes in the Beach near the western end of Conroy Park, 1992
                              (Top) and 2015 (Bottom)

Beyond differences in the capture of data, post processing has also changed. In 1969,
reduction and mapping of the data would have been completed manually. More recently,
the entire process is handled digitally, with records captured on the vessel transferred
directly to mapping systems wherein the survey plans are prepared.

The issue of differing datums to which the surveys are reported is also noteworthy. For
the 2007 hydrosurvey, the survey has been reported to Australian Height Datum. The
1969 hydrosurvey was reduced to the low water mark on the Tomaree Tide Gauge. The
known elevation of zero on the Tomaree tide gauge was compared to information available
on the NSW SCIMS database, and it was determined that the existing level is at least
reasonably close to the zero point which would have existed in 1969.
                                                                                      7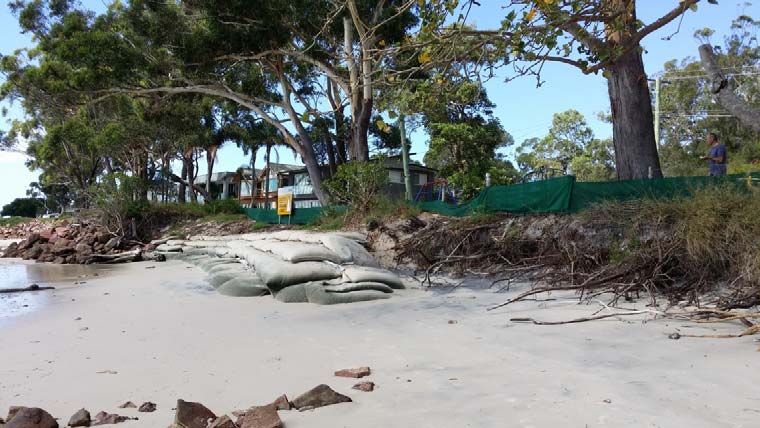
For the 2007 hydrosurvey, x, y, z triplets were available digitally, loaded into GIS and used
to generate a digital elevation model using a multi-level b-spline approximation algorithm.
Hydrosurvey lines were typically spaced at no more than 50m giving excellent coverage of
the Eastern Basin of Port Stephens. In comparison, the 1969 hydrosurvey was only
available as a scanned, low resolution plan, which needed to be georeferenced and
orthorectified within the GIS (scaled, rotated and stretched to match the shape of Port
Stephens, using known, fixed locations). Furthermore, the values of individual soundings
could not be determined reliably. For this reason, only the contours were digitised. It is not
considered reasonable to derive a digital elevation model from these contours as (i) there
are large shallow areas to the north of the basin which are not well covered by contours;
and (ii) generating a DEM from the contours (themselves a product of interpolation
between the original soundings) would result in smoothing of the actual surveyed surface,
taking our results further from the original surveyed data than the plotted contours. We
understand that the Office of Environment and Heritage has now located more detailed
sounding plans, which are being digitised for future analysis.

The analysis of GIS undertaken in this study has involved the comparison of areas
shallower and deeper than the contour elevations in the 1969 hydrosurvey. The way in
which these have changed over the four decades between surveys provides some insight
into ongoing evolution of the flood tide delta.

Analysis and results

While the 1969 plan contours were used in the analysis, contours were generated from the
DEM generated from the 2007 hydrosurvey, to match the elevations present on the 1969
plans. It is the areas encompassed by both sets of contours that have been used in the
analysis presented here.

A control area for analysis was established covering the flood tide delta, but limited to
areas that were below -1m AHD in both data sets and completely enclosed by the
contours present on the 1969 plan. The area adopted is shown on Figure 5

                                                                                            8
Figure 5 Analysis Extents
The contours were used to determine the depth distribution of the total area (~29.5 km2)
within this analysis polygon. The results are presented in Table 1.
Table 1 Depth distribution across entire analysis area
Depth Band
Area in 1969 Area in 2007
(m AHD)
Above -3 19.6% 16.0%
-3 to -6 35.1% 33.5%
-6 to -11 29.8% 32.4%
-11 to -16 10.1% 11.4%
-16 to -21 3.8% 4.5%
Below -21 1.6% 2.2%
Around 2% of the area is below -21m AHD. The patterns show that the area which is
shallow (above -6m AHD) is reducing, while the area sitting in bands below -6m AHD are
increasing. This is consistent with an overall deepening of the flood tide delta. The results
are also consistent with an overall loss of sediment from the flood tide delta, which is
surprising, as common understanding would point towards the flood tide delta moving into
the Port, and the westward boundary of the area being analysed extends well beyond the
“dropover” of the delta into the deeper water of the estuarine basin. Typically, sandy
sediment moving into the Port would deposit close to the edge of the dropover. Given the
9extent of the analysis area, we would expect the volume of sediment present would remain
fairly constant.
While investigating further, a series of figures attributed to Roy (1974) were uncovered.
One of particular relevance to the present study is replicated as Figure 6. This shows
analysis similar to that described above. However, in this instance, the exact extents of
the polygon in question are unknown. The pattern of decrease in area shallower than 18
feet (~ -5.5 m to an unknown datum) and an increase in area which is deeper has been
apparent for around the past century at least, suggesting that the trend demonstrated in
Table 1 is sound.
Figure 6 Analysis attributed to Roy (1974) from an apparently unpublished
document. The locations of sub-areas A, B and C are unknown at the present time
10Following the lead of Roy, 1974, we have also examined selected sub-areas to identify
patterns of evolution. We have adopted areas that were covered with a reasonable
density of contours and were of particular interest in terms of evolution of the delta. Four
areas (A through D) were established and the extent of these is shown in Figure 7. The
analysis undertaken for the full analysis area was repeated for each sub area and the
results are discussed below.
Figure 7 Sub-area Analysis Results
Sub-Area A – Entrance Shoals
The analysis results for Sub-Area A are presented in Table 2.
Table 2 Depth distribution across sub-area A
Depth Band
Area in 1969 Area in 2007
(m AHD)
Above -3 ~ ~
-3 to -6 31.2% 10.7%
-6 to -11 39.9% 42.0%
-11 to -16 23.2% 36.8%
-16 to -21 5.2% 9.5%
Below -21 0.5% 1.0%
11Sub-Area A is around 1.1km2 in size covering notable shoals between the headlands of
Port Stephens. As for the broader flood tide delta, this area has deepened over time. As
the area deepens, the degree to which waves are refracted by the shoals reduces. This,
along with changes in the shape of the shoal will affect the degree and direction of wave
focussing caused by these shoals, and hence the location and extent of foreshore erosion
and sand movement as local wave conditions change at the shore.
Sub-Area B – Southern Tide Channel
The analysis results for Sub-Area B are presented in Table 3
Table 3 Depth distribution across Sub-Area B
Depth Band Area in 1969 Area in 2007
(m AHD)
Above -3 ~ ~
-3 to -6 31.2% 10.7%
-6 to -11 39.9% 42.0%
-11 to -16 23.2% 36.8%
-16 to -21 5.2% 9.5%
Below -21 0.5% 1.0%
Along the southern or main tidal channel of the Port, the 3.3km2 area again displays a
pattern of overall deepening. This is particularly marked with an apparent transfer of very
shallow area (between -3 and -6m AHD) to a moderately deep area (-11 to -16m AHD)
over the 40 year period. The pattern is consistent with widening of the main tidal channel.
Along with changes to other tidal channels, a continuation of this process is likely to result
in an increase in the efficiency of tidal exchange within the Port over time.
Sub-Area C – Southern Flood Tide Delta Edge
The analysis results for Sub-Area C are presented in Table 4.
Table 4 Depth distribution across Sub-Area C
Depth Band Area in 1969 Area in 2007
(m AHD)
Above -3 ~ 6.6
-3 to -6 8.8 11.7
-6 to -11 30.8 27.2
-11 to -16 25.9 17.8
-16 to -21 34.1 33.1
Below -21 0.4 3.7
12This area covers around 0.75km2 where the main (southern) tidal channel meets the
deeper estuarine basin of the Port, to the west of Corlette. Unlike sub-areas A & B this
area is shallowing. The shallowing is consistent with ongoing accumulation of sand
deposited by the tidal channel, implying that sand transport is flood tide dominated at this
location. This assumption is consistent with observations of the alignment and historical
movement of bed forms as documented by Geomarine (1988).
Sub-Area D – Northern Flood Tide Delta Edge
The analysis results for Sub-Area D are presented in Table 5.
Table 5 Depth distribution across Sub-Area D
Depth Band Area in 1969 Area in 2007
(m AHD)
Above -3 14.2% 10.2%
-3 to -6 54.4% 39.4%
-6 to -11 30.3% 30.4%
-11 to -16 12.2% 13.5%
-16 to -21 2.7% 5.5%
Below -21 0.7% 1.0%
This area, which covers the intersection of the minor (northern and middle) tidal channels
of the Port, seems to display a reverse pattern to that of sub-area C with overall deepening
indicated. Considering the location and coverage of this area, it is consistent with ebb tide
dominated transport and the erosion of the leading face of the flood tide delta in this
location. The pattern is broadly consistent with, but not exactly the same as, patterns
modelled by Jiang et al, 2013. These indicate an ongoing widening and eroding of the
northern and middle tidal channels, but with transport towards the entrance of the Port.
Discussion and conclusions
The comparison of hydrosurvey data from 1969 and 2007 was limited by the availability
and scale of the 1969 hydrosurvey data. Digitising of the original soundings from large
scale plans will go some way towards addressing this.
The patterns uncovered by the analysis indicate that there has been a net deepening trend
across the flood tide delta, although this trend may be particularly focussed on the
widening and deepening of the main tidal channels. The changes do point to an ongoing
loss of sand from the flood tide delta. While some of this sand may have worked its way
onshore and subsequently along shore, for example the growth of recurved spits to the
south of Corrie Island, the patterns suggest that there is no feed of sediment into the
entrance from offshore.
Much of the change is occurring along the main tidal channels, which are tending to
deepen, and within areas where those channels meet the ocean or the estuarine basin of
the Port. Ongoing deepening, exacerbated by sea level rise, will alter the way that the
13tides and waves propagate across the shoals of the flood tide delta. In turn, this will
modify the wave and current energies experienced at the foreshores of the Port. The
historical trends presented here between 1969 and 2007 may not continue into the future
and care should be taken in extrapolating these results, or rates of foreshore erosion and
accretion. Planning and management strategies adopted at various locations along these
foreshores need to bear in mind the possibility of a changing environment.
Acknowledgements
The support of the Office of Environment and Heritage and Port Stephens Council who
allowed their data and models to be used when preparing this paper are acknowledged.
References
BMT WBM, 2011. Halifax Park / Fly Point Sand Accumulation Study (No. R.2128.001.01).
BMT WBM, 2011b. Sediment and Hydrodynamic Assessment of the Lower Myall River
Estuary and Preparation of Management Recommendations. Prepared for Great Lakes
Council
Frolich, M., 2007. Recent Morphological Evolution of the Port Stephens Flood Tide Delta.
University of Sydney, Sydney.
Geomarine Pty. Ltd., 1988. Port Stephens Marina, Corlette. Coastal Processes
(Preliminary, Final is attached to Anchorage EIS No. 88001.01.003).
Jiang, A.., Ranasinghe, R., Cowell, P., 2013. Contemporary hydrodynamics and
morphological change of a microtidal estuary: a numerical modelling study. Ocean Dyn.
63, 21–41.
Lord, D., Watson, P., Kelleher, N., Avis, P., 1995. Offshore Dredging for Beach
Nourishment; Shoal Bay, N.S.W.
Roy (1974) "Estuarine Investigation - Eastern Port Stephens" Figures downloadable from
the Department of Primary Industries "DIGS" database. Manuscript apparently
unpublished.
Thom, B., Shepherd, M., Ly, C., Roy, P., Bowman, G., Hesp, P., 1992. Coastal
geomorphology and Quaternary geology of the Port Stephens-Myall Lakes area. Dept. of
Biogeography and Geomorphology, Australian National University, Canberra.
Vila-Concejo, A., Hughes, M., Short, A., Ranasinghe, R., 2010. Estuarine shoreline
processes in a dynamic low-energy system. Ocean Dyn. 60, 285–298.
Vila-Concejo, A., Short, A., Hughes, M., Ranasinghe, R., 2009. Formation and evolution of
a sandwave on an estuarine beach. J. Coast. Res. 153–7.
Vila-Concejo, A., Short, A., Hughes, M., Ranasinghe, R., 2007. Flood-tide Delta
Morphodynamics and Management Implications, Port Stephens, Australia. J. Coast. Res.
705–9.
Watson, P., 2000. Jimmys Beach, Port Stephens, NSW: an expensive learning experience
in coastal management. ASCE.
Watson, P., 1997. Port Stephens Sand Nourishment Projects Evaluation, Monitoring and
Sustainability. Presented at the Pacific Coasts and Ports, 1997.
Whitehead & Associates, 2015. Sandy Point / Conroy Park Foreshore and Drainage
Management Options Sudy. Prepared for Port Stephens Council
14You can also read