Glacier Cover Change Assessment of the Columbia Icefield in the Canadian Rocky Mountains, Canada (1985-2018)
←
→
Page content transcription
If your browser does not render page correctly, please read the page content below
geosciences

Article
Glacier Cover Change Assessment of the Columbia Icefield in
the Canadian Rocky Mountains, Canada (1985–2018)
Adjoa Intsiful and Shrinidhi Ambinakudige *

                                           Department of Geosciences, Mississippi State University, Mississippi State, MS 39762, USA; adi45@msstate.edu
                                           * Correspondence: ssa60@msstate.edu

                                           Abstract: Meltwater from glaciers makes significant contributions to general streamflow and provides
                                           water for flora and fauna. Continuous glacier monitoring programs enhance our understanding of
                                           the impacts of global warming on glaciers and their topographical features. The objective of this
                                           study is to measure spatial and temporal changes in Canada’s Columbia Icefield glaciers. This study
                                           uses Landsat (TM 5 and OLI) images to delineate glacier extents in the Columbia Icefield between
                                           1985 and 2018. The study also analyzes the retreat of the Athabasca, Castleguard, Columbia, Dome,
                                           Saskatchewan, and Stutfield Glaciers. The total area covered by the Icefield in 1985 was 227 km2 . By
                                           2018, the Icefield had lost approximately 42 km2 of its area coverage, representing 18% of its previous
                                           coverage. All glaciers in the study region retreated and decreased in area over the study period.
                                           The pattern observed in this study is one of general ice loss in the Columbia Icefield, which mirrors
                                           patterns observed in other mountain glaciers in Western Canada.

                                           Keywords: glaciers; Landsat; mass balance; machine learning; remote sensing; global warming;
                                           Columbia Icefield


                                           1. Introduction
Citation: Intsiful, A.; Ambinakudige,
                                                 Glaciers are a notable part of the cryosphere and play an important role in climate
S. Glacier Cover Change Assessment
                                           studies [1,2]. Glaciers adjust their size as a response to changing climatic conditions, which
of the Columbia Icefield in the
                                           make them good indicators of climate change. Glaciers remain the largest reservoir of
Canadian Rocky Mountains, Canada
(1985–2018). Geosciences 2021, 11, 19.
                                           freshwater on Earth, serving more than 1.3 billion people [3]. Meltwater, particularly from
https://doi.org/10.3390/
                                           mountain glaciers, makes significant contributions to general streamflow, especially in
geosciences11010019                        late summer when there are warm periods with dry weather [4,5]. Surface runoff from
                                           glaciers during summer regulate stream temperature, making it conducive for irrigation,
Received: 24 November 2020                 tourism, industry, hydro power, domestic consumption, and to support aquatic life [6,7].
Accepted: 28 December 2020                 Like other mountain glaciers, the Columbia Icefield (referred to as the “mother of rivers”)
Published: 31 December 2020                in the Canadian Rockies serves as a significant water resource as its meltwater feeds the
                                           Columbia, Athabasca, North Saskatchewan, and Fraser River systems [8]. Glacier run-off
Publisher’s Note: MDPI stays neu-          in the region is heavily relied upon for hydroelectric power generation in parts of British
tral with regard to jurisdictional clai-   Columbia. Mass wastage of these glaciers can cause increased volumes of late summer
ms in published maps and institutio-       discharge, which could lead to long-term loss of natural fresh water. A glacial lake outburst
nal affiliations.                          flood (GLOF) could lead to rapid discharge, which is mostly catastrophic to surrounding
                                           regions [9]. Due to the important role these mountain glaciers play in supplementing
                                           streams required for human and aquatic consumptions, it is imperative to monitor them
Copyright: © 2020 by the authors. Li-
                                           periodically. Studies of these mountain glaciers are necessary to understand their response
censee MDPI, Basel, Switzerland.
                                           to climate change and to predict the long-term impacts on water availability and global
This article is an open access article
                                           sea-level rise hazard preparedness. The Columbia Icefield also serves as one of the most
distributed under the terms and con-       visited tourist sites in North America; hence, consistent Icefield monitoring is key for
ditions of the Creative Commons At-        decision-making regarding hazard risk assessments that may be associated with glacier
tribution (CC BY) license (https://        cover change [10].
creativecommons.org/licenses/by/                 Beginning in the 1980s, the need to monitor these glaciers led to federal mapping, which
4.0/).                                     commenced as part of Canada’s contribution to the International Hydrological Decade.

Geosciences 2021, 11, 19. https://doi.org/10.3390/geosciences11010019                                    https://www.mdpi.com/journal/geosciences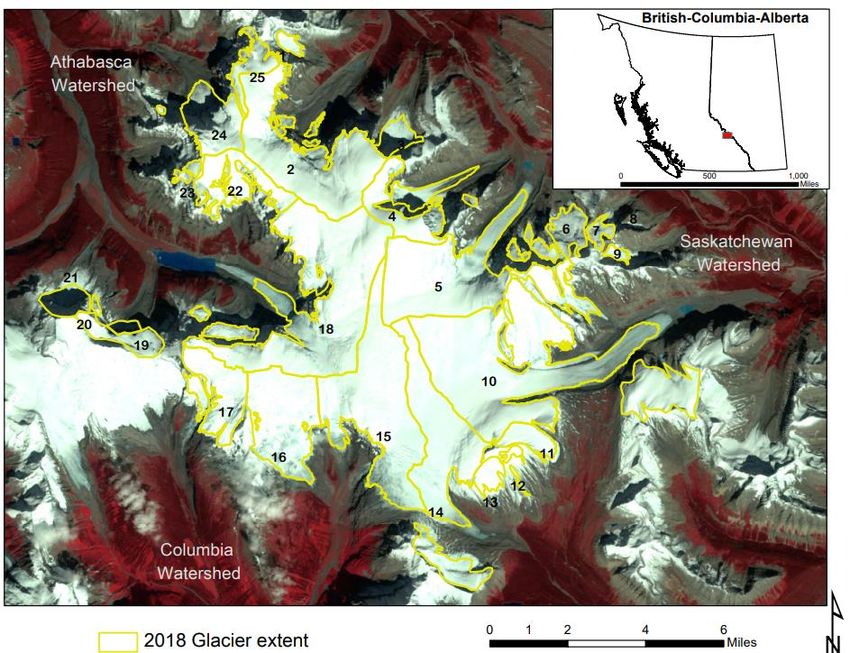
Geosciences 2021, 11, 19                                                                                                             2 of 9

                                   Glacier studies in the region have progressed over the years in the 21st century [10–12].
                                   Glaciologists in the area relied on the use of photogrammetric methods for glacier studies
                                   due to the size and remoteness of the glaciers [13,14]. These mappings focused on glacier
                                   length while a few included glacier thickness and width. The surveys were limited to
                                   easily accessible glaciers (Athabasca, Columbia, and Saskatchewan) with smoother fea-
                                   tures than others in the Canadian Cordillera. Subsequently, monitoring of the Athabasca
                                   and Saskatchewan Glaciers expanded to include mapping of glacier terminus changes,
                                   elevation, volume changes, and mass balance [15]. The Peyto Glacier, located in the Banff
                                   National Park, has the longest record of mass balance [16]. The Columbia Icefield, like other
                                   mountain ice in the 20th century, has seen an accelerated wastage of glacier ice [17]. Recent
                                   studies by Tennant and Menounos [15] reported that the Icefield retreated by an average
                                   of 1150 ± 34 m with an average thinning of 49 ± 25 meter water equivalent (m.w.e.) at a
                                   rate of −0.6 ± 0.3 m w.e.·a−1 between 1919 and 2009. Shrinkage reported was 2.4 ± 0.2
                                   and total area lost was 59.6 ± 1.2 km2 (23 ± 5%) at a rate of −0.6 ± 0.3 m.w.e. a−1 . These
                                   rates are, however, not uniform across the Icefield due to differences in size, topographical
                                   features, and surface cover. Remote sensing of glaciers provides a robust way to monitor
                                   the health of these glaciers which is assessed via changes in their area, length, volume, and
                                   mass balance over a specific period.
                                        The objective of this study is to use Landsat satellite imagery between 1985 and 2018
                                   in combination with high resolution images to measure spatial and temporal changes in
                                   the Columbia Icefield.

                                   2. Study Area
                                                  The Columbia Icefield is the largest icefield in the Canadian Rockies lying partly in the
                                             northwestern tip of Banff National Park and partly in the southern end of Jasper National
                                             Park (Figure 1). Meltwater from the Athabasca glacier flows into the Athabasca River and
                                             then into Lake Athabasca. Then it flows by the Slave River, through the Mackenzie River,
                                             and finally into the Arctic Ocean [18]. Meltwater from the Saskatchewan Glacier flows into
                                             Saskatchewan River and crosses the Alberta, Manitoba, and Saskatchewan provinces into
                                             the Hudson Bay and finally reaches the Atlantic Ocean. Runoff from the Columbia Glacier
                                             flows via the Columbia and Fraser Rivers into the Pacific Ocean. The Icefield comprises
                                             25 glaciers and may be either of individual ice bodies or glacier3 ofoutlets
          Geosciences 2021, 11, x FOR PEER REVIEW                                                                  10
                                                                                                                          based on glacial
                                             drainage [19].

                                   Figure 1. Study area. Landsat TM 5 scene obtained on 10 September 1999 showing the Columbia
                                    Icefield. 1. Study area. Landsat TM 5 scene obtained on 10 September 1999 showing the Columbia
                                   Figure
                                   Icefield.
                                   3. Data
                                   3.1. Satellite Imagery
                                        We utilized two rectified Landsat Thematic Mapper 5 (TM) scenes (acquired on 5
                                   September 1985, and 8 September 1999) and one Landsat 8 Operational Land Imager (OLI)
                                   scene (acquired on 10 September 2018). Both TM and OLI bands have a nominal spatial
                                   resolution of 30 m. The visible and near-infrared (VNIR) regions make up five spectral
Geosciences 2021, 11, 19 3 of 9
The six major glacier outlets include Stutfield to the north, Dome to the northeast,
Athabasca and Saskatchewan to the east, Castleguard to the south, and Columbia to the
West. The main glacier body is steep, which drops off through the lower glacier tongues
into deep canyons. The region is also characterized by lakes and thick, low-level forests in
the fringing valley areas. Its elevation ranges between 1000 and 3700 m a.s.l. [14].
The highest peaks of the Columbia Icefield are Mt. Athabasca (3491 m) and Mt.
Columbia (3745 m). The lower regions experience the development of alpine tundra in
regions above ~2250 m a.s.l., creating the Engelmann Spruce–Subalpine Fir ecosystem [15].
The region has an average annual temperature of –4.0 ◦ C and an annual snow precipitation
of 1277 mm between 1919 and 2009 [15]. The region’s climate is characterized by cyclonic
storms which occur because of maritime polar air masses from the west (between September
and June) and continental polar air masses from the east in winter [15].
3. Data
3.1. Satellite Imagery
We utilized two rectified Landsat Thematic Mapper 5 (TM) scenes (acquired on
5 September 1985, and 8 September 1999) and one Landsat 8 Operational Land Imager
(OLI) scene (acquired on 10 September 2018). Both TM and OLI bands have a nominal
spatial resolution of 30 m. The visible and near-infrared (VNIR) regions make up five
spectral bands with two shortwave infra-red bands. OLI has one cirrus cloud detection
band, two thermal bands (TIRS), and a 15 m panchromatic band (USGS 2015). The World
Reference System (WRS2) path 44 and row 24 Landsat scenes were downloaded from
the USGS Earth Resources Observation and Science Center (EROS) using the USGS Earth
Explorer website (https://earthexplorer.usgs.gov). The scenes covered the full extent of
the Columbia Icefield with minimal cloud coverage (Geosciences 2021, 11, 19 4 of 9
Table 1. Characteristics and spatial extents of glaciers in the Columbia Icefield.
Glacier Id GID_ Alias Glacier Watershed Glacier Length EL Elmin Elmax Slope Aspect
Name Type km m a.s.l. m a.s.l. m a.s.l. ◦
G242618E52257N G1 Athabasca DA 2.14024 2322 1829 2997 24 E
G242636E52211N G2 Stutfield Athabasca OIA 5.48778 2730 1716 3641 22 N
G242667E52233N G3 Athabasca DA 2.8122 2414 2113 3104 19 N
G242700E52191N G4 Dome Athabasca OIA 5.1964 2557 1985 3499 20 NE
G242719E52168N G5 Athabasca Athabasca OI 8.57839 2661 1941 3630 18 NE
G242808E52190N G7 Athabasca D 2.39973 2707 2292 3300 24 NE
G242528E52148N G19 Manitoba Athabasca DA 2.87506 2508 1707 3115 24 N
G242507E52151N G20 Athabasca DA 1.33019 2328 2139 2893 29 NE
G242484E52165N G21 Athabasca DA 2.80028 2201 2018 3009 13 N
G242588E52208N G22 Athabasca OI 2.78967 2904 2232 3604 27 SE
G242556E52214N G23 Athabasca DA 3.26222 2666 2141 3374 24 W
G242571E52227N G24 Athabasca DA 4.8831 2738 1776 3685 23 NW
G242604E52252N G25 Athabasca OIA 3.24986 2985 2251 3446 31 NW
G242790E52191N G6 Little Athabasca Columbia D 2.27291 2744 2258 3301 25 N
G242690E52094N G15 Columbia OI 10.5525 2460 1620 3268 18 SW
G242614E52109N G16 Columbia O 5.114 2540 1810 3122 16 SE
G242573E52119N G17 Columbia OI 3.00956 2684 1767 3416 22 SW
G242657E52180N G18 Columbia Columbia OI 8.96298 2738 1511 3567 22 W
G242808E52190N G8 Saskatchewan D 2.14288 2426 2358 2526 18 E
G242821E52181N G9 Hilda Saskatchewan D 3.24571 2369 2062 2796 25 NE
G242731E52135N G10 Saskatchewan Saskatchewan O 12.4949 2513 1776 3534 16 E
G242766E52115N G11 Castleguard I Saskatchewan O 2.5705 2627 2325 3020 16 E
G242757E52101N G12 Castleguard II Saskatchewan D 0.991545 2624 2482 2809 19 SE
G242711E52106N G13 Castleguard III Saskatchewan O 1.32388 2609 2463 2762 12 SE
G242711E52106N G14 Castleguard IV Saskatchewan O 10.1888 2429 1973 3031 15 SE
Mean 4.427011 2579.36 2021.8 3217.96
D is a detached glacier, O is an outlet glacier, I is glaciers with at least one icefall, and A means the glaciers is avalanche-fed. (Glacier ID,
flowshed, watershed, type, elevation, slope, and aspect adapted from GLIMS inventory).
4.2. Error Estimation
For error in glacier area, a buffer was created around each individual glacier [6], and
the difference between the two polygons was calculated. The buffer method for error
estimation added and subtracted a specific distance from the glacier outlines and then
calculated the difference. In this study, we used the length error as the buffer distance. A
detailed error analysis as laid out in the Tennant and Menounos study [6,15] was followed.
The area was calculated and subtracted from the area of the digitized boundaries using the
raster calculator tool in ArcGIS. The sum of each year’s error was noted, and the total error
in glacier change measurements was computed as:
q
E∆ = E12 + E22 + . . . + En2 (1)
where E∆ is the total error calculated, E12 is the error in year one, and so on. Absolute length
error was based on the combined mean horizontal RMSE and half of the resolution of the
data (15 m) of a scene. Error in retreat between two years was calculated using Equation (1).
5. Results
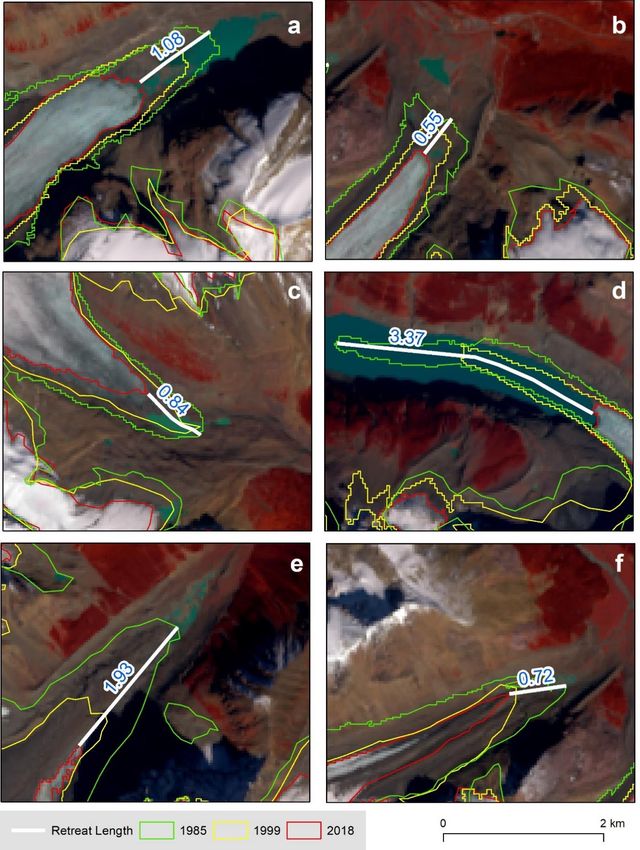
Results from this study on glacier area and length changes indicate a significant retreat
of the glaciers in the Columbia Icefield from 1985 to 2018. Each glacier experienced some
amount of retreat and loss in coverage area (Figure 2). The Columbia Glacier experienced
the highest absolute retreat (3.37 km) but has a lake at its terminus. The least retreated
glacier was the Athabasca (0.56 km) over the study period. Mean retreat recorded for
the Athabasca, Columbia, Stutfield, Dome, Castleguard, and Saskatchewan Glaciers was
1.42 km at a rate of 0.04 km·a−1 as shown in Table 2. Results indicate a retreat in glacier
tongues of the Columbia Icefield in the period 1985–2018. All glaciers except Dome and
Stutfield experienced lower retreat in 1985–1999 than in 1999–2018. The total mean among
all six glaciers between the first half of the study period increased about 400% in the second
half of the study period as shown in Table 2. Estimated error in retreat length was 21.6 m,
which is negligible since it is less than 1 pixel size (30 m).Geosciences 2021, 11, 19 5 of 9
Geosciences 2021, 11, x FOR PEER REVIEW 6 of 10
Figure 2. Length of retreat in six major glaciers in Columbia Icefield. *Glacier names: (a) = Saskatchewan, (b) = Athabasca,
Figure 2. Length of(d)
(c) = Castleguard, retreat in six major
= Columbia, (e) =glaciers in (f)
Stutfield, Columbia
= Dome.Icefield. Glacier names: (a) = Saskatchewan, (b) = Athabasca,
(c) = Castleguard, (d) = Columbia, (e) = Stutfield, (f) = Dome.
An overlay of the 1985, 1999, and 2018 glacier boundaries, showed a loss in extent of
Total area change from 1985 to 2018 (Table 3) was 42.56 km2 for the entire Icefield. The
ice in all three watersheds (Athabasca, Columbia and Saskatchewan). For the Athabasca
Columbia Glacier lost the largest absolute area of 5.62 km2 at a rate of 1.02% a−1 between
watershed, total ice area loss was 21.26 km2, which was the largest among the three. This
1985 and 2018 while G242711E52106N (G13) lost the smallest relative area (0.1 km2 ) at a rate
is partly due to the watershed hosting most of the glaciers as compared to the other two.
of 0.27% a−1 between 1985 and 2005. The least absolute and relative area loss changes were
The Columbia and Saskatchewan watersheds lost an area of 9.5 km2 and 11.7 km2 of theirGeosciences 2021, 11, 19 6 of 9
recorded by the G242711E52106N (G13) and G242808E52190N (G8) glaciers, respectively,
during the study period.
Table 2. Glacier retreat of the Athabasca, Castleguard, Dome, Saskatchewan, Columbia, and Stutfield
Glaciers between 1985 and 2018.
Glacier Glacier_ID 1985–1999 1999–2018 1985–2018 Rate
L(km) L(km) L(km) L (km a–1 )
Dome G4 0.64 0.09 0.72 0.02
Stutfield G2 1.49 0.43 1.93 0.06
Athabasca G5 0.21 0.35 0.55 0.02
Columbia G18 1.59 1.78 3.37 0.1
Castleguard G14 0.11 0.76 0.84 0.03
Saskatchewan G10 0.48 0.60 1.08 0.03
Mean 0.17 0.68 1.42 0.04
Table 3. Glacier area change between 1985 and 2018.
Area Area Change Annual Rate
Glacier Id Glacier Watershed 1985 1999 2018 1985–1999 1999–2018 1985–2018 1985–2018
Name km2 km2 km2 km2 km2 km2 (%) (%)
G242618E52257N Athabasca 1.2 0.8 0.6 −0.4 −0.1 −0.6 −49.4 −2.9
G242636E52211N Stutfield Athabasca 22.2 19.6 17 −2.5 −2.6 −5.1 −23.1 −1.4
G242667E52233N Athabasca 2.6 1.9 1.7 −0.6 −0.2 −0.9 −34.1 −2
G242700E52191N Dome Athabasca 9.1 7.9 6.7 −1.3 −1.1 −2.4 -26.4 −1.6
G242719E52168N Athabasca Athabasca 19 17.4 16.7 −1.6 −0.8 −2.3 −12.4 −0.7
G242808E52190N Athabasca 1.2 1.1 0.8 −0.1 −0.3 −0.4 −35.1 −2.1
G242528E52148N Manitoba Athabasca 5.8 4 3.1 −1.8 −0.9 −2.7 −46.5 −2.7
G242507E52151N Athabasca 0.4 0.6 0.2 0.2 −0.4 −0.2 −56.8 −3.3
G242484E52165N Athabasca 3.4 3.1 2 −0.2 −1.2 −1.4 −40.7 −2.4
G242588E52208N Athabasca 6.2 6.5 5.4 0.2 −1.1 −0.8 −13 −0.8
G242556E52214N Athabasca 3.2 2.2 0.6 −1 −1.6 −2.6 −82.6 −4.9
G242571E52227N Athabasca 7.5 6 5.4 −1.4 −0.6 −2.1 −27.5 −1.6
G242604E52252N Athabasca 2 2.7 2.3 0.7 −0.3 0.4 17.7 1
G242790E52191N Little Athabasca Columbia 2.7 2.3 2.2 −0.4 −0.1 −0.5 −18.7 −1.1
G242690E52094N Columbia 21.6 20.8 19.5 −0.8 −1.3 −2.1 −9.7 −0.6
G242614E52109N Columbia 11.5 11.1 10.5 −0.4 −0.5 −1 −8.4 −0.5
G242573E52119N Columbia 6.8 6.4 6.4 −0.4 0 −0.4 −5.6 −0.3
G242657E52180N Columbia Columbia 32.4 30.8 26.8 −1.6 −4 −5.6 −17.4 −1
G242808E52190N Saskatchewan 0.9 0.2 0 −0.7 −0.2 −0.9 −100 −5.9
G242821E52181N Hilda Saskatchewan 2.4 0.9 0.4 −1.5 −0.5 −2 −83.2 −4.9
G242731E52135N Saskatchewan Saskatchewan 42.7 39.4 37.3 −3.3 −2 −5.4 −12.6 −0.7
G242766E52115N Castleguard I Saskatchewan 2.3 2.1 2 −0.1 −0.1 −0.3 −11.5 −0.7
G242757E52101N Castleguard II Saskatchewan 1.5 1 0.3 −0.4 −0.7 −1.1 −76.6 −4.5
G242711E52106N Castleguard III Saskatchewan 1.5 1.8 1.5 0.3 −0.3 −0.1 −4.6 −0.3
G242711E52106N Castleguard IV Saskatchewan 17.3 17 15.3 −0.3 −1.7 −2 −11.5 −0.7
9.1 8.3 7.4 −0.8 −0.9 −1.7 −31.6 −1.9
227.4 207.6 184.8 −19.8 −22.8 −42.6 −18.7 −1.1
An overlay of the 1985, 1999, and 2018 glacier boundaries, showed a loss in extent of
ice in all three watersheds (Athabasca, Columbia and Saskatchewan). For the Athabasca
watershed, total ice area loss was 21.26 km2 , which was the largest among the three. This
is partly due to the watershed hosting most of the glaciers as compared to the other two.
The Columbia and Saskatchewan watersheds lost an area of 9.5 km2 and 11.7 km2 of their
ice area. The overall mean glacier area change was 1.70 km2 at a rate of 1.87% a−1 during
1985–2018. The mean area changes for the entire Icefield increased from 0.79 km2 between
1985 and 1999 to 1.70 km2 between 1999 and 2018. The estimated error in area change
measurements is ±11.84 km2 .
For further analysis, the glaciers were divided into classes according to their sizes
based on the 1985 image: 20 km2 .
Glaciers between 1.0 and 5.0 km2 had the largest composite of glaciers per class (Table 4).
It was observed that larger glaciers (>20 km2 ) tend to have the greatest absolute area
loss ( −18.23 km2 ; −15.3%), at a rate of −0.5%a−1 , while the smaller glacier classes (Geosciences 2021, 11, 19 7 of 9
rate of −2.6% for the entire study period (i.e., 1985–2018). Mean glacier change was seen
in all class sizes from 1985–1999 and 1999–2018 as shown in Table 4. Based on evidence
from previous studies of the area, it was observed that there was a greater number of
smaller glaciers in the area during the study period than there was before 1985. This can be
attributed to the weakening and disintegration of larger glaciers into smaller portions and
is evidence of glacier shrinkage.
Table 4. Changes in class sizes of the glaciers between 1985 and 2018.
Class Count Mean Area 1999–1985 Change 2018–1999 Change 1985–2018 Change Annual Rate
(km2 ) km2 km2 (%) km2 (%) km2 (%) km2 (%)
20 4 29.7 −8.3 −7.0 −9.9 −9.0 −18.2 −15.3 −0.6 −0.5
Mean −3.3 −8.7 −3.8 −11.0 −1.7 −30.9 −0.1 −1.8
Total 25 −19.8 −8.7 −22.8 −11.0 −42.6 −18.7 −1.3 −1.1
6. Discussion and Conclusions
The pattern observed in this study is one of general ice loss in the Columbia Icefield.
All glaciers retreated and decreased in area cover over the study period. The termini
of the six major glaciers—Athabasca, Columbia, Saskatchewan, Stutfield, Dome, and
Castleguard—decreased in area by an average of 1.3 km2 while the total area loss of the
entire Icefield was 42.56 km2 at a rate of 1.29 km2 a−1 during the study period. Between
1985 and 2018, the mean retreat of the six major glaciers was 1.43 km at a rate of 0.04 km a−1 .
The rate of glacier area changes in this study (0.57% a−1 ) is comparable to the findings
of Bolch et al. [12] in their study of Western Canada. Their study revealed an area loss
rate of 0.6 ± 0.19% a−1 for the Southern Canadian Rockies, which includes the Columbia
Icefield, between 1985 and 2005. From this rate, glacier change may be very subtle; hence,
it may take a longer period of glacier monitoring to detect significant changes. However, a
perfect agreement with other studies is not to be expected due to differences in the study
periods and the extent of spatial coverage. In this study, the highest absolute glacier retreat
was recorded for the Columbia Glacier (1.94 ± 0.05 km). This is similar to the results
of Tennant and Menounos [15], who, for the same glacier, found the highest retreat of
3.7 ± 0.03 km between 1919 and 2006. The Saskatchewan Glacier had the largest absolute
area loss, which is also in agreement with the findings of Tennant and Menounos [15].
Glacier retreat have led to the formation of small water bodies in Athabasca, Columbia,
and Saskatchewan watersheds in the study area. Formation of water bodies was also
observed in other mountain glaciers in Western Canada [22,24]. Although ice loss patterns
have been observed and reported in studies between the mid-1990s and 2000, the area,
like other glaciers worldwide, is characterized by variability in glacier parameters, and it
is mostly dependent on climate change, among other factors. While the average glacier
retreat was 1.43 km within the study period, there were irregular glacier landscape features
for every year in the study period. For instance, Baumann [25], measured glacier changes
in the Columbia Glacier every year between 1985 and 2010. That study showed that the
glacier advanced in some years while in other years (1998, 1999, and 2008), it did not
change at all. This could be the case of the other major glaciers in the Icefield due to altitude
and changes in snow precipitation over the years.
As seen in some previous studies [15,24], when glacier changes were evaluated ac-
cording to their class values, smaller-sized glaciers experienced higher relative area loss
rates compared to larger-sized glaciers, that had the largest absolute retreat. This is because
the larger glaciers have the greatest ice cover to lose. However, the smaller glaciers, which
also are usually the detached glaciers, recorded lower relative area loss than the largerGeosciences 2021, 11, 19 8 of 9
glacier bodies, which are avalanche-fed. For each class between 1985–2018, it was observed
that the mean rate of area lost for each class-size increased over the subsequent time period
(1985–1999 and 1999–2018). The number of individual glaciers within the Columbia Ice-
field increased compared to years prior to 1985, mainly because a few the larger glaciers
disintegrated into smaller portions as they became weak and unstable.
On error analysis, although we were able to provide rough estimates, we do acknowl-
edge that error estimation in glacial studies is still very challenging, and there may be some
error sources associated with the study area. A thorough review of glaciology literature
reveals that the glaciological community has not emphatically reached a consensus [26]
on the subject concerning the best method for error analysis. Thus, a few studies fully
quantify errors associated with their mapping. For instance, in this study, we decided to
use the GIS buffer method for error analysis, which presented two different measurement
possibilities. The first uses 1 pixel size (30 m) [20,26] as the buffer distance. The second
uses error length [6,15] as the distance of the buffer, which usually combines one-half of
the resolution and the RMSE of the scene. The latter was employed because we wanted to
maintain consistency with previous studies of the area.
Since the Columbia Icefield is in a mountainous region, it is important to consider
errors that can be introduced by topographic illumination. Our overall confidence in
mapping the area is high in regions of clean ice but is slightly less in regions covered in
debris, which posed as a major error source due to lack of field data. The use of Google
Maps and Bing images helped, but we were unable to justify the clear extent in the debris-
covered terminus. Fortunately, the debris cover was relatively low compared to the clean
ice areas; thus, we are highly confident in our area delineation and error estimates. The use
of the band ratio helped to illuminate internal rocks, which were primarily in cast shadows.
Going forward, field data or more improved methods for clearly mapping debris cover
may be necessary for proper mapping.
Author Contributions: Data curation, A.I.; Formal analysis, A.I.; Funding acquisition, S.A.; Method-
ology, A.I. and S.A.; Project administration, S.A.; Resources, A.I.; Software, A.I.; Supervision, S.A.;
Visualization, A.I.; Writing—original draft, A.I.; Writing—review & editing, S.A. All authors have
read and agreed to the published version of the manuscript.
Funding: This research received no external funding.
Institutional Review Board Statement: Not applicable.
Informed Consent Statement: Not applicable.
Data Availability Statement: Data that were analyzed in this study are publicly available. This data
can be found here: (1) USGS Earth Explorer (https://earthexplorer.usgs.gov) (2) Global Land Ice
Measurement from Space (GLIMS) inventory (https://www.glims.org/).
Conflicts of Interest: The authors declare no conflict of interest.
References
1. Ambinakudige, S. A study of the Gangotri glacier retreat in the Himalayas using Landsat satellite images. Int. J. Geoinf. 2010, 6, 7.
2. Inamdar, P.; Ambinakudige, S. Spatial Patterns of Glacier Mass Change in the Southern Andes. Photogramm. Eng. Remote Sens.
2016, 82, 811–818. [CrossRef]
3. Brown, J.; Harper, J.; Humphrey, N. Cirque glacier sensitivity to 21st century warming: Sperry Glacier, Rocky Mountains, USA.
Glob. Planet. Chang. 2010, 74, 91–98. [CrossRef]
4. Zappa, M.; Kan, C. Extreme heat and runoff extremes in the Swiss Alps. Natural Hazards and Earth System Science. Copernic.
Publ. Behalf EGU 2007, 7, 375–389.
5. Jost, G.; Moore, R.D.; Smith, R.; Gluns, D.R. Distributed temperature-index snowmelt modelling for forested catchments. J. Hydrol.
2012, 420, 87–101. [CrossRef]
6. Granshaw, F.D.; Fountain, A.G. Glacier change (1958–1998) in the north Cascades national park complex, Washington, USA. J.
Glaciol. 2006, 52, 251–256. [CrossRef]
7. Stahl, K.; Moore, R.D. Influence of watershed glacier coverage on summer streamflow in British Columbia, Canada. Water Resour.
Res. 2006, 42. [CrossRef]
8. Marsh, J. Columbia Icefield. 2015. Available online: https://www.thecanadianencyclopedia.ca/en/article/columbia-icefield
(accessed on 24 November 2020).Geosciences 2021, 11, 19 9 of 9
9. Berthier, E.; Schiefer, E.; Clarke, G.K.C.; Menounos, B.; Remy, F. Contribution of Alaskan glaciers to sea-level rise derived from
satellite imagery. Nat. Geosci. 2010, 3, 92–95. [CrossRef]
10. Schiefer, E.; Menounos, B.; Wheate, R. Recent volume loss of British Columbian glaciers, Canada. Geophys. Res. Lett. 2007, 34.
[CrossRef]
11. Demuth, M.N.; Pinard, V.; Pietroniro, A.; Luckman, B.H.; Hopkinson, C.; Dornes, P.; Comeau, L. Recent and past-century
variations in the glacier resources of the Canadian Rocky Mountains: Nelson River system. Terra Glacial. 2008, 11, 27–52.
12. Bolch, T.; Menounos, B.; Wheate, R. Landsat-based inventory of glaciers in western Canada, 1985–2005. Remote Sens. Environ.
2010, 114, 127–137. [CrossRef]
13. Della Ventura, A.; Rampini, A.; Rabagliati, R.; Barbero, R.S. Development of a satellite remote sensing technique for the study of
alpine glaciers. Int. J. Remote Sens. 1987, 8, 203–215. [CrossRef]
14. Haeberli, W. Glacier and permafrost signals of 20th-century warming. Ann. Glaciol. 1990, 14, 99–101. [CrossRef]
15. Tennant, C.; Menounos, B. Glacier change of the Columbia Icefield, Canadian Rocky Mountains, 1919–2009. J. Glaciol. 2013, 59,
671–686. [CrossRef]
16. Demuth, M.N.; Munro, D.S.; Young, G.J. Peyto Glacier: One Century of Science; Environment Canada: Saskatoon, SK, Canada, 2006.
17. Barry, R.G. The status of research on glaciers and global glacier recession: A review. Prog. Phys. Geogr. Earth Environ. 2006, 30,
285–306. [CrossRef]
18. Kite, G.; Reid, I. Volumetric change of the Athabasca Glacier over the last 100 years. J. Hydrol. 1977, 32, 279–294. [CrossRef]
19. The Editors of Encyclopaedia Britannica. Columbia Icefield. 2018. Available online: https://www.britannica.com/place/
Columbia-Icefield (accessed on 24 November 2020).
20. Racoviteanu, A.E.; Paul, F.; Raup, B.; Khalsa, S.J.S.; Armstrong, R. Challenges and recommendations in mapping of glacier
parameters from space: Results of the 2008 Global Land Ice Measurements from Space (GLIMS) workshop, Boulder, Colorado,
USA. Ann. Glaciol. 2009, 50, 53–69. [CrossRef]
21. Glims, N. Global Land Ice Measurements from Space Glacier Database; Compiled and Made Available by the International GLIMS
Community and the National Snow and Ice Data Center: Boulder, CO, USA, 2005; updated 2018. Available online: https:
//nsidc.org/data/nsidc-0272 (accessed on 24 November 2020). [CrossRef]
22. Paul, F.; Bolch, T.; Kääb, A.; Nagler, T.; Nuth, C.; Scharrer, K.; Shepherd, A.; Strozzi, T.; Ticconi, F.; Bhambri, R.; et al. The glaciers
climate change initiative: Methods for creating glacier area, elevation change and velocity products. Remote Sens. Environ. 2015,
162, 408–426. [CrossRef]
23. Ambinakudige, S.; Joshi, K. Remote Sensing of Cryosphere. In Remote Sensing—Applications; InTech Open: Rijeka, Croatia, 2012;
pp. 369–380.
24. Tennant, C.; Menounos, B.; Wheate, R.D.; Clague, J.J. Area change of glaciers in the Canadian Rocky Mountains, 1919 to 2006.
Cryosphere 2012, 6, 1541–1552. [CrossRef]
25. CellMed, A. GLP-1 CellBeads®for the Treatment of Stroke Patients with Space-Occupying Intracerebral Hemorrhage. 2011.
Available online: http://www.clinicaltrials.gov (accessed on 13 May 2016).
26. Burns, P.; Nolin, A.W. Using atmospherically-corrected Landsat imagery to measure glacier area change in the Cordillera Blanca,
Peru from 1987 to 2010. Remote Sens. Environ. 2014, 140, 165–178. [CrossRef]You can also read