PROVINCIAL POPULATION AND HARVEST ESTIMATES OF MOOSE IN BRITISH COLUMBIA
←
→
Page content transcription
If your browser does not render page correctly, please read the page content below
PROVINCIAL POPULATION AND HARVEST ESTIMATES OF MOOSE IN
BRITISH COLUMBIA

Gerald W. Kuzyk

Ministry of Forests, Lands and Natural Resource Operations, P.O. Box 9391, Victoria, British Columbia
V8W 9M8, Canada

ABSTRACT: Provincial population and harvest estimates of moose in British Columbia, Canada
were assessed over a 28-year period from 1987 to 2014. The population generally remained stable,
whereas the licensed hunter harvest declined gradually by about half despite constant hunter effort.
The annual population estimate ranged from a low of 157,000 moose in 1994 to a high of 190,000
in 2011, with an overall mean of 172,000 ± 9900 (SD). In 2014, the relative status of hunted popula-
tions within 7 wildlife administrative units was 1 increasing, 3 stable, and 3 in decline. The mean an-
nual licensed harvest was 10,038 ± 2137 (SD) moose, and the mean harvest rate was 6 ± 1.3% (SD). In
December 2013, British Columbia initiated a 5-year (2013–2018) research project to identify factors
contributing to the decline of the moose population and licensed harvest.

                                                                   ALCES VOL. 52: 1–11 (2016)

Key words: Alces alces, British Columbia, harvest, moose, population

     Periodic updates of moose (Alces alces)               Moose in British Columbia are highly
abundance are necessary to assess manage-             valued for food, social, and ceremonial pur-
ment objectives (Brown 2011), evaluate sus-           poses by First Nations, for recreational and
tainable harvest (Timmerman and Buss                  commercial harvest opportunities by licensed
2007), and to provide information to the              hunters, and for wildlife viewing. Specific
public. Assessing licensed harvest concur-            management objectives for moose harvest
rent with population estimates should pro-            are to manage for First Nations use, support
vide better understanding and explanation             a sustainable licensed hunter harvest, and pro-
of population fluctuations over time. Moose           vide for diverse hunter opportunities (BC
population estimates are also used for com-           FLNRO 2015). Assessment of abundance
                                                      and licensed harvest estimates is required to
parison among jurisdictions to assess pat-
                                                      ensure that harvest levels are sustainable
terns of broad-scale population trends. In
                                                      (Hatter 1999), objective information is avail-
North America, there is current concern for
                                                      able for management decisions, and to pro-
declining populations in southern parts of
                                                      vide accurate information on the status of
moose range (Murray et al. 2006, Lenarz               moose to stakeholders and the public (BC
et al. 2009), whereas populations remain              FLNRO 2015). The purpose of this paper is
stable in other areas (Murray et al. 2012).           to provide an overview of the population
Explanations for population change include            abundance and licensed harvest of moose in
human-caused habitat alterations (Rempel              British Columbia from 1987 to 2014.
et al. 1997), climate change (Rempel 2011),
and a combination of natural and human-                             STUDY AREA
influenced variables (Murray et al. 2006,                 British Columbia is an ecologically di-
Brown 2011).                                          verse province (Meidinger and Pojar 1991)

                                                  1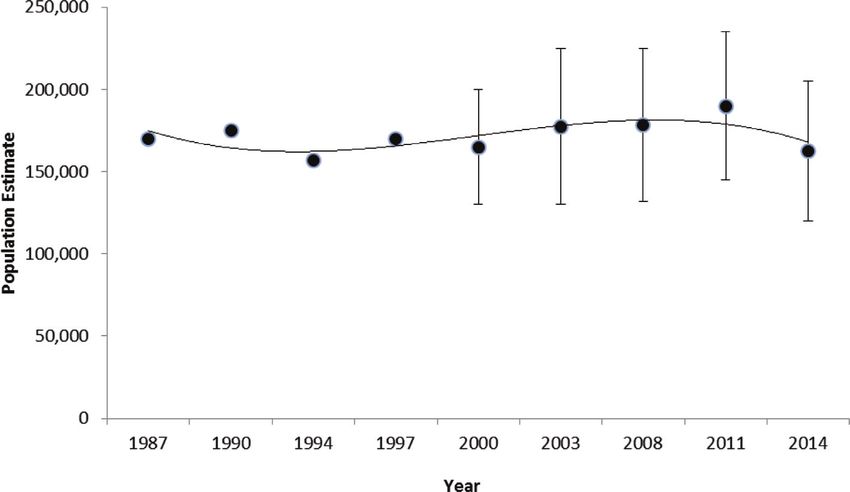
POPULATIONS AND HARVEST OF MOOSE IN BC – KUZYK ALCES VOL. 52, 2016
where moose are widely distributed (Fig. 1) bears (Ursus arctos), and black bears (U.
and occupy a range of landscapes including americanus), with cougars (Puma concolor)
wet coastal habitats, dry interior forests, important in southern British Columbia
cold northern forests, and montane habitats (Spalding and Lesowski 1971). Bull hunts
(Eastman and Ritcey 1987). At the provincial were mostly open seasons, with antler restric-
scale, moose co-exist with several ungulate tions or limited entry hunts occurring
species including bison (Bison bison), mule between 15 August and 30 November.
deer (Odocoileus hemionus), white-tailed Antlerless harvest was largely restricted to
deer (Odocoileus virginianus), elk (Cervus limited entry hunts with some general open
elaphus), and caribou (Rangifer tarandus) seasons for calves in select areas. Seasons
(Shackleton 1999). The main predators of for antlerless moose occurred between 1 Oc-
moose are wolves (Canis lupus), grizzly tober and 10 December (BC MOE 2010).
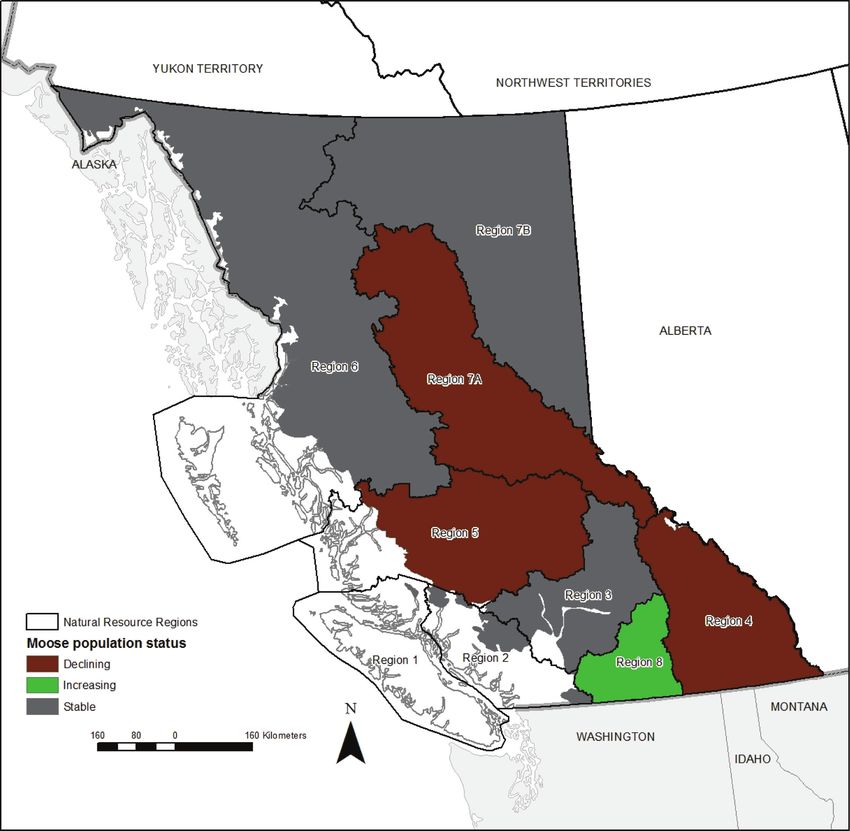
Fig. 1. Distribution and population status (i.e., stable, increasing, decreasing) of moose in 7 wildlife
administrative units in British Columbia, Canada, 2014.
2ALCES VOL. 52, 2016 KUZYK – POPULATIONS AND HARVEST OF MOOSE IN BC Hunting seasons were generally available with radio-marked moose in central British throughout the distribution of moose with Columbia (Quayle et al. 2001). Aerial sur- the exception of Regions 1 and 2 which veys were required to conform to standards have few moose (i.e.,
POPULATIONS AND HARVEST OF MOOSE IN BC – KUZYK                                   ALCES VOL. 52, 2016

resource professionals. This information was           Figs. 1 and 4), and one region was increasing
gathered during a variety of forums and loca-          (Region 8; Figs. 1 and 3).
tions including formal stakeholder meetings                The mean annual licensed harvest from
and informal discussions.                              1987 to 2014 was estimated as 10,038 ±
     Licensed harvest of moose was moni-               2137 (SD). Total harvest declined gradually
tored annually from 1987 to 2014 with a pro-           by about one-half during this period, yet
vincial resident hunter survey, and guide              hunter effort (average days hunted) remained
declarations for non-resident hunters. Har-            stable (Fig. 5). The mean annual licensed
vest information from First Nations was not            harvest rate from 1987 to 2014 was 6 ±
part of the provincial hunter survey and was           1.3% (SD), ranging two-fold from a high of
largely unknown (BC FLNRO 2015), with                  8% in 1987 to a low of 4% in 2011. From
the exception of certain First Nations com-            1987 to 2014, the mean number of licensed
munities that voluntarily provided informa-            hunters (resident and non-resident combined)
tion. Estimates of licensed hunter harvest             was 33,721 ± 4292 (SD) that spent 273,622 ±
(resident and non-resident combined), hunter           32,521 (SD) days of hunter effort (Table 1).
days, and hunter numbers were available, all           The mean annual hunting license sales was
with 95% confidence intervals (CI). These              39,815 ± 4158 (SD) from 1989 to 2014
estimates were produced from mail-out ques-            and varied minimally from 1993 to 2014
tionnaires sent to a random sample of resident         (Table 1).
hunters; from 2008 to 2014 an average of
13,003 questionnaires were mailed annually
with an average response rate of 61%.                                  DISCUSSION
Licensed harvest rates were calculated                      The annual moose population in British
from the provincial population estimate for            Columbia during 1987–2014 was relatively
a given year and the average of the 3 nearest          stable, averaging 172,000. In 2014 hunted
harvest estimates; 2014 was an exception               populations were stable in 3 regions, decreas-
when the average of the 2 nearest harvest              ing in 3 regions, and increasing in one.
estimates were used because of delay in the            Although both provincial and regional popula-
2015 estimate. Combined resident and non-              tion estimates had varied levels of uncertainty,
resident hunting license sales from 1989 to            they remain important for resource mana-
2014 were used to further measure hunter               gers to address management objectives (BC
interest.                                              FLNRO 2015), and to inform First Nations,
                                                       stakeholders, and the general public about
                  RESULTS                              the status of moose in British Columbia.
     The mean annual population estimate                    The estimation error was partially re-
of moose in British Columbia was 172,000               sponsible for the uncertainty reported in
± 9900 (SD) from 1987 to 2014. Annual esti-            the abundance estimates. The variation in
mates were relatively stable ranging from a            the population estimates may reflect the
low of 157,000 moose in 1994 to a high of              varied abundance and composition of local
190,000 in 2011 (Fig. 2). The minimum and              and regional predators (Ballard and Van
maximum estimates (i.e, from 2000 to 2014)             Ballenberghe 2007), human-altered land-
reflected varied levels of uncertainty (Fig. 2).       scape change (Rempel et al. 1997) which
The 2014 estimates varied among the 7 regions          may enhance forage quality and quantity
with hunted populations: 3 were considered             while facilitating predator and hunter access
stable (Regions 3, 6, and 7B; Figs. 1 and 3),          to moose, and variation in licensed and un-
3 were declining (Regions 4, 5, and 7A;                licensed harvest levels (Timmerman and

                                                   4
ALCES VOL. 52, 2016 KUZYK – POPULATIONS AND HARVEST OF MOOSE IN BC
Fig. 2. Provincial population estimates of moose and trend line derived from
inventories, population modeling, and expert opinion from 1987 to 2014 in British
Columbia, Canada. Minimum and maximum ranges in population estimates are
presented from 2000 to 2014.
Buss 2007). Other factors such as weather, due to easier access afforded by high density
disease, parasites, and accidents including of roads and cutblocks (Ritchie 2008).
road and rail mortality also influence local To address the recent moose population
moose abundance. The quality of data used declines, British Columbia initiated a provin-
to develop the population estimates could cially-coordinated research project in 2013 to
also be improved with increased financial evaluate the landscape change hypothesis
and logistical support that would provide (Kuzyk and Heard 2014) and to increase
more aerial surveys over a broader geograph- science-based information for moose man-
ical area. agement. To date, unpublished data from
Of most concern to stakeholders were re- this research has provided no evidence that
cent (2008–2014) population declines in low pregnancy rates, infectious disease, or
Regions 4, 5, and 7A (Fig. 4). In two regions parasites are influencing the moose popula-
(Region 5 and 7A) the moose declines coin- tion (H. Schwantje, BC FLNRO, personal
cided with a mountain pine beetle (Dendroc- communication). Similarly, preliminary adult
tonus ponderosae) epidemic (Chan-McLeod survival rates are within the limits of a stable
2006) which led to increased salvage logging moose population (92 ± 8% in 2013–2014
and associated road building. This type of and 92 ± 5% in 2014–2015; Kuzyk et al.
landscape change can presumably alter the 2015). In southeastern British Columbia (Re-
spatial dynamics of moose, predators, and gion 4), declining forage production in older
hunters, ultimately influencing moose abun- burns and wolf predation are believed limit-
dance and harvest rate. Although moose ing to moose population growth (Stent
should benefit from salvage logging through 2009, 2012). Further, in an attempt to reduce
increased forage production (Janz 2006), predation of an endangered caribou popula-
those benefits are not immediate and may tion, the local moose density was reduced
be offset by higher harvest and predation which lowered wolf abundance in a small
5POPULATIONS AND HARVEST OF MOOSE IN BC – KUZYK ALCES VOL. 52, 2016
Fig. 4. Regional moose population estimates and
declining trend lines in Regions 4, 5, and 7A
as derived from inventories, population mod-
eling, and expert opinion, 1987–2014, British
Columbia, Canada. Minimum and maximum
ranges in population estimates are presented
for 2000–2014.
portion of the region (~6,375 km2) (Serrouya
et al. 2011, Serrouya 2013).
Given stakeholder and public concern
Fig. 3. Regional moose population estimates for declining moose populations, it is import-
and trend lines in Regions 3, 6, 7B, and 8 as
ant to maintain a balanced, provincial-level
derived from inventories, population modeling
and expert opinion, 1987–2014, British Co-
assessment and approach that also addresses
lumbia, Canada. Minimum and maximum regions with stable or increasing populations.
ranges in population estimates are presented The large northwestern (Region 6) and north-
for 2000–2014. eastern (Region 7B) regions with stable
6ALCES VOL. 52, 2016 KUZYK – POPULATIONS AND HARVEST OF MOOSE IN BC
Fig. 5. Annual estimates of provincial moose harvest and hunter effort (average days hunted) by
licensed hunters, British Columbia, 1987–2014.
moose populations are more remote than recommended for northern systems where
those in the southern half of the province predation is believed to limit moose density
and have not undergone landscape change (e.g., Yukon; Hayes et al. 2003), and may be
that presumably facilitates hunter and preda- appropriate in northern regions of British
tor access. These regions also experienced Columbia (Hatter 1999).
little impact from the mountain pine beetle First Nations harvest of moose is thought
outbreak compared to the central interior to be broadly distributed province-wide (BC
regions (Region 5 and 7A). The one stable FLNRO 2015), but because no formal method
population in the south was largely affected exists to quantify First Nations harvest, the
by the mountain pine beetle and salvage total harvest and rates reported here are under-
logging, but had lower wolf density com- estimated and conservative. For example,
pared to northern regions (BC FLNRO local harvest may have been underestimated
2014, Kuzyk and Hatter 2014). The increas- by up to 40% in Ontario by not accounting
ing population in the southern region (Re- for First Nations harvest (Leblanc et al.
gion 8) overlapped with a recolonizing wolf 2011). Harvest information from First Nations
population (BC FLNRO 2014). Further, this in British Columbia would benefit future man-
regional estimate was revised in 2013 with agement efforts to ensure sustainable harvests
a habitat-based model (Gyug 2013) that for all users including First Nations, recre-
may have amplified the estimated increase ational hunters, and the guide-outfitting indus-
in abundance between 2011 and 2014. try (BC FLNRO 2015).
The average (6%) and range (4–8%) of An important outcome from this assess-
the provincial licensed harvest rate were ment was documentation of the gradual de-
mid-range of values reported throughout cline in licensed harvest by approximately
North America (2–16%; Crête 1987). More half over 28 years from 1987 to 2014, despite
conservative harvest rates of 5% are constant hunter effort, indicating that the kill
7POPULATIONS AND HARVEST OF MOOSE IN BC – KUZYK ALCES VOL. 52, 2016
Table 1. A summary of annual moose license sales and annual estimates of licensed hunters, hunter days,
and moose harvest in British Columbia, Canada, 1987–2014.
Year Licensed hunters Licensed hunter days Licensed harvest License sales
1987 42,526 338,482 13,463 N/A
1988 42,679 334,246 13,539 N/A
1989 41,979 332,852 14,070 51,520
1990 42,104 334,718 13,457 50,367
1991 39,400 304,852 12,251 46,010
1992 38,973 314,613 11,557 45,289
1993 33,236 252,647 10,025 38,538
1994 31,423 247,039 9944 37,714
1995 31,778 248,281 11,047 38,018
1996 30,923 245,617 9701 35,948
1997 32,085 251,582 10,494 37,243
1998 35,617 276,206 11,438 41,089
1999 29,840 250,287 7459 35,612
2000 31,106 255,569 9182 36,221
2001 30,988 272,771 10,290 36,145
2002 31,829 256,975 10,803 37,010
2003 31,493 238,983 11,309 36,608
2004 27,293 214,743 9571 40,438
2005 31,498 253,619 9980 37,175
2006 32,010 247,409 9939 38,374
2007 31,719 260,126 8000 38,069
2008 31,368 267,654 8730 37,125
2009 32,880 291,920 8074 40,371
2010 32,242 270,781 8836 39,733
2011 32,324 280,931 7660 40,503
2012 32,277 276,699 7576 40,236
2013 32,420 280,133 6890 40,109
2014 30,172 261,677 5773 39,723
Mean 33,721 ± 4292 273,622 ± 32,521 10,038 ± 2137 39,815 ± 4158
per unit of effort (kills/hunter days) had effort through increased opportunity to hunt
declined. The disparity between these two moose, without increasing harvest. Finally,
trends may be related to difficulties produ- although hunters maintained constant hunt-
cing accurate provincial population estimates ing effort as harvest declined, lower hunter
that are driven by wide regional variation. success often reflects inclement weather and
Further, changes in the hunting season struc- human disturbance that influence moose dis-
ture in the early 1990s reduced harvest levels tribution. Given the number, frequency, and
in some regions (Hatter 1999), and similarly, variable proportional influence of these fac-
a regulatory change allowing shared limited tors, kill per unit of effort is probably not a
entry hunts in the early 2000s raised hunter reliable measurement to assess moose
8ALCES VOL. 52, 2016 KUZYK – POPULATIONS AND HARVEST OF MOOSE IN BC
abundance in British Columbia (Hatter 2001). –––. 2015. Provincial Framework for Moose
Further research should help identify the rela- Management in British Columbia. Fish
tionships among moose abundance, harvest and Wildlife Branch, Victoria, British
rate, hunter effort, and landscape changes. Columbia, Canada.
It is important that regional and provincial BROWN, G. S. 2011. Patterns and causes of
moose abundance estimates and harvest data demographic variation in a harvested
moose population: evidence for the
be monitored and evaluated on a regular basis
effects of climate and density-dependent
to improve regional, provincial, and range- drivers. Journal of Animal Ecology 80:
wide status of moose. 1288–1298. doi: 10.1111/j.1365-2656.
2011.01875.x.
ACKNOWLEDGEMENTS CHAN-MCLEOD, A. C. A. 2006. A review and
I would like to thank B. Cadsand, D. synthesis of the effects of unsalvaged
Heard, S. MacIver, S. Marshall, C. Procter, mountain-pine-beetle-attacked stands on
P. Stent, C. Thiessen, M. Bridger, H. wildlife and implications for forest
Schwantje, and A.Walker for their comments management. British Columbia Journal
and discussions on early drafts of this paper of Ecosystems and Management 7:
and M. Klaczek for producing Fig. 1. Special 119–132.
thanks to I. Hatter who helped interpret re- CRÊTE, M. 1987. The impact of sport hunting
gional moose population estimates and pro- on North American moose. Swedish
vided useful revisions to a later version of Wildlife Research, Supplement 1:
this manuscript. I appreciate the useful input 553–563.
D’EON, R. G., S. F. WILSON, and D. HAMILTON.
from Associate Editor E. Bergman and two
2006. Ground-based inventory methods for
anonymous reviewers which improved this
ungulates: snow-track surveys. Standards
manuscript. for Components of British Columbia’s
Biodiversity No. 33a. Resource Informa-
REFERENCES
tion Standards Committee, British Col-
BALLARD, W., and V. VAN BALLENBERGHE. umbia Ministry of Environment, Victoria,
2007. Predator-prey relationships. Pages British Columbia, Canada.
247–274 in A. W. Franzmann and C. C. EASTMAN, D., and R. RITCEY. 1987. Moose
Schwartz, editors. Ecology and Manage- habitat relationships and management
ment of the North American Moose, 2nd in British Columbia. Swedish Wildlife
Edition. University Press of Colorado, Research Supplement 1: 101–117.
Boulder, Colorado, USA. GASAWAY, W. C., S. D. DUBOIS, D. J. REED,
BRITISH COLUMBIA MINISTRY of ENVIRON- and S. J. HARBO. 1986. Estimating moose
MENT (BC MOE). 2010. Moose Harvest population parameters from aerial surveys.
Management Procedure Manual. Fish Biological Papers of the University of
and Wildlife Branch, Victoria, British Alaska, Number 22, Institute of Arctic
Columbia, Canada. Biology.
BRITISH COLUMBIA MINISTRY of FORESTS, GRIFFITHS, F., and I. HATTER. 2011. Popula-
LANDS and NATURAL RESOURCE OPERA- tion Modelling for Big Game Stock
TIONS (BC FLNRO). 2014. Management Assessment: An Introductory Guide.
Plan for the Grey Wolf (Canis lupus) in British Columbia Ministry of Forests,
British Columbia. British Columbia Min- Lands and Natural Resource Operations,
istry of Forests, Lands and Natural Re- Victoria, British Columbia, Canada.
source Operations, Victoria, British GYUG, L. W. 2013. Okanagan Moose Inventory
Columbia, Canada. 2012–2013. British Columbia Ministry
9POPULATIONS AND HARVEST OF MOOSE IN BC – KUZYK ALCES VOL. 52, 2016
of Forests, Lands and Natural Resource Resource Operations, Victoria, British
Operations, Penticton, British Columbia, Columbia, Canada.
Canada. LEBLANC, J. E., B. E. MCLAREN, C. PEREIRA,
HATTER, I. W. 1999. An evaluation of moose M. BELL, and S. ATLOOKAN. 2011. First
harvest management in central and north- Nations moose hunt in Ontario: a commu-
ern British Columbia. Alces 35: 91–103. nity’s perspectives and reflections. Alces
–––. 2001. An assessment of catch per unit ef- 47: 163–174.
fort to estimate rate of change in deer and LENARZ, M. S., M. E. NELSON, M. W.
moose populations. Alces 37: 71–77. SCHRAGE, and A. J. EDWARDS. 2009.
HAYES, R. D., R. FARNELL, R. M. P. WARD, Temperature mediated moose survival
J. CAREY, M. DEHN, G. W. KUZYK, in northeastern Minnesota. Journal of
A. M. BAER, C. L. GARDNER, and M. Wildlife Management 73: 503–10. doi:
O’DONOGHUE. 2003. Experimental re- 10.2193/2008-265.
duction of wolves in the Yukon: ungulate MEIDINGER, D., and J. POJAR. 1991. Ecosys-
responses and management implications. tems of British Columbia. British Colum-
Wildlife Monographs 152: 1–35. bia Ministry of Forests, Special Report
HEARD, D. C., A. B. D. WALKER, J. B. Series Number 6. British Columbia
AYOTTE, and G. S. WATTS. 2008. Using Ministry of Forests, Victoria, British
GIS to modify a stratified random block Columbia, Canada.
survey design for moose. Alces 44: MURRAY, D. L., E. W. COX, W. B. BALLARD,
111–116. H. A. WHITLAW, M. S. LENARZ, T. W.
JANZ, D. W. 2006. Mountain Pine Beetle Epi- CUSTER, T. BARNETT, and T. K. FULLER.
2006. Pathogens, nutritional deficiency,
demic – Hunted and Trapped Species
and climate change influences on a
Sensitivity Analysis. British Columbia
declining moose population. Wildlife
Ministry of the Environment, Prince
Monographs 166: 1–30.
George, British Columbia, Canada.
–––, K. F. HUSSEY, L. A. FINNEGAN, S. J.
KUZYK, G. W., and I. W. HATTER. 2014. Using
LOWE, G. N. PRICE, J. BENSON, K. M.
ungulate biomass to estimate abundance
LOVELESS, K. R. MIDDEL, K. MILLS, D.
of wolves in British Columbia. Wildlife
POTTER, A. SILVER, M. J. FORTIN, B. R.
Society Bulletin 38: 878–883. doi: 10. PATTERSON, and P. J. WILSON. 2012.
1002/wsb.475. Assessment of the status and viability of
–––, and D. HEARD. 2014. Research design a population of moose (Alces alces) at
to determine factors affecting moose its southern range limit in Ontario. Can-
population change in British Columbia: adian Journal of Zoology 90: 422–434.
testing the landscape change hypothesis. doi: 10.1139/z2012-002.
Wildlife Bulletin No. B-126. British QUAYLE, J. F., A. G. MACHUTCHON, and D.
Columbia Ministry Forest, Lands and N. JURY. 2001. Modeling moose sight-
Natural Resource Operations. Victoria, ability in south-central British Columbia.
British Columbia, Canada. Alces 37: 43–54.
–––, S. MARSHALL, M. KLACZEK, and M. REMPEL, R. 2011. Effects of climate change
GILLINGHAM. 2015. Determining factors on moose populations: exploring the
affecting moose population change in response horizon through biome-
British Columbia: testing the landscape tric and systems models. Ecological
change hypothesis. Progress Report, Feb- Modelling 222: 3355–3365. doi: 10.1016/
ruary 2012–July 2015. Wildlife Working j.ecolmodel.2011.07.012.
Report No. WR-122. British Columbia –––, P. ELKIE, A. RODGERS, and M. GLUCK.
Ministry Forest, Lands and Natural 1997. Timber-management and natural
10ALCES VOL. 52, 2016 KUZYK – POPULATIONS AND HARVEST OF MOOSE IN BC
disturbance effects on moose habitat: population target for an overabundant
landscape evaluation. Journal of Wildlife ungulate for ecosystem restoration. Jour-
Management 61: 517–524. doi: 10.2307/ nal of Applied Ecology 48: 935–942.
3802610. doi: 10.1111/j.1365-2664.2011.01998.x.
RESOURCES INFORMATION STANDARDS SHACKLETON, D. 1999. Hoofed Mammals
COMMITTEE (RISC). 1998. Ground-based of British Columbia. Royal British Col-
inventory methods for selected ungulates: umbia Museum Handbook. University
moose, elk and deer. Standards for of British Columbia Press, Vancouver,
Components of British Columbia’s Bio- British Columbia, Canada.
diversity No. 33. Version 2.0. Ministry SPALDING, D. J., and J. LESOWSKI. 1971.
of Environment, Lands and Parks, Winter food of the cougar in south-
Resources Inventory Branch, Victoria, central British Columbia. Journal of
British Columbia. Wildlife Management 35: 378–381. doi:
–––. 2002. Aerial-based inventory methods 10.2307/3799618.
for selected ungulates: bison, mountain STENT, P. 2009. Management Unit 4-34
goat, mountain sheep, moose, elk, deer Moose Inventory. Ministry of Forests,
and caribou. Standards for Components Lands and Natural Resource Operations,
of British Columbia’s Biodiversity No. Nelson, British Columbia, Canada.
32. Version 2.0. British Columbia Minis- –––. 2012. Management Unit 4-03 Moose In-
try of Sustainable Resource Management, ventory. Ministry of Forests, Lands and
Victoria, British Columbia, Canada. Natural Resource Operations, Nelson,
RITCHIE, C. 2008. Management and chal- British Columbia, Canada.
lenges of the mountain pine beetle infest- TIMMERMAN, H. R., and M. E. BUSS. 2007.
ation in British Columbia. Alces 44: Population and harvest management.
127–135. Pages 559–615 in A. W. Franzmann and
SERROUYA, R. 2013. An adaptive approach C. C. Schwartz, editors. Ecology and
to endangered species recovery based Management of the North American
on a management experiment: reducing Moose, 2nd Edition. University Press of
moose to reduce apparent competition Colorado, Boulder, Colorado, USA.
with woodland caribou. PhD Thesis, Uni- WHITE, G. C., and B. C. LUBOW. 2002. Fit-
versity of Alberta, Edmonton, Alberta, ting population models to multiple
Canada. sources of observed data. Journal of
–––, B. N. MCLELLAN, S. BOUTIN, D. R. SEIP, Wildlife Management 66: 300–309. doi:
and S. E. NIELSEN. 2011. Developing a 10.2307/3803162.
11You can also read