Study on the Linear Vanishing Section Ratio of Earthen Sites and Anthropogenic Inuence from the Perspective of Population Density
←
→
Page content transcription
If your browser does not render page correctly, please read the page content below
Study on the Linear Vanishing Section Ratio of Earthen Sites and Anthropogenic In uence from the Perspective of Population Density Yumin Du ( duym@nwpu.edu.cn ) Northwestern Polytechnical University https://orcid.org/0000-0002-4871-9589 Wenwu Chen Lanzhou University Kai Cui Lanzhou University of Technology Wenqiang Dong Northwestern Polytechnical University Shuai Zhang Lanzhou University Qiyong Zhang Lanzhou University Research article Keywords: Earthen sites, Linear vanishing section ratio, Ming Great Wall, Population density, Anthropogenic in uence Posted Date: May 17th, 2021 DOI: https://doi.org/10.21203/rs.3.rs-524855/v1 License: This work is licensed under a Creative Commons Attribution 4.0 International License. Read Full License

Study on the Linear Vanishing Section Ratio of Earthen Sites and Anthropogenic

Influence from the Perspective of Population Density

Yumin Du1,2*, Wenwu Chen3, Kai Cui4, Wenqiang Dong1,2, Shuai Zhang3 and Qiyong

Zhang3

1
    Institute of Culture and Heritage, Northwestern Polytechnical University, Xi’an 710072, China;
2
 Key Scientific Research Base of the State Administration of Cultural Heritage for the Conservation and
Restoration of Murals and Material Science Research, Northwestern Polytechnical University, Xi’an
710072, China;
3
 Key Laboratory of Mechanics on Disaster and Environment in Western China, College of Civil
Engineering and Mechanics, Lanzhou University, Lanzhou 730000, China;
4
 Western Center for Disaster Mitigation in Civil Engineering of Ministry of Education of China, School
of Civil Engineering, Lanzhou University of Technology, Lanzhou 730050, China

*Corresponding author: Yumin Du

Institute of Culture and Heritage, Northwestern Polytechnical University, Xi’an 710072, China;

Email: duym@nwpu.edu.cn

Telephone number: +8602988460550

Fax number: +8602988460550

ORCID: 0000-0002-4871-9589

Acknowledgments

This work was supported by the funding from National Key R&D Plan Program of China [Grant No.
2020YFC1522201 and No. 2020YFC1521904], the cultural relics protection technology project of State
Administration of Cultural Heritage of the People’s Republic of China [Grant No. 2013-YB-SQ-120] and
the National Natural Science Foundation of China [Grant No. 41562015 and No. 52068050].
Study on the Linear Vanishing Section Ratio of Earthen Sites and Anthropogenic
Influence from the Perspective of Population Density

     Abstract: Having extremely high artistic, scientific and social values, earthen sites are widely distributed in China, which
     are important cultural relic resources of mankind. Due to accumulated natural erosions and human activities, however,
     earthen sites have been greatly damaged and have even vanished many sections, so that they are seriously threatened by
     extinction. In the circumstances, acquiring the conservation status of earthen sites is a vital prerequisite for the subsequent
     targeted protection. In this paper, as a world-renowned heritage site, the castles of the Ming Great Wall located in Qinghai
     Province were selected as the research object. A novel indicator namely the linear vanishing section ratio (L-VSR) was
     proposed and its value was classified as five levels to quantitatively characterize the specific conservation status of such
     sites. Based on the assessment results, the castles at the excellent status constituted the minimum proportion, while the
     castles at the very poor status represented the largest percentage, reflecting the grave situation of earthen sites. Furthermore,
     applying population distribution models into the linear fitting combined with the population density (PD), the positive
     correlation between PD and L-VSR was obtained to reveal the anthropogenic influence on the destruction of earthen sites.
     This study provides a new thought to quantitatively characterize the preservation conditions of earthen sites and also
     indicates the effect of human activities on the damage of earthen sites from the population perspective. Hence, it is beneficial
     to the overall damage assessment of earthen sites, and also meaningful to their further preservation and protective planning.
    Keywords: Earthen sites; Linear vanishing section ratio; Ming Great Wall; Population density; Anthropogenic influence

1. Introduction
     Earthen sites are a kind of typical architectural sites mainly built with soil materials, which are widely distributed in the
whole world, such as Ajina Tepa, Tajikistan [1], Alhambra, Spain [2], Casa Grande Ruins National Monument, the United
States [3], Çatalhöyük, Turkey [4], Great Wall [5] and Tulou, China [6]. Having extremely high artistic, scientific and social
values, earthen sites in China have a long historical process stretched from the Palaeolithic Age to modern times, reflecting the
evolution of Chinese civilization and the improvement of social productivity [7,8]. Undoubtedly, they are important cultural
relic resources of mankind. Exposed to long-term natural forces including wind and rain erosions and human activities, however,
earthen sites have developed many deteriorations such as sapping, cracks, scaling off, gullies, collapses, etc., severely
threatening their safe occurrence [5,9–12]. Under the circumstances, most earthen sites have been seriously damaged and even
have vanished many sections due to the development of deteriorations and natural/human influences in the past thousands of
years, so that they are greatly threatened by extinction. Consequently, taking targeted protection for earthen sites is very urgent,
and acquiring the conservation status of earthen sites starting from these vanishing sections is a vital prerequisite for the
protection work.
     So far, many scholars mainly focused on the mechanisms of deterioration development of earthen sites. Four deterioration
categories including property deterioration, structure damaging, structure collapse, and site destroying were summarized [10].
On the basis of field investigation and laboratory analysis, four main deterioration modes, namely wind-related deterioration,
water-related deterioration, temperature-related deterioration and chemical-related deterioration in Jiaohe ruins in China were
identified [12]. A model characterizing the deterioration at earthen sites of the Ming Great Wall in Qinghai Province was also
proposed to reveal the mechanisms and evolution of deterioration from a macro perspective [5]. Based on these deteriorations
development, the damage assessment of earthen sites was studied by means of multicriteria decision-making (MDCM) and
machine learning methods combined with environmental factors and building materials indices, which has revealed earthen
sites’ local damages caused by the development of deteriorations [9,13]. However, a scientific approach to assess the overall
damage of earthen sites was still lacked to quantitatively illustrate these sites’ conservation status. The effects of natural factors
on earthen sites such as wind, rain, earthquake, etc., have mostly been studied [11,14,15], but few researches focused on their
quantitative influence of human activities.

                                                                        1
In this paper, the authors selected 46 castles of the Ming Great Wall located in Qinghai Province, China as the research
object, and proposed a novel indicator, namely the linear vanishing section ratio (L-VSR) to characterize such sites’
conservation. Moreover, the anthropogenic influence on the L-VSR was researched from the perspective of population density
(PD). By applying population distribution models, PD was further correlated with L-VSR to show the effect of human activities
on the damage of earthen sites from the macroscopic perspective. As seen from the research results, it is potential to promote
the indicator and model proposed in this study into earthen sites and other architectural types of the Ming Great Wall. The
research findings have beneficial references to the overall damage assessment of earthen sites, and also meaningful to their
further preservation and protective planning.

2. Study Objects
     The Great Wall built in the Ming Dynasty, called the Ming Great Wall, was the most renowned military defensive project
in ancient China, which has been designated as a World Heritage in 1987 [16]. The Ming Great Wall is a complex military
network consists of walls, trenches, beacon towers, passes, castles, precipitous mountain areas, marine insurance, etc., and
these building types played their respective roles and cooperated with each other in the military defense phase [17]. In the
whole Great Wall system, the castle is a core element with multiple functions such as the exchange of military information,
goods and people, and the management of important civil affairs [18,19].
     Located independently from the Great Wall mainline in “nine towns”, the Ming Great Wall in Qinghai Province is a
significant section of the whole Great Wall, which was built from 1546 to 1596, surrounding Xining Wei with an arch shape
[17,20]. As the rammed earth is the dominant building material vulnerable to climate, the Ming Great Wall in Qinghai Province
has currently existed as a form of earthen sites exposed under environmental impacts for about 500 years [13,21]. Being a
significant part of the Ming Great Wall, there are 46 castles located in Qinghai Province (Fig. 1), which were selected as the
study object to research their conservation status. The information on these sites has been listed in Table 1. By collecting
archaeological materials of such sites, the linear circumference and remaining length of walls can be acquired. Then L-VSR
can be calculated to indicate the conservation status of castles.

Table 1
The information of castles of the Ming Great Wall in Qinghai Province
            Number                            Name                         Number                          Name
               1                  No.1 of Chengbeihou Castle                 24                      Xiamaquan Castle
               2                  No.2 of Chengbeihou Castle                 25                       Weiyuan Castle
               3                       Najiazhuang Castle                    26                       Miaogou Castle
               4                       Mengjiawan Castle                     27                         Xin Castle
               5                       Nianmugou Castle                      28                        Pingle Castle
               6                      Nianxiangou Castle                     29                          Gu Castle
               7                       Naozhuang Castle                      30                      Yangpotai Castle
               8                  No.1 of Simozhuang Castle                  31                   Shangxinzhuang Castle
               9                  No.2 of Simozhuang Castle                  32                      Boshiying Castle
               10                     Shangyamen Castle                      33                       Laoyou Castle
               11                       Lianxing Castle                      34                       Jiaerzang Castle
               12                          Qijia Castle                      35                      Xincheng Castle
               13                       Dieergou Castle                      36                     Yuanshaner Castle
               14                     Laoya Ancient Castle                   37                     Dongjiawan Castle
               15                    Nianbo Ancient Castle                   38                      Xujiazhai Castle
               16                    Yuanjiazhuang Castle                    39                       Tonghai Castle
               17                        Maying Castle                       40                       Songshu Castle
                                                                    2
18                   Beizhuang Ancient Castle                    41                    Gushan Ancient Castle
              19                         Shijia Castle                         42                         Baishen Castle
              20                         Xintian Castle                        43                       Zhongcun Castle
              21                         Baiya Castle                          44                       Zongzhai Castle
              22                      Datongyuan Castle                        45                          Xining Wei
              23                       Chenjiatai Castle                       46                    Guide Ancient Castle

                        Fig. 1. The distribution of castles of the Ming Great Wall in Qinghai Province.

3. Methods
     In this research, the authors mainly referred to archaeological materials from the Qinghai provincial administration of
cultural relics and the Qinghai Bureau of surveying and mapping to collect the plane graph of castles. Then the data castles’
circumference length (CL) and remaining length (RL) can be acquired from the measurement of plane graphs in Auto CAD.
The authors proposed a novel indicator called the linear vanishing section ratio (L-VSR) which indicates how many sections
of earthen sites in these castles have been vanished by the following calculation:
                                              L-VSR=1-(RL/CL)                                                                (1)
where RL/CL is the remaining length ratio (RLR) shown in Eq. (2):
                                                      RLR=RL/CL                                                              (2)
     The value of L-VSR can be classified as 5 levels to quantitatively characterize the specific conservation status of castles,
including excellent (E) (0-10%), good (G) (10%-25%), fair (F) (25%-50%), poor (P) (50%-75%), and very poor (VP) (75%-
100%). Because there has not been a uniform method of damage division for earthen sites so far, in this research the authors
mainly referred to the classification approach used for the rock quality designation (RQD) to provide a quantitative estimate of
rock mass quality from drill core logs [22].

                                                               3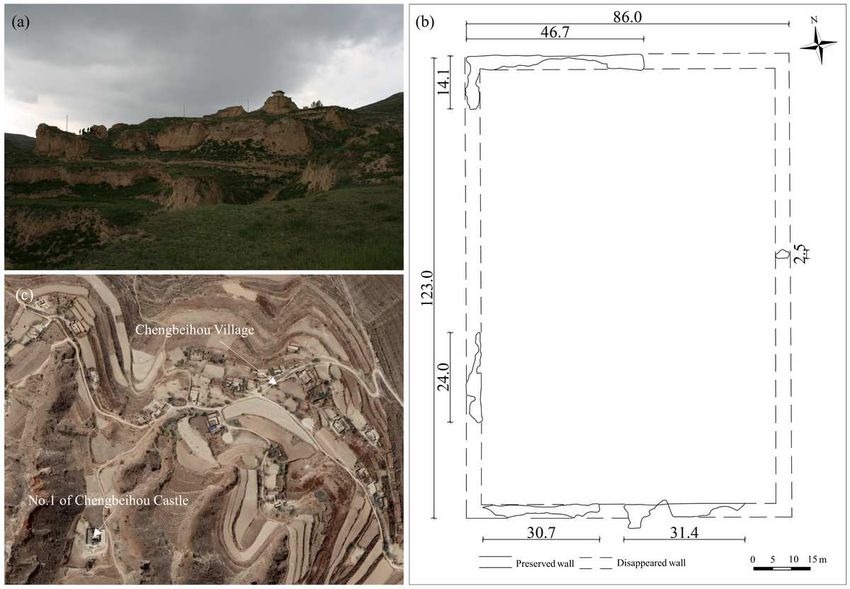
After that, the authors introduced the index of population density (PD) into this research. The PD indicates the number of
people living in each unit of area (such as a square kilometer), which is an important indicator to measure the distribution of
population in a region [23]. Its formula was shown in Eq. (3):
                                                      PD=PN/RA                                                          (3)
where PN is the number of population in a certain region, and RA is the area of that region.
     Finally, four frequently-used single core population distribution models were applied to achieve positive correlations
between PD and L-VSR, showing the influence of human activities on the conservation of earthen sites from a macroscopic
perspective.

4. Results and Discussion
4.1 Linear Vanishing Section Ratio (L-VSR)
     The authors firstly calculated the L-VSR value of the No.1 of Chengbeihou Castle by measuring its size on the plane graph
in Auto CAD. As shown in Fig. 2, with the side length of 123 m and 86 m, its CL and RL are 418 m and 149.4 m (the length
of the east wall, south wall, west wall and north wall are 2.5 m, 62.1 m, 38.1 m, and 46.7 m respectively). After that, on the
basis of Eq. (2) and Eq. (1), its RLR and L-VSR are 35.74% and 64.26%.

          Fig. 2. No.1 of Chengbeihou Castle: a front view, b plane graph, and c satellite image (from Google map).

     Using the same procedures and methods, all 46 castles’ L-VSR values were acquired. The data of RL and CL were
collected and then L-VSR data were calculated based on Eq. (1), and the conservation status was also given according to the
L-VSR values and classification levels, which were listed in Table 2.

Table 2
The length data and L-VSR of castles of the Ming Great Wall in Qinghai Province
                                                                 4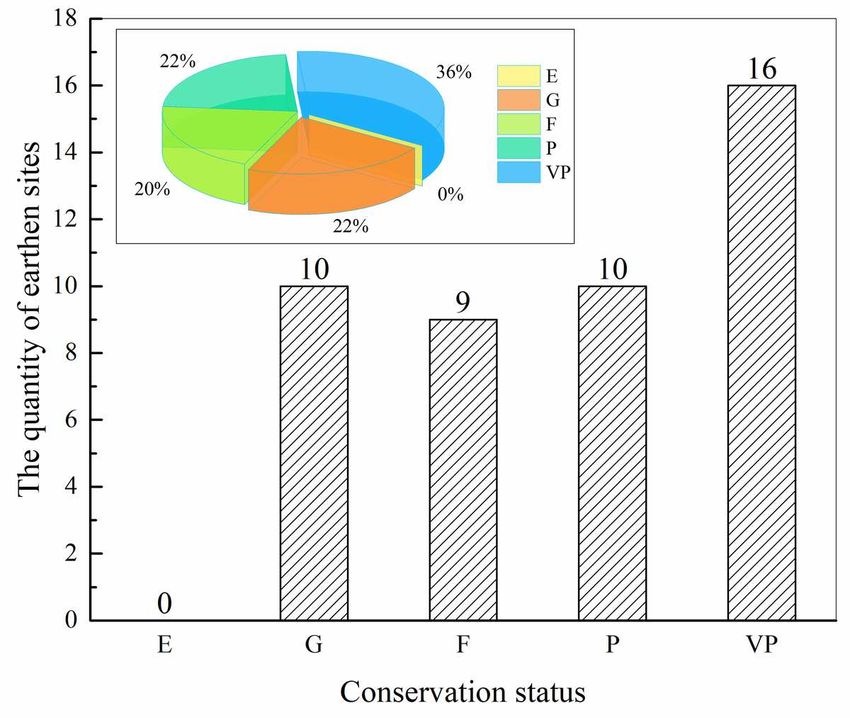
Remaining Length   Linear Vanishing
         Circumference Length   Remaining Length                                         Conservation
Number                                                  Ratio          Section Ratio
                (CL)                 (RL)                                                   Status
                                                        (RLR)             (L-VSR)
  1            418.00                149.40            35.74%             64.26%              P
  2             68.00                32.50             47.79%             52.21%              P
  3            400.00                305.80            76.45%             23.55%              G
  4             82.20                20.40             24.82%             75.18%             VP
  5             59.20                 0.00              0.00%            100.00%             VP
  6            294.00                235.00            79.93%             20.07%              G
  7            188.00                86.35             45.93%             54.07%              P
  8            134.00                18.00             13.43%             86.57%             VP
  9            108.00                69.90             64.72%             35.28%              F
  10           180.00                22.30             12.39%             87.61%             VP
  11           182.00                48.40             26.59%             73.41%              P
  12           220.00                 7.50              3.41%             96.59%             VP
  13           240.00                34.90             14.54%             85.46%             VP
  14           315.00                 9.93              3.15%             96.85%             VP
  15           1572.00               465.25            29.60%             70.40%              P
  16           542.00                114.00            21.03%             78.97%             VP
  17           287.20                241.60            84.12%             15.88%              G
  18           267.00                235.10            88.05%             11.95%              G
  19           340.00                245.50            72.21%             27.79%              F
  20           658.00                361.50            54.94%             45.06%              F
  21           297.00                247.10            83.20%             16.80%              G
  22           243.00                185.40            76.30%             23.70%              G
  23           245.00                81.80             33.39%             66.61%              P
  24           465.00                380.70            81.87%             18.13%              G
  25           799.00                396.50            49.62%             50.38%              P
  26           228.00                77.50             33.99%             66.01%              P
  27           724.00                157.80            21.80%             78.20%             VP
  28           166.00                102.30            61.63%             38.37%              F
  29           952.00                151.80            15.95%             84.05%             VP
  30            80.00                 3.10              3.88%             96.13%             VP
  31            66.00                 8.00             12.12%             87.88%             VP
  32           104.00                89.30             85.87%             14.13%              G
  33           446.00                229.00            51.35%             48.65%              F
  34           355.00                250.40            70.54%             29.46%              F
  35           752.00                659.20            87.66%             12.34%              G
  36           148.00                109.20            73.78%             26.22%              F
  37           324.00                232.60            71.79%             28.21%              F
  38           1320.00               126.70             9.60%             90.40%             VP
  39           1100.00                7.00              0.64%             99.36%             VP
  40           1093.00               470.67            43.06%             56.94%              P
  41           1006.00               572.50            56.91%             43.09%              F

                                                   5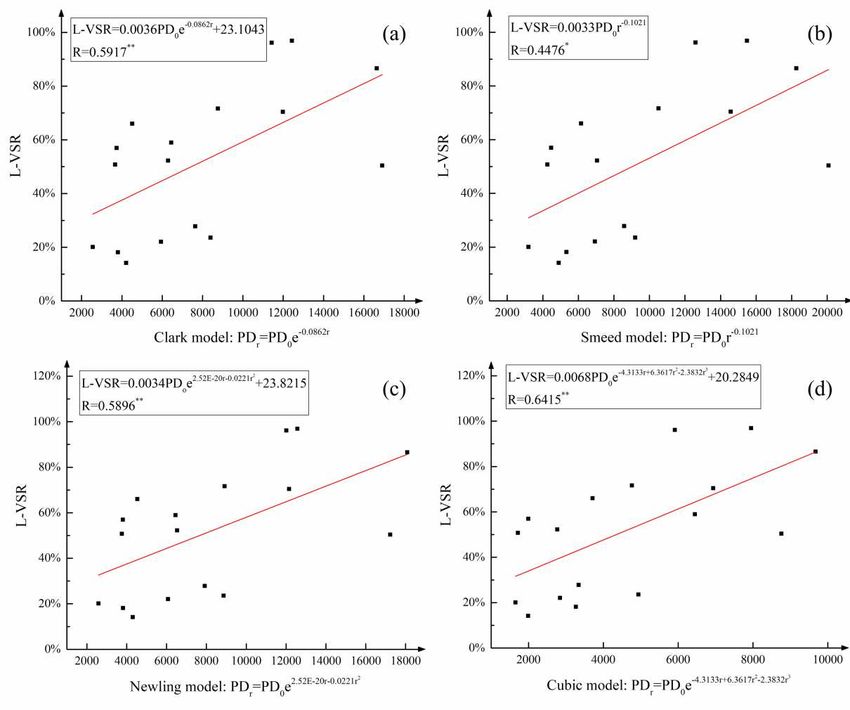
42               744.00                     280.00                  37.63%                  62.37%                    P
    43                   /                      22.00                       /                       /                     /
    44               744.00                     53.30                    7.16%                  92.84%                   VP
    45               4500.00                    296.70                   6.59%                  93.41%                   VP
    46               2040.00                   1531.60                  75.08%                  24.92%                   G
Note: the circumference length data of No. 43 castle cannot be obtained because it has been damaged very severely and from
historical documents, there were no related records about its size.

     From Table 2, castles’ conservation status can be acquired based on their L-VSR values and corresponding classification
ranges: there are no castles at the E status, 10 castles at the G status making up 22% of the total castles, 9 castles at the F status
accounting for 20%, 10 castles (22%) at the P status, and 16 castles (36%) at the VP status, respectively (Fig. 3). Hence, the
castles at the excellent status constituted the minimum proportion, while the castles at the very poor status represented the
largest percentage. There are more than half of the castles in the poor condition or even worse. These grading evaluation results
have reflected the grave situation of earthen sites.

                                  Fig. 3. The conservation status of castles in Qinghai Province

4.2 Population Density (PD)
     In this study, most castles are located in or nearby a certain village. The authors collected the number of residential
populations in these villages from archaeological materials provided by the Qinghai Bureau of Cultural Heritage, and measured
the living area of such villages via the software of Rivermap X3. Then the villages’ PD can be further calculated. The related
data were listed in Table 3.
      Combined with castles’ conservation status results acquired before, the authors averaged all PD data of villages where
the castles in each same damage level are located. As shown in Fig. 4, with the increment of overall damage level, the average
PD data steadily increased from 4860 number per km2 in the G status to 8679 number per km2 in the VP status. This means that
the conservation status of earthen sites would worsen as the surrounding population grows. Thus, the influence of human
activities on the conservation of earthen sites can be proved from the PD perspective.

Table 3
The population density of villages where the castles of the Ming Great Wall in Qinghai Province are located or nearby

                                                                  6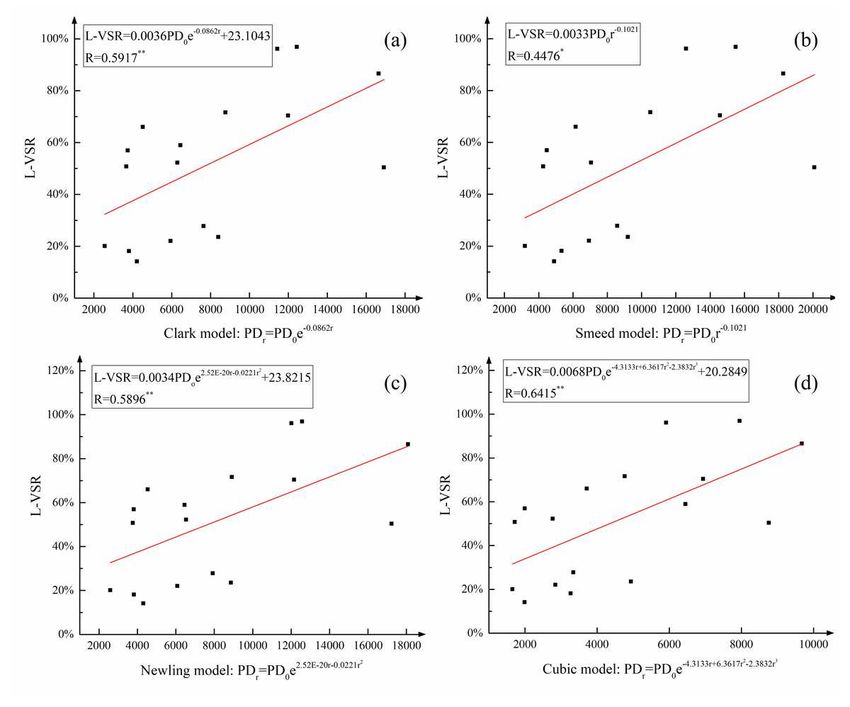
The number                                      The number of     The living area of the    Population density
                  The name of the village
 of castles                                     population (PN)     village (RA)/km  2
                                                                                           (PD)/number per km2
     1             Chengbeihou Village               350                 0.0532                   6575
     2             Chengbeihou Village               350                 0.0532                   6575
     3             Najiazhuang Village                   40              0.0044                   8999
     4             Mengjia Bay Village               500                 0.0701                   7129
     5                       /                           /                  /                       /
     6             Nianxiangou Village                   80              0.0309                   2588
     7              Naozhuang Village                800                 0.3494                   2290
     8             Simozhuang Village                700                 0.0363                  19295
     9             Simozhuang Village                700                 0.0363                  19295
    10             Shangyamen Village                1000                0.2127                   4702
    11               Lianxing Village                300                 0.0507                   5918
    12               Qijiabao Village                1000                0.1146                   8727
    13               DieergouVillage                 400                 0.0518                   7716
    14                Laoya Village                  2000                0.1590                  12579
    15                Dengjia Village                2000                0.1644                  12168
    16            Yuanjiazhuang Village              900                 0.0799                   11271
    17                Maying Village                 200                 0.0240                   8331
    18              Beizhuang Village                600                 0.1272                   4716
    19                 Shijia Village                1000                0.1255                   7966
    20              Xintianbao Village               700                 0.2015                   3474
    21                 Baiya Village                 700                 0.2609                   2683
    22              Datongyuan Village               2000                0.3099                   6454
    23              Chenjiatai Village               700                 0.1236                   5664
    24           Xiamaquan No.2 Village              1000                0.2619                   3819
    25               Gucheng Village                 1000                0.0580                  17250
    26              Xiamiaogou Village               500                 0.1102                   4538
    27               Xincheng Village                1386                0.1966                   7049
    28                Pingle Village                 500                 0.3005                   1664
    29               Gucheng Village                 500                 0.3180                   1573
    30               Yangpotai Village               795                 0.0655                  12147
    31           Shangxinzhuang Village              2534                0.6115                   4144
    32              Boshiying Village                1126                0.2607                   4319
    33        Eastern Village of Lushaer Town        2116                0.2989                   7079
    34               Jiaerzang Village               2070                0.7228                   2864
    35               Xincheng Village                1206                0.2734                   4412
    36              Yuanershan Village               2136                0.4322                   4942
    37             Dongjia Bay Village               1581                0.4102                   3854
    38               Xujiazhai Village               2109                0.4396                   4798
    39          Tonghai downtown Village             1903                0.5467                   3481
    40               Songshu Village                 500                 0.1311                   3815
    41                Gushan Village                 2000                0.7129                   2805
    42                 Baijia Village                1863                0.1191                  15641

                                                     7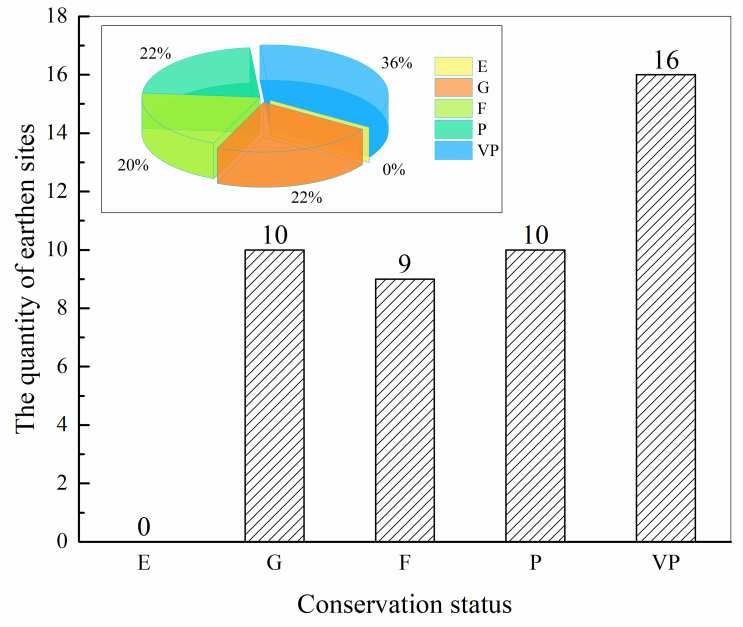
43                Pingan Village in town                   1300                    0.2099                     6194
       44                   Zongnan Village                       2000                    0.3065                     6525
       45             Urban district of Xining City              200000                  10.5000                     19048
       46                      Heyin Town                         22843                  10.0100                     2282
Note: There is no village close to the No. 5 castle so its related village population was not considered in this research.

                Fig. 4. The tendency graph between PD and conservation status of castles in Qinghai Province

4.3 The correlation between PD and L-VSR
     After acquiring the data of PD of villages and L-VSR of castles of the Ming Great Wall in Qinghai Province, the
correlation between PD and L-VSR was studied in order to further reveal the anthropogenic influence on the conservation of
earthen sites. In fact, many castles in this research are not located in villages but nearby those villages, so the population density
attenuation along with the distance between castles and villages should be considered. The four frequently-used single core
population distribution models were applied, including the models of Clark, Smeed, Newling, and Cubic [24–27], to calculate
the population density of castles with the attenuation of the PD of villages which have a certain distance from castles.
     The Clark model used a negative exponential function to indicate the relationship between PD and distance from the
residence center, shown in Eq. (4):
                                                              PDr=PD0e-br                                                         (4)
     The Smeed model’s formula is a power exponential function shown in Eq. (5):
                                                              PDr=PD0rb                                                           (5)
     The Newling model is a quadratic exponential model shown in Eq. (6):
                                                                               2
                                                             PDr =PD0 ebr+cr                                                      (6)
     The Cubic model is a cubic function from Eq. (7):
                                                                               2   3
                                                           PDr =PD0 ebr+cr +dr                                                (7)
where PDr is the population density of a place with the distance of r from the residence center, PD0 is the population density of
the residence center, and b, c and d are parameters. In this study, the authors simplified the village as a point and if a castle is
located in the village, their distance can be regarded as 0 m. Furthermore, the PDr is the assumed population density of castles
with the attenuation of the PD of villages, PD0 is the population density of villages, and r is the distance between the castle and
village.
     Combined with related archaeological materials and the software of Rivermap X3, we collected and measured the data of

                                                                  8
distances between castles and villages in which they are located or nearby, listed in Table 4. After that, it is assumed that there
is a linear positive correlation between PDr and L-VSR. During processing related data, the PD0 and L-VSR of castles which
have the same distance from villages where they are located have been calculated as the average value. Eventually, there are
17 groups of data to conduct the fitting, which have been shown in Table 5.
Table 4
The distance between villages and castles of the Ming Great Wall in Qinghai Province
The distance between The distance between
Number of Castles Number of Castles
castles and villages (r)/km castles and villages (r)/km
1 0.200 24 0.038
2 0.500 25 0.226
3 0.800 26 0.050
4 / 27 0.000
5 / 28 0.300
6 0.126 29 0.000
7 0.000 30 0.700
8 1.710 31 0.000
9 0.000 32 0.290
10 0.300 33 0.000
11 0.000 34 0.000
12 0.000 35 0.000
13 0.000 36 0.300
14 0.130 37 0.280
15 0.170 38 0.000
16 0.200 39 0.000
17 0.280 40 0.210
18 0.000 41 0.000
19 0.480 42 0.000
20 0.000 43 0.000
21 0.000 44 0.000
22 0.000 45 0.000
23 0.000 46 0.000
Note: The No. 4 castle is far away from the village and there is no village close to the No. 5 castle, so the distances between
such castles and villages were not considered in this research.
Table 5
The groups of fitting data in this research
Average villages population Average distance between Average Linear Loss Ratio
Number of groups
density (PD0)/number per km 2
castles and villages (r)/km (L-VSR)
1 6451 0.000 58.95%
2 3819 0.038 18.13%
3 4538 0.050 66.01%
4 2588 0.126 20.07%
5 12579 0.130 96.85%
96 12168 0.170 70.40%
7 8923 0.200 71.61%
8 3815 0.210 56.94%
9 17250 0.226 50.38%
10 6093 0.280 22.04%
11 4319 0.290 14.13%
12 3769 0.300 50.73%
13 7966 0.480 27.79%
14 6575 0.500 52.21%
15 12147 0.700 96.13%
16 8999 0.800 23.55%
17 19295 1.710 86.57%
Fig. 5. The correlation graphs between PDr and L-VSR: a Clark model, b Smeed model, c Newling model, and d Cubic
model. * and ** represent the values of significance at 90% and 95% levels by the student’s t-test, respectively.
To achieve optimal fitting effects, the optimization algorithm of Levenberg-Marquardt (LM) was used to determine the
parameters in Eqs (4)-(7). After that, PDr can be calculated and the correlation between PDr and L-VSR can be further
determined, as shown in Fig. 5. From the correlation results, the Cubic model has the largest correlation coefficient (R=0.6415),
compared to the other three models. Therefore, the positive correlation between PD and L-VSR can be proved, and the
anthropogenic influence on the conservation of earthen sites was revealed from a macroscopic perspective.
10In fact, human activities have very significant effects on the damage of earthen sites, and even artificial destruction in
historical and contemporary processes has been regarded as one of the deterioration types of earthen sites [8,10,12]. For instance,
local farmers directly dug soils from earthen sites (Fig. 6a), randomly added buildings along with earthen sites (Fig. 6b), and
even dwelt behind earthen sites so that the earthen wall has to be used as their home enclosures (Fig. 6c and Fig. 6d). Some
farming activities (Fig. 6e) and road engineering (Fig. 6f) also brought apparent influences on the earthen sites’ conservation.
However, to implement the Rules on the Great Wall Protection, the overall protective planning of the Ming Great Wall in
Qinghai Province has been conducted orderly, which would effectively restrict human destruction under the joint efforts of
government and individuals [28].
Fig. 6. The human activities graphs: a digging, b randomly building, c an enclosure in a peasant household, d an enclosure
in an urban housing estate, e farming activities, and f rail engineering.
In this research, the aforementioned four population distribution models have a common assumption with the single core
population distribution, meaning that the population density would generally decrease with the increment of distance from the
residential center. Therefore, if the castle is much closer to the village, its conservation could be more obviously affected by
more intense human activities, which has been proved from the fitting correlation results in Fig. 5. The flaw is that the
correlation coefficient is not very large. The reason is that the population number has fluctuated with time. Especially, the Ming
Great Wall has been built for about 500 years but the residential number in their locations each year is really hard to acquire.
However, the population number in this research is only collected from the archaeological materials in 2008 provided by the
Qinghai Bureau of Cultural Heritage. And the L-VSR data can also reflect the destruction status of castles in 2008 as the overall
survey of castles was carried out in that year. This means that a good corresponding relationship between PD and L-VSR has
been studied in this paper; Except for human influence, the damage of earthen sites is also closely related to the erosions of
wind and rain and the vulnerability of rammed earth materials [9,13]. But a positive tendency between PD and L-VSR can be
apparently seen from our research results, and correlation coefficients have passed the significant test, having statistical
significance. Therefore, the indicator and model proposed in this research have scientificity and accuracy. In our future research,
the models of L-VSR and PD will be further promoted and applied into other sections of the Ming Great Wall in NW China, to
acquire more scientific and precise assessment outcomes of the conservation status of earthen sites by constantly revising and
improving related parameters. What’s more, the volume reflection data including the remaining height and the top and bottom
width of earthen sites will be collected, and then the volume vanishing section ratio (V-VSR) can be further studied in the
future.
115. Conclusion
In this paper, 46 castles of the Ming Great Wall in Qinghai Province were chosen as research objects. The linear vanishing
section ratio (L-VSR) was proposed to characterize such earthen sites’ conservation status which can be divided into five levels
including excellent (E) (0-10%), good (G) (10%-25%), fair (F) (25%-50%), poor (P) (50%-75%), and very poor (VP) (75%-
100%). By means of plane graphs of these castles, the remaining length (RL) and circumference length (CL) of castles were
collected, and then L-VSR data were acquired.
Based on L-VSR values and corresponding classification ranges, there are 0 castles at the E status, 10 castles at the G
status making up 22% of the total castles, 9 castles at the F status accounting for 20%, 10 castles (22%) at the P status, and 16
castles (36%) at the VP status, respectively. Hence, the castles at the excellent status constituted the minimum proportion, while
the castles at the very poor status represented the largest percentage. There were more than half of the castles in the poor
condition or even worse. These grading evaluation results have reflected the grave situation of earthen sites.
Moreover, the population density (PD) of villages in which castles are located or nearby was obtained. Combined with
castles’ conservation status results, the average PD data increased with the increment of overall damage level, meaning that
the conservation status of earthen sites would worsen as the surrounding population grows.
By referring to four frequently-used single core population distribution models, namely the models of Clark, Smeed,
Newling, and Cubic, a linear positive correlation between the population density of a position where the castle is located (PDr)
and L-VSR was determined, and the Cubic model has the best fitting result.
According to our research findings, the novel indicator i.e., L-VSR is significant and applicable to characterize the
conservation status of earthen sites, and the anthropogenic influence on the damage of earthen sites has been revealed from a
macroscopic perspective. It is potential to promote the indicator and model proposed in this research into earthen sites and
other architectural types of the Ming Great Wall, to acquire more scientific and precise assessment results of their conservation
status by constantly revising and improving related parameters. Therefore, the research is beneficial to the overall conservation
assessment of earthen sites, and also meaningful to their further preservation and protective planning.
6. Abbreviations
L-VSR: linear vanishing section ratio PD: population density MDCM: multicriteria decision-making CL:
circumference length RL: remaining length RLR: remaining length ratio E: excellent G: good F: fair P: poor
VP: very poor RQD: rock quality designation PN: population number RA: region area V-VSR: volume vanishing
section ratio
7. Declarations
Authors’ contributions
Yumin Du and Wenwu Chen developed the methodology for this research. Kai Cui and Wenqiang Dong were responsible
for collecting the population and sites data. Shuai Zhang and Qiyong Zhang were responsible for the model calculation. This
manuscript was written by Yumin Du. Yumin Du also contributed to data analysis and processing. All authors read and approved
the final manuscript.
Authors details
1
Institute of Culture and Heritage, Northwestern Polytechnical University, Xi’an 710072, China;
2
Key Scientific Research Base of the State Administration of Cultural Heritage for the Conservation and Restoration of Murals
and Material Science Research, Northwestern Polytechnical University, Xi’an 710072, China;
3
Key Laboratory of Mechanics on Disaster and Environment in Western China, College of Civil Engineering and Mechanics,
Lanzhou University, Lanzhou 730000, China;
4
Western Center for Disaster Mitigation in Civil Engineering of Ministry of Education of China, School of Civil Engineering,
Lanzhou University of Technology, Lanzhou 730050, China
12Acknowledgements
This work was supported by the funding from National Key R&D Plan Program of China (Grant No. 2020YFC1522201
and No. 2020YFC1521904), the cultural relics protection technology project of State Administration of Cultural Heritage of
the People’s Republic of China (Grant No. 2013-YB-SQ-120) and the National Natural Science Foundation of China (Grant
No. 41562015 and No. 52068050).
Competing interests
The authors declare that they have no competing interests.
Availability of data and materials
The data that support the findings of this study are available from the corresponding author upon reasonable request.
Funding
This work was supported by the funding from National Key R&D Plan Program of China (Grant No. 2020YFC1522201
and No. 2020YFC1521904), the cultural relics protection technology project of State Administration of Cultural Heritage of
the People’s Republic of China (Grant No. 2013-YB-SQ-120) and the National Natural Science Foundation of China (Grant
No. 41562015 and No. 52068050).
References:
1. Fujii Y, Fodde E, Watanabe K, Murakami K. Digital photogrammetry for the documentation of structural damage in earthen
archaeological sites: The case of Ajina Tepa, Tajikistan. Eng Geol. 2009;105:124–33.
2. Elert K, Sebastián E, Valverde I, Rodriguez-Navarro C. Alkaline treatment of clay minerals from the Alhambra Formation:
Implications for the conservation of earthen architecture. Appl Clay Sci. 2008;39:122–32.
3. Matero F. Lessons from the Great House: Condition and treatment history as prologue to site conservation and management
at Casa Grande Ruins National Monument. Conserv Manag Archaeol Sites. 1999;3:205–24.
4. Lercari N. Monitoring earthen archaeological heritage using multi-temporal terrestrial laser scanning and surface change
detection. J Cult Herit. 2019;39:152–65.
5. Du Y, Chen W, Cui K, Gong S, Pu T, Fu X. A Model Characterizing deterioration at earthen sites of the Ming Great Wall in
Qinghai Province, China. Soil Mech Found Eng. 2017;53:426–34.
6. Luo Y, Yang M, Ni P, Peng X, Yuan X. Degradation of rammed earth under wind-driven rain: The case of Fujian Tulou,
China. Constr Build Mater. 2020;261:119989.
7. Pei QQ, Wang XD, Zhao LY, Zhang B, Guo QL. A sticky rice paste preparation method for reinforcing earthen heritage sites.
J Cult Herit. 2020;44:98-109.
8. Wang X, Li Z, Chen W, Zhang H, Guo Q, Sun M, Wang S, Zhang B. Research on key technologies for the protection of earth
sites. Beijing: Science Press; 2013.
9. Du Y, Chen W, Cui K, Zhang K. Study on damage assessment of earthen sites of the Ming Great Wall in Qinghai Province
based on Fuzzy-AHP and AHP-TOPSIS. Int J Archit Herit. 2020;14:903–16.
10. Li L, Shao M, Wang S, Li Z. Preservation of earthen heritage sites on the Silk Road, northwest China from the impact of
the environment. Environ Earth Sci. 2011;64:1625–39.
1311. Richards. J, Zhao G, Zhang H, Viles H. A controlled field experiment to investigate the deterioration of earthen heritage by
wind and rain. Herit Sci. 2019;7:1–13.
12. Shao M, Li L, Wang S, Wang E, Li Z. Deterioration mechanisms of building materials of Jiaohe ruins in China. J Cult Herit.
2013;14:38–44.
13. Du Y, Chen W, Cui K, Zhang J, Chen Z, Zhang Q. Damage assessment of earthen sites of the Ming Great Wall in Qinghai
Province: A comparison between Support Vector Machine (SVM) and BP Neural Network. J Comput Cult Herit. 2020;13:1-
18.
14. Porter DW, Mehrotra A, DeJong MJ, Bass A, Guebard M, Ochsendorf J. Material and seismic assessment of the Great
House at Casa Grande Ruins National Monument, Arizona. J Archit Eng. 2020;26:05019007.
15. Richards J, Viles H, Guo Q. The importance of wind as a driver of earthen heritage deterioration in dryland environments.
Geomorphology. 2020;369:107363.
16. Su MM, Wall G. Community participation in tourism at a World Heritage Site: Mutianyu Great Wall, Beijing, China. Int J
Tour Res. 2014;16:146–56.
17. Chen W, Du Y, Cui K, Fu X, Gong S. Architectural forms and distribution characteristics of beacon towers of the Ming
Great Wall in Qinghai Province. J Asian Archit Build Eng. 2017;16:503–10.
18. Cao Y, Zhang Y. The fractal structure of the Ming Great Wall Military Defense System: A revised horizon over the
relationship between the Great Wall and the military defense settlements. J Cult Herit. 2018;33:159–69.
19. Du Y, Chen W, Cui K, Guo Z, Wu G, Ren X. An exploration of the military defense system of the Ming Great Wall in
Qinghai Province from the perspective of castle-based military settlements. Archaeol Anthropol Sci. 2021;13:46.
20. Ren X. Resources’ investigation report of Ming Great Wall in Qinghai Province. Beijing: Cultural Relics Press; 2012.
21. Pu T, Chen W, Du Y, Li W, Su N. Snowfall-related deterioration behavior of the Ming Great Wall in the eastern Qinghai-
Tibet Plateau. Nat Hazards. 2016;84:1539–50.
22. Deere DU, Deere DW (1988) The rock quality designation (RQD) index in practice. In: Kirkaldie L, editor. ASTM-STP
984. Philadelphia: American Society for Testing and Materials, 1988. p. 91–101
23. Smailes PJ, Argent N, Griffin TLC. Rural population density: its impact on social and demographic aspects of rural
communities. J Rural Stud. 2002;18:385–404.
24. Clark C. Urban population densities. J R Stat Soc Ser A. 1951;114:490–6.
25. Smeed RJ. The effect of some kinds of routeing systems on the amount of traffic in the central areas of towns. J Inst Highw
Eng. 1963; 10:5-26
26. Newling BE. The spatial variation of urban population densities. Geogr Rev. 1969;59:242–52.
27. Frankena MW. A bias in estimating urban population density functions. J Urban Econ. 1978;5:35–45.
28. Wu Z, Wei Y. The widespread consultation of the overall protective planning of the Ming Great Wall in Qinghai Province.
14Gt Wall. 2016;53–4.
15Figures Figure 1 The distribution of castles of the Ming Great Wall in Qinghai Province.
Figure 2

No.1 of Chengbeihou Castle: a front view, b plane graph, and c satellite image (from Google map).
Figure 3

The conservation status of castles in Qinghai Province
Figure 4

The tendency graph between PD and conservation status of castles in Qinghai Province
Figure 5

The correlation graphs between PDr and L-VSR: a Clark model, b Smeed model, c Newling model, and d
Cubic model. * and ** represent the values of signi cance at 90% and 95% levels by the student’s t-test,
respectively.
Figure 6

The human activities graphs: a digging, b randomly building, c an enclosure in a peasant household, d an
enclosure in an urban housing estate, e farming activities, and f rail engineering.
You can also read