INDONESIA Food price update - March 2020 Focus: Effect of COVID-19 outbreak on food prices - WFP
←
→
Page content transcription
If your browser does not render page correctly, please read the page content below
©Photo by Artem Beliaikin from Pexels

 WFP/Josh Estey

 ver 2020.03.22

 INDONESIA
SAVING
 Food price update - March 2020
LIVES Focus: Effect of COVID-19 outbreak on food prices
CHANGING
LIVES
 Vulnerability Analysis and Mapping (VAM) - Indonesia Country Office. Contact: wfp.indonesia@wfp.org
Preface Contents
The Novel Coronavirus Disease (COVID-19) has been rapidly 1. Summary 2
evolving across the globe and categorized as a pandemic by the
 2. Food Price Trend in Indonesia following COVID-19 Outbreak
World Health Organization (WHO). Enormous number of cases in
China have impacted the country’s economic activities including a. 3-month-trend (December 2019 to February 2020): Effect of COVID-19
production and trade.
 Outbreak in China on Trade
This analysis was conducted in Indonesia in order to understand
the impact of COVID-19 on domestic prices of several strategic i. Background: Indonesia - China Trade in Agricultural Products 4
food commodities. The main output of this analysis is whether ii. Media updates: Disruption in Garlic Imports from China 5
there is a risk of significant changes in food prices as iii. National trend: ALPS analysis 6
consequence of the outbreak.
 iv. National trend: Monthly and daily trend 8
The analysis focused on 10 strategic commodities in Indonesia: v. Sub-national trend: Garlic prices across provinces 9
rice, chicken, beef, garlic, red onion, red chili, bird’s eye chili, egg,
 vi. Sub-national trend: Sugar prices across provinces 10
sugar, and vegetable oil at the national and sub-national levels. In
addition, the trend and price analysis of other commodities such vii. Sub-national trend: Garlic prices across districts 11
as ginger and curcuma are also presented. viii. Sub-national trend: Sugar prices across districts 12

The methods used in this analysis are limited to price indices for b. Trend following detected case of COVID-19 in Indonesia
the past 3 months and the first two weeks of March using a
 i. Media updates: Announcement of confirmed COVID-19 cases in
range of comparisons across different time points and regions. In
addition, a long-term time-series analysis is conducted to detect Indonesia and mass panic buying 13
abnormal price changes using WFP’s Alert for Price Spike (ALPS) ii. National trend: Daily national average 14
analysis. iii. Sub-national trend: Two province-level samples 15
The analysis used data primarily from official Government iv. Sub-national trend: Market-level trend of sugar 16
sources, with media updates to triangulate the analysis results. v. Sub-national trend: Soaring prices of perennial herbs 17

 3. Methodology 18

 4. Data and References 19
For more information, please contact Saidamon.Bodamaev@wfp.org 5. Annex 20

 2

Summary
 3-Month COVID-19 in Indonesia and
 COVID-2019 Trend Analysis Food Price Change
 Global Outlook (Dec 2019 - Feb 2020) (Mar 2020, Week I - II)
COVID-19 has spread rapidly over the past In Indonesia, garlic and sugar prices rose from Dec 2019 Following the report of confirmed COVID-19
two months. By 15 Mar 2020, there were to Feb 2020, while the remaining commodities showed cases in Indonesia on 2 Mar 2020, there was an
110,029 confirmed cases across the globe no significant price change. Compared to Dec 2019 level, obvious price movement for two commodities:
and over half of them (53%) were reported the average garlic price rose by +56.4% and sugar price sugar and red chili. However, the direction was
in mainland China. For outside China, Italy by +5.4% in Feb 2020. opposite: sugar prices were rising while prices
stands with the highest number of cases, for red chili dropped gradually. The remaining
followed by Iran and South Korea. At the provincial level, the largest price increase between commodities showed no significant price
 Dec 2019 and Feb 2020 for garlic occurred in Bali change.
In regards to the global food trade, (+89.5%), while for sugar it occurred in East Java (+9.3%).
COVID-19 has impacted multiple countries Out of the top 20 districts experiencing the greatest price The province level sample showed the same
from both the demand and supply side. As increase for both commodities, most were situated in trend. Week-on-week comparison showed that
the epicentre, China’s food distribution and Java and Bali. The primary cause of these increases had in Bali and DKI Jakarta, sugar experienced the
processing system was disrupted due to been reported to be delays in import. By mid-Mar prices largest price change. At the local level, the most
manpower shortages and transport for garlic have started to decrease across the country, significant increases occurred in Ps. Panorama,
restrictions. Given that China is a major food but sugar prices have still been increasing. Kota Bengkulu (+37.3%), Ps. Wonomulyo Kab.
producer globally, production and supply Polewali Mandar (+33.3%), and Ps. Peunayong,
chain issues in China have the potential to Rises in the prices of red chili, bird's eye chili, and red Kota Banda Aceh (+32.1%). Price hikes for
affect the rest of the world. onions were also observed during this period, but perennial herbs were observed primarily for red
 compared to their long-term trend, these changes were ginger and curcuma.
 less significant. WFP’s ALPS analysis yields the
 corresponding results by showing garlic and sugar prices
 at a crisis level in Feb 2020.

Conclusion
Overall analysis results suggest that until mid Mar 2020 there was no significant impact of the COVID-19 outbreak on the prices of 10 strategic food commodities
in Indonesia, except for garlic and sugar that was recorded in Feb 2020. Following the detection of COVID-19 cases in Indonesia, only sugar prices were observed
to rise in selected regions. However, a direct link to the outbreak could not be confirmed due to lack of available data. On the other hand, perennial herb prices
seem to have been more affected by the outbreak, particularly red ginger and curcuma, compared to prices of strategic food commodities. So far the impact of
the outbreak on food security seems to have been limited, however care must be taken to ensure sufficient food stocks are available within the country in a
timely manner to avoid price spikes for food commodities that are currently primarily sourced from imports.
 3
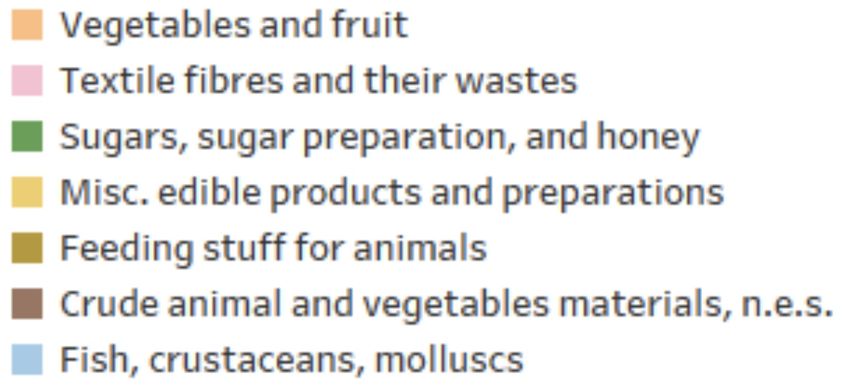
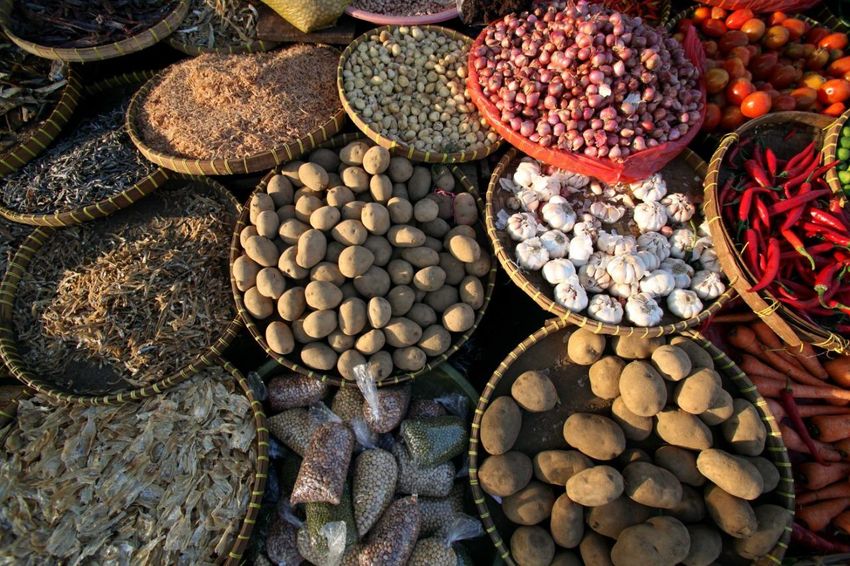
3-month-trend (December 2019 to February 2020): Effect of COVID-19 Outbreak in China on Trade

 Background: Indonesia - China Trade in Agricultural Products
 Value of Agricultural Products imported from China (2018), by Product Group
 In 2018, China was the fourth largest exporter of agricultural
 products to Indonesia in terms of trade value (USD 1.9
 billion), and eighth largest in terms of trade volume (1.9
 million tons). Horticultural products are the bulk of
 Indonesia’s agricultural imports from China, with garlic,
 leeks, and other alliaceous vegetables alone contributing
 roughly one-fifth (22.6%) of the total value of agricultural
 imports from China.

 Indonesia’s domestic garlic consumption is roughly 500
 thousand tons annually. Although domestic production has
 almost quintupled between 2014 and 2019, from 16,892 tons
 to 81,000 tons, it was only sufficient to meet 15.4% of
 domestic demand, and thus the gap had to be filled by
 imports. In 2018 and 2019, 99.6% and 100% of Indonesia’s
 garlic imports originated from China, respectively. Between
 2018 and 2019, however, Indonesia’s overall garlic imports

 Product Groups
 decreased by 20.1%. In Dec 2019 and Jan 2020, Indonesia
 imported 106,894 tons and 1,508 tons of garlic from China,
 respectively.

 Top 10 Exporters of Agricultural Products to Indonesia (2018)

 Indonesia Garlic Production, Imports, and Consumption Volume of Garlic Imports from China
 (2014-2019) (Jan 2019 - Jan 2020)

Data Source: World Integrated Trade Solutions (WITS) database; Note: Consumption data for 2017 - 2019 uses
Statistics Indonesia; Ministry of Agriculture projected figures from Ministry of Agriculture 4
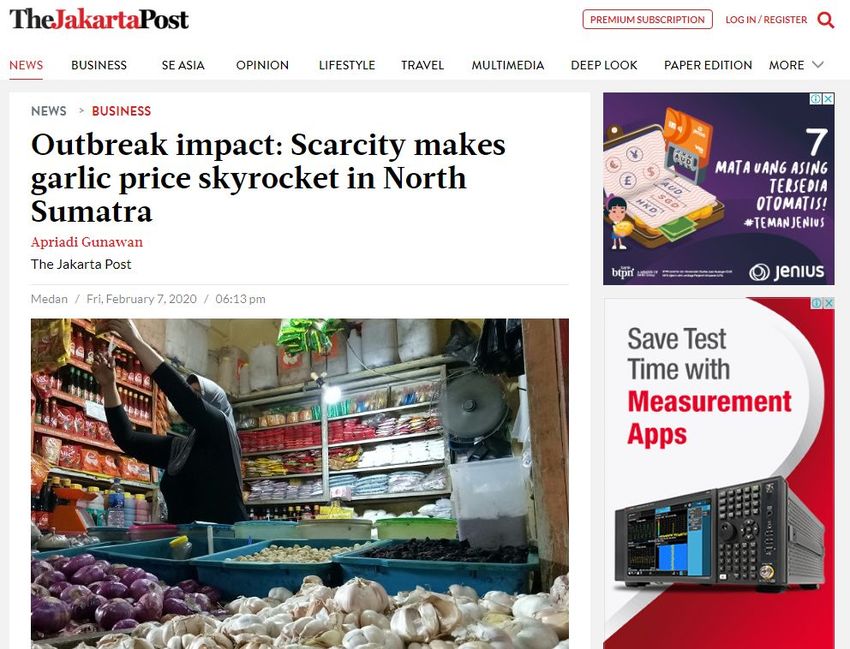
3-month-trend: Effect of COVID-19 Outbreak in China on Trade

Media updates: Disruption in Garlic Imports from China

Main points:
Garlic prices in Indonesia have risen in the first two weeks of Feb 2020 and contributed to monthly inflation9. As mentioned in the preceding section,
China is the main source of Indonesia’s garlic imports and according to media reports, the COVID-19 outbreak may have caused garlic prices to soar
through several pathways: first, labour shortages and logistical problems1,3, coupled with increasing demand within China itself have caused the
domestic price of garlic in China to rise3; second, initial concerns that imported garlic from China may be contaminated with the virus have led
Indonesian distributors to refrain from releasing their garlic stocks to the market and the Government to delay the import decision until the safety was
confirmed10. Consequently, supply shortages in the market coupled with rising concerns regarding the diminishing stock within the country have
triggered the soaring garlic price in many regions of Indonesia11,12.

On 7 Feb 2020, the Ministry of Agriculture (MoA) issued a recommendation to import 103,000 tons of garlic, and as of 6 Mar 2020, the Ministry of Trade
permitted import of 34,825 tons of garlic13. Media reports indicate that imported garlic has been entering the markets since early Mar 202014. Several
news sources have also reported that garlic prices in the US market have ascended due to supply disruptions from China1.

 5
3-month-trend: Effect of COVID-19 outbreak in China on trade

National trend: ALPS analysis
The Alert for Price Spikes (ALPS) indicator detects an abnormally high level of food prices. It enables identification of which commodities and markets are
experiencing abnormal price levels and the severity and persistence of such price abnormalities. The ALPS indicator was developed for basic commodities
in Indonesia using historical market data for the monthly national averages from Jul 2016 to Feb 2020.
ALPS was used to detect whether an abnormal price level of several strategic commodities existed during the COVID-19 outbreak: Jan and Feb 2020.
However, due to price data for some commodities not fulfilling the prerequisite of this analysis, the analysis was carried out for 6 commodities only: rice,
garlic, red onion, bird’s eye chili, red chili, sugar and vegetable oil*.

 Crisis level detected during
 COVID-19 outbreak (Jan-Feb 2020)

 Crisis level detected during
 COVID-19 outbreak (Feb 2020)

 6
3-month-trend: Effect of COVID-19 outbreak in China on trade

National trend: ALPS analysis

 During the COVID-19 outbreak, garlic prices in Indonesia rose significantly
 in Feb 2020, while a big increase in sugar price was observed in Jan-Feb
 2020. It is the first time garlic prices were detected at such high rates in
 over 3 years. The so far highest garlic price was recorded in May 2017 at
 IDR 53,500/kg or roughly 6 percent above the Feb 2020 level. The crisis
 level was detected due to an extreme deviation from the linear prediction
 of the long-term trend*.

 Rice and bird’s eye chili show no price alerts, while onion and vegetable oil
 were found at an alert level, and red chili was found only at stress level.
 Nationally, so far there has been no crisis price level detected in those
 commodities during the COVID-19 outbreak, except for garlic and sugar.

Note (*):
 ● Definitions of “crises”, “alert” and “stress level” described in the Methodology section (Page 18)
 ● Commodities that were excluded from the analysis: beef, chicken and egg.

Data Source: Center for Information of Strategic Food Prices (PIHPS) 7

3-month-trend: Effect of COVID-19 outbreak in China on trade

 National trend: Daily and monthly trend
Following China’s report to the World Health Organization (WHO) regarding pneumonia cases on 31 Dec 2019, there was a steady increase in the price of red chili, bird’s eye
chili and garlic. The price of garlic rose sharply on 3 Feb 2020 by roughly +26% from 31 Jan 2020 level, three days after the WHO declared the COVID-19 outbreak as a Public
Health Emergency of International Concern. On 7 Feb 2020, the Ministry of Agriculture issued a recommendation for garlic import. Garlic prices reached a peak on 11 Feb
2020 at +74.6% from the baseline level. On 13 Feb 2020, the Ministry of Trade announced the pending release of import permit for garlic, after which the garlic price slowly
declined. Nationally, the monthly garlic price rose from Dec 2019 to Feb 2020 by +56.4%. It jumped from IDR 32,250/kg in Dec 2019 to IDR 50,450/kg in Feb 2020.
Sugar prices started to increase in late 2019 and prices began to further climb in early 2020. The monthly sugar price rose from IDR 13,850/kg in Dec 2019 to IDR 14,600/kg
in Feb 2020, which corresponds to a change of +5.4%. Although the price change is observed to be relatively lower than garlic, the price level in Jan-Feb 2020 is still
considered high compared to its long-term trend (see slide 6-7 on ALPS analysis). The Feb 2020 price is +16.8% higher than the ceiling price set by the GoI (IDR 12,500/kg)
and sugar prices were observed to continue to increase throughout the first half of Mar 2020. Increases in the national average price of garlic and sugar, are presented in
the below daily price chart.

The prices of red and bird’s eye chili also increased, however, compared to garlic and sugar, the deviation from their long-term trend was not as drastic, as chili prices are
typically volatile. For other food commodities, no significant increase was recorded.

Daily Price Trend (Up to March 13th 2020) Baseline = Price on December 1st 2019 Monthly Price Trend (IDR/Kg):

 Garlic Sugar

 8
3-month-trend: Effect of COVID-19 outbreak in China on trade

Sub-national trend: Garlic prices across provinces

Province-level Comparison Top 5 Provinces Top 5 Provinces
Price Change [Dec 2019 to Feb 2020] vs Price Level Price Change (%): Dec 2019 to Feb 2020 The Highest Price: Feb 2020 (IDR/Kg)

 National Average Price Change National Average Price Level

 In Feb 2020, DKI Jakarta was the most expensive province to purchase garlic, followed by West
 Papua, East Nusa Tenggara, North Maluku and Maluku. Prices in DKI Jakarta (IDR 62,745/kg) had
 been 1.4 times higher than prices in East Java, which reported the lowest prices in Feb 2020 (IDR
 44,243/kg). However, considering the price change from Dec 2019 to Feb 2020, Bali experienced the
 highest percentage change across Indonesia at +89.5%, followed by East Java and Central Java.
 The scatter plot indicates that provinces experiencing higher levels of change in percentage terms
 between Dec 2019 to Feb 2020 are not necessarily the ones observing the highest price levels in Feb
 2020. For instance, Bali and East Java were the two provinces experiencing the highest price change,
 +89.5% and +76.2% respectively. However, prices in these two provinces were actually lower than
 the national average, with East Java actually reporting the lowest price levels in Feb 2020.
 Conversely, West Papua experienced the second lowest price change in percentage terms, but garlic
 prices within the province had been the second highest nationally.
 It is also interesting to note, that several provinces experiencing the highest price change such as
 East Java, Central Java, and West Nusa Tenggara were among the 10 largest producers of garlic in
 Indonesia in terms of production and harvested area*.
Data Source:
Center for Information of Strategic Food Price (PIHPS) | *Ministry of Agriculture (Kementerian Pertanian-RI) 9

3-month-trend: Effect of COVID-19 outbreak in China on trade

Sub-national trend: Sugar prices across provinces

Province-level Comparison Top 5 Provinces Top 5 Provinces
Price Change [Dec 2019 to Feb 2020] vs Price Level Price Change (%): Dec 2019 to Feb 2020 The Highest Price: Feb 2020 (IDR/Kg)

 National Average Price Change National Average Price Level

 The province with the highest sugar price in Feb 2020 was Papua, followed by West Papua, Maluku,
 Southeast Sulawesi and West Nusa Tenggara. The price in Papua (IDR 16,550/kg) were 1.4 times
 higher than prices in Riau Island, which reported the lowest prices in Feb 2020 (IDR 12,155/kg). This
 finding suggests that the eastern region of Indonesia observed the highest sugar prices. However,
 considering the price change from Dec 2019 to Feb 2020, East Java experienced the highest
 percentage change across Indonesia at +9.3%, followed by Riau, East Java, West Nusa Tenggara
 and South Sumatera. However, there was a province that experienced a decrease in price, namely
 Riau Island. Compared to Dec 2019, It dropped about -1.6% in Feb 2020.
 The scatter plot demonstrates a similar situation with garlic. Provinces experiencing higher levels
 of change in percentage terms between Dec 2019 to Feb 2020 are not necessarily the ones
 observing the highest price levels in Feb 2020. For instance, East Java and Riau were the two
 provinces experiencing the highest price change, +9.3% and +9.2% respectively. However, prices in
 these two provinces were actually lower than the national average, with Riau Island actually
 reporting the lowest price levels in Feb 2020. Conversely, Papua and West Papua experienced the
 price change below the national average in percentage terms, but sugar prices within the province
Data Source: had been the second highest nationally.
Center for Information of Strategic Food Price (PIHPS) 10
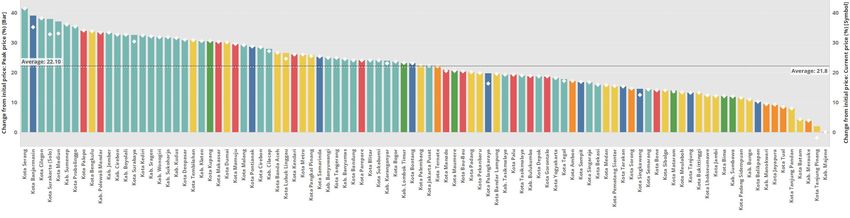
3-month-trend: Effect of COVID-19 outbreak in China on trade

 Sub-national trend: Garlic prices across districts
 In Feb 2020, garlic prices rose throughout Indonesia with varying magnitudes across
 regions: Eastern Indonesia experienced the least change in percentage terms.
 Between Jan and Feb 2020, the price of garlic at the district level rose between
 +15.7% in Kab. Manokwari, West Papua and +78.2% in Kab. Polewali Mandar, West
 Sulawesi. Compared to last year, however, prices in Feb are between +29.6% (Kab.
 Merauke, Papua) and +197.2% (Kab. Polewali Mandar, West Sulawesi) higher. Even
 when accounting for seasonality and 3-year-averages, the Dec 2019 to Feb 2020
 average garlic prices were considerably higher. Out of 93 recorded districts, 5
 districts experienced an increase between 0% and +5% (5.4% of districts), 68
 experienced an increase between +5% and +10% (73.1% of districts), and 20
 experienced an increase greater than +10% (21.5% of districts). Kota Lhokseumawe
 in Aceh experienced the greatest increase (+34.6%), followed by Kota Blitar in East
 Java (+30.0%) and Kab. Polewali Mandar in West Sulawesi (+27.9%).

 The peak of the price increase occurred during the first two weeks of Feb 2020.
 During this period, districts experienced higher prices between +29.0% (Kab.
 Merauke, Papua) and +144.9% (Kab. Sumenep, East Java) compared to prices on 1
 Dec 2019. Out of the top 20 districts experiencing the greatest price increase, 17
 were situated in Java and Bali. By mid-Mar 2020, prices have started to go down
 across the country following the issuance of garlic import recommendations by MoA. Note: Initial price is defined as price on 1 Dec 2019. Peak price is the maximum price for each
 district reached between 1 Dec 2019 and 13 Mar 2020. Current price is price on 13 Mar 2020.

 Price Change from Initial Price to Peak and Current Price (%)

Data Source: Center for Information of Strategic Food Price (PIHPS) 11
3-month-trend: Effect of COVID-19 outbreak in China on trade

 Sub-national trend: Sugar prices across districts
 Sugar prices also experienced increases across Indonesia with districts in Java
 generally recording higher changes in percentage terms. A few districts, however,
 reported decreases in sugar prices. Between Jan and Feb 2020, the change in sugar
 prices ranged from -3.3% in Kota Tanjung Pinang, Riau Islands to +7.9% in Kota
 Sampit, Central Kalimantan. Compared to Feb 2019, however, prices in Feb 2020
 differed by -7.0% (Kab. Majene, West Sulawesi) to +31.0% (Kota Tembilahan, Riau).
 When compared to 3-year-averages, the 3-month-average sugar prices (Dec 2019 to
 Feb 2020) are slightly higher for most districts, although a third of the districts
 reported lower prices than average. Out of 93 recorded districts, 33 districts
 reported negative price changes (35.5% of districts), 58 districts experienced an
 increase between 0% and +5% (62.4% of districts), and 2 districts experienced an
 increase between +5% and +10% (2.2% of districts). Kab. Lombok Timur in West Nusa
 Tenggara experienced the greatest increase (+5.5%), while Kota Batam in Riau
 Islands experienced the greatest decrease (-4.0%).

 The peak of the price increase, however, occurred in March 2020*, where districts
 experienced price changes between +0% (Kab. Majene, West Sulawesi) and +41.4%
 (Kota Serang, Banten) compared to prices on 1 Dec 2019. Of the 20 districts
 experiencing the greatest increase, 16 were in Java and Bali. Prices on the latest
 available date (13 Mar 2020) were peak prices for the majority of districts, indicating
 Note: Initial price is defined as price on 1 Dec 2019. Peak price is the maximum price for each
 that sugar prices are still likely to increase further in these districts.
 district reached between 1 Dec 2019 and 13 Mar 2020. Current price is price on 13 Mar 2020.

 Price Change from Initial Price to Peak and Current Price (%)

 *Monthly price data for Mar 2020 is not yet available for use in the monthly price comparison. Only daily price data for Mar 12
Data Source: Center for Information of Strategic Food Price (PIHPS) 2020 is available at the time of analysis.
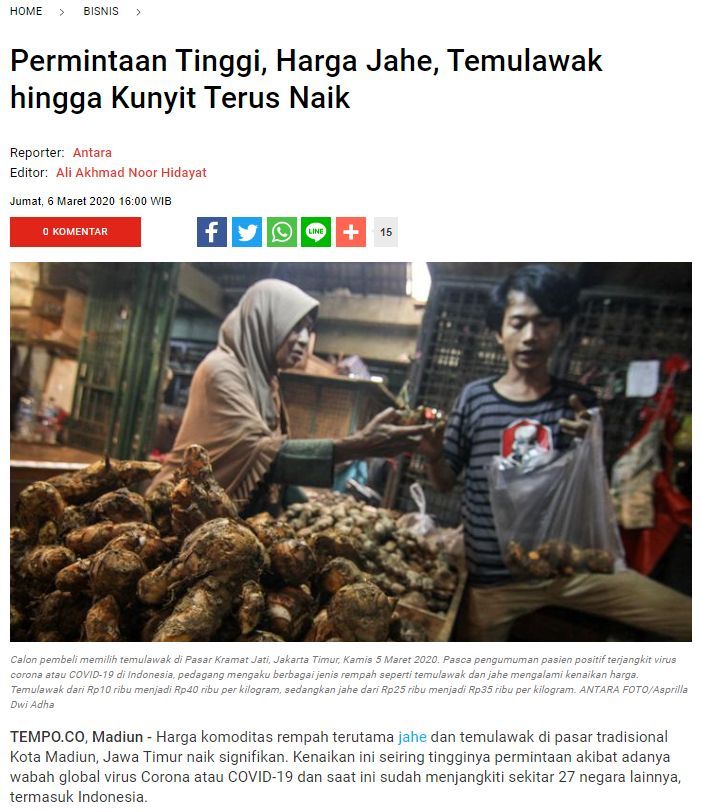
Trend following detected case of COVID-19 in Indonesia

Media updates: Announcement of confirmed COVID-19 in Indonesia and mass panic buying

Main points:

On 2 Mar 2020, the first two confirmed COVID-19 cases in Indonesia were announced by the Central Government15. This triggered a wave of panic buying
by consumers for main food items and medical supplies, particularly in the Jabodetabek (Jakarta, Bogor, Depok, Tangerang, Bekasi) metropolitan area.
According to the Association of Retail Businesses (ASPRINDO), a 10-15% increase in retail store visitors occurred following the announcement16,17. Main
food items being bought were staples, instant noodles, canned goods and other long-lasting foods. News reports indicated that panic buying occurred in
6 cities including Jakarta, Surabaya, Semarang, and Denpasar, but were limited to certain supermarkets within the city and were short-lived 18. After one
week, the phenomenon seemed to have receded. No significant price increases were found for staples, in alignment with our findings in the following
section, except for sugar, the price of which rose due to delays in import administration. The price for yellow onions had also been reported to rise due
to similar reasons19,20,21.

On the other hand, the prices of perennial herbs, such as ginger, curcuma, and turmeric have been reported to soar due to a sudden demand shock
stemming from the perception among local communities that these herbs may boost the immune system and thus offer some protection towards the
virus22,23. Increased prices were reported to occur primarily in Jabodetabek and Java, but also reported in Bali, North Sumatera, West Kalimantan, and
South Sulawesi24,25,26,27. No significant price changes were reported in Aceh, West Sumatera, and North Maluku28,29,30. No reports were found for other
regions in Indonesia.
 13
Trend following detected case of COVID-19 in Indonesia

National trend: Daily national average
Following the first report of COVID-19 case in Indonesia on 2 Mar 2020, there was an obvious national average price movement of two commodities namely sugar and red
chili. However, the direction was opposite: the sugar price was rising while the red chili price dropped gradually. In the second week of Mar 2020, both of them recorded
changes of more than 10 percent from the baseline level. Sugar price reached a peak on 11 Mar 2020 at +12% while red chili reached the lowest level on 13 Mar 2020 at
-11.46% . The remaining commodities fluctuated at relatively low percentages (change < 5%).

Week-on-Week comparison was carried out to see how far the price is changing in the week after the first reported case (Week I of Mar) in Indonesia compared to the
previous week (Week IV of Feb). Only sugar experienced an increase of nearly +4%, continuing increases already observed in Jan-Feb 2020. Most commodities
experienced a decrease in price instead of an increase. However, after a week, in Week II of Mar, several other commodities started showing an increase compared to the
first week. For sugar itself, the price change reached nearly +7% compared to Week I of Mar. This indicates that the price increase was higher between Week I to Week II
of Mar rather than between Week IV of Feb to Week I of Mar.

Daily Price Trend Week-on-Week Change (%) Week-on-Week Change (%)
Baseline: Price on 2 Mar 2020 Before vs After Reported Cases in Indonesia Week I vs Week II of Mar 2020

 14
Trend following detected case of COVID-19 in Indonesia

Sub-national trend: Two province-level samples
 Week-on-Week Change (%): Feb 2020, Week IV - Mar 2020, Week I
 DKI Jakarta Bali

Compared to Week IV of Feb 2020, prices of 5 commodities in DKI Jakarta Slightly different from DKI Jakarta, Bali Province had 6 commodities (red
in Week I of Mar 2020 decreased: bird’s eye chili, red chili, garlic, chicken chili, red onion, chicken, garlic, vegetable oil and beef) experiencing a
and egg, while the price of 3 others namely rice, red onion and sugar decrease in price. The remaining commodities recorded a rise in price with
increased. The price of beef and vegetable oil were recorded with no sugar experiencing the highest increase (+3.6%), followed by bird’s eye chili,
change, while the price change of sugar was recorded to be above the egg and rice. Bird’s eye chili price decreased in DKI Jakarta, while it
national average (+6.2%), making it the commodity with the highest increased in Bali. And red onion prices increased in DKI Jakarta but
increase. Red chili recorded the highest decrease (-13.4%), followed by decreased in Bali.
red onion (+2.9%).

According to the sample above, both DKI Jakarta and Bali experienced relatively low price changes for the 10 strategic food commodities. The above
charts also demonstrate that around half of the commodities experienced a price decrease following the report of a confirmed COVID-19 case in
Indonesia on 2 Mar 2020. No link between the two could be established.
 15
Trend following detected case of COVID-19 in Indonesia

Sub-national trend: Market-level trend for sugar
Price Increase of Sugar in Traditional Markets Following Confirmed COVID-19
Cases in Indonesia - 17 Feb 2020 to 13 Mar 2020
 Top 5 Markets with Highest Price Change
 17 Feb 2020 to 13 Mar 2020

 Note: Price change is calculated by comparing prices two weeks preceding the first
 COVID-19 case announcement in Indonesia (17 Feb) and two weeks after (13 Mar).
Note: Price change is calculated with respect to the price observed in each market two weeks
preceding (17 Feb) the announcement of the first COVID-19 case in Indonesia (2 Mar) to observe the
 to be merely driven by panic buying as the five markets reporting the
trend. Weekends are shaded in gray.
 highest price increase are situated in areas not reporting high incidences of
In the first week of Mar 2020, the price of sugar began to rise in several panic buying. Media reports indicate that the price hikes were likely a
traditional markets across Indonesia, coinciding with the detection of two consequence of delays in issuing import recommendations which had led to
initial COVID-19 cases in the country. The most significant increases diminishing stocks and rising market concerns regarding the uncertainty of
occurred in Pasar Panorama, Kota Bengkulu (+37.3%); Pasar Wonomulyo, future supplies. The Government of Indonesia had waited to issue import
Kab. Polewali Mandar (+33.3%); Pasar Peunayong, Kota Banda Aceh recommendations until WHO confirmed that plant-based agricultural goods
(+32.1%); Pasar Pagar Dewa, Kota Bengkulu (+30.8%); and Pasar Kelapa, were not vectors of the COVID-19 virus19,20,21.
Cilegon (+29.8%). However, not all regions seem to be affected by this
price hike as the average increase across the country is lower at +11.4%. At the end of Feb 2020, MoA issued recommendations to import sugar31.
 According to MoT, the imported sugar should start entering domestic
Given limited available data, it is not possible to establish a link between markets in Week III of Mar32. In 2019, Indonesia had sourced the bulk of its
the COVID-19 outbreak and price changes, however it is unlikely for them sugar imports (86.5%) from Thailand (BPS, 2019).

Data Source: Center for Information of Strategic Food Price (PIHPS) 16
Trend following detected case of COVID-19 in Indonesia

Sub-national trend: Soaring prices of perennial herbs
Price Increase of Red Ginger and Curcuma Following Confirmation of COVID-19 Cases in Indonesia: Mar 2020, Week I - Week II

Note: Price data for ginger and curcuma are not collected regularly by government agencies, thus information regarding price changes for these herbs are compiled from various news articles. Dates of each
report are displayed in brackets (d/m). Sources are listed in the Annex.

Media reports indicated that the prices of various perennial herbs began to Markets in DKI Jakarta reported price increases ranging from +60% to
soar in several parts of Indonesia, particularly Java, due to increased demand +150% for red ginger, with new price levels ranging from IDR 80,000/kg
following the announcement of confirmed COVID-19 cases in Indonesia. The to IDR 100,000/kg. Prices for curcuma in DKI Jakarta also doubled from
price hikes were observed primarily for red ginger and curcuma, but the IDR 20,000/kg to IDR 40,000 in Ps. Jatinegara (E. Jakarta) and Ps. Senen
prices of other herbs such as other types of ginger, turmeric, cinnamon, (C. Jakarta), and quintupled from IDR 10,000 to IDR 50,000 in Ps. Kwitang
lemongrass, galangal, and lesser galangal have also increased, albeit less (C. Jakarta). Similar trends have been observed in other parts of Java,
dramatically (see Annex). Although herbs and spices are widely used as Bali, West Kalimantan, and North Sumatera, albeit the reported range of
traditional medicine and for cooking, they only comprise 2.9% of household price increases outside Java is lower: between +33% to +60%. Some
food expenditure (SUSENAS 2018) and thus the impact of such increases on areas reported no significant price increase, including Aceh, West
food security is likely to be limited. Sumatera, and North Maluku28,29,30.
 17
Methodology
Method (continued)

Analysis of price indices. The percentage changes of these quarterly price indices The calculation of the indicator follows four steps:
indicate the extent to which recent price changes can be considered normal or abnormal ● Estimation of the seasonal price trend
as compared to the relevant reference period (i.e. the previous quarter, the preceding ● Calculation of the difference between market price and estimated price
year, or the baseline period) (World Food Programme, 2014): ● Calculation of the ALPS indicator considering price volatility
 ● Calculation of the different thresholds of the indicator
● “Monthly change from previous month” or “Month-on-Month change” is calculated as a
 percentage change of the latest available monthly nominal price from the previous The monthly average price of the respective food commodities at national level were
 month. “Monthly change from last year” or “Year-on-Year change” is calculated as a obtained from Bank Indonesia. The data were analysed using the calculation formula
 percentage change of the latest available monthly nominal price of the quarter from based on WFP’s Technical Guidance Note on ALPS.
 the same month in the previous year.
 There were only 7 out of 9 commodities analysed for ALPS. A few commodities - egg, beef
● “Week-on-Week change” is calculated as a percentage change of the latest available
 and chicken - were not taken into ALPS analysis due to non-stationary time-series data
 weekly nominal price from the previous week.
 based on Augmented Dickey-Fuller Test for Data Stationary. When the p-value of the null
● “Change from last quarter” is calculated as a percentage change of quarterly averaged hypothesis is statistically significant (p-value < 0.05), the time series is considered
 nominal prices from the previous quarter. non-stationary. It is one of the procedures of ALPS analysis; the data should be stationary,
 otherwise the analysis could probably be biased.
● “Seasonally adjusted quarterly change” is calculated as a percentage change of
 quarterly averaged real prices from the previous quarter. Real prices are calculated by
 The below table shows the threshold, range of value and interpretation of the respective
 dividing each monthly nominal price by its corresponding baseline average price 1
 colour:
 (a.k.a. long-term seasonal averages). Prices normally vary throughout a year due to
 seasonal patterns of the production cycle. Accounting for seasonality helps
 differentiating between normal seasonal price variations and additional changes which
 can be considered abnormal, depending on the magnitude of those changes.
● “Quarterly change from last year” is calculated as a percentage change of the quarterly
 averaged nominal prices. “Quarterly price change from baseline” is calculated as the
 quarterly average of the three relevant months’ percentage changes from their
 corresponding baseline average prices1. This estimate indicates whether there is a
 structural shift of the current price from its long-term seasonal pattern.
Food price volatility. This is a measure of how much the price of a particular food
commodity fluctuates over a time period and is calculated by taking the standard deviation
of daily price percentage change within a reference period. The daily price volatility can be A market is considered to be in a crisis phase at a given time (t) if the gap between the
converted to monthly, quarterly, and annual volatility as necessary. High price volatility observed price and the trend value ̂ is greater than two standard deviations of
increases uncertainty and thus may increase vulnerability to food insecurity. the error terms.

The Alert for Price Spikes (ALPS) is based on a trend analysis of monthly price data. The
idea behind the indicator is to compare the long-term seasonal trend of a commodity’s
price series at each market with the last observed price on the same market. The
assumption is that the estimated trend reflects the dynamics of the price series beyond
the spikes and abnormal levels, something which - in other words - can be defined as the
“normal” pattern of the price series.

(continued)
1
 The baseline period corresponds to a moving period average covering
the previous 3 years of the same month or quarter. 18
Data and References
Data Source
Food price
 Trade
 ➔ National Strategic Food Price Information Centre - PIHPSN. Bank Indonesia.
 ➔ World Integrated Trade Solution (WITS)
 http://hargapangan.id
 https://wits.worldbank.org/WITS/WITS/Restricted/Login.aspx
Food production
 ➔ FAOSTAT ➔ Statistics Indonesia (BPS)
 http://www.fao.org/faostat/en/#home https://www.bps.go.id/publication/2020/03/02/da68c35deba981fd4a49e908/bulet
 ➔ Ministry of Agriculture in-statistik-perdagangan-luar-negeri-impor-desember-2019.html
 https://www.pertanian.go.id/home/?show=page&act=view&id=61 https://www.bps.go.id/all_newtemplate.php
Consumption
 COVID-19 update
 ➔ Ministry of Agriculture
 ➔ World Health Organization (WHO)
 http://epublikasi.pertanian.go.id/arsip-outlook/537-outlook-tphorti-2017
 https://experience.arcgis.com/experience/685d0ace521648f8a5beeeee1b9125cd
 ➔ Statistics Indonesia
 https://www.bps.go.id/statictable/2014/12/18/966/rata-rata-pengeluaran-per-kapi
 ta-sebulan-menurut-kelompok-barang-rupiah-2013-2018.html

Sources for Slide 17
 ➔ https://republika.co.id/berita/q6z55c3018000/harga-jahe-di-purwakarta-melonjak-100-dampa
 ➔ https://republika.co.id/berita/q6rxwx414/harga-jahe-merah-melonjak-hin
 k-corona
 gga-rp-100-ribu-per-kg
 ➔ https://www.ayobandung.com/read/2020/03/10/82081/populer-karena-corona-harga-jahe-di-i
 ➔ https://bisnis.tempo.co/read/1316329/permintaan-tinggi-harga-jahe-tem
 ndramayu-capai-rp50000
 ulawak-hingga-kunyit-terus-naik/full&view=ok
 ➔ https://rmoljabar.id/heboh-covid-19-harga-jahe-merah-di-kabupaten-bandung-meroket/
 ➔ https://www.merdeka.com/uang/dipercaya-bisa-tangkal-virus-corona-har
 ➔ https://www.liputan6.com/regional/read/4196242/diburu-masyarakat-karena-corona-harga-re
 ga-jahe-di-garut-naik-10-kali-lipat.html
 mpah-rempah-di-medan-melonjak
 ➔ https://bisnis.tempo.co/read/1318663/imbas-corona-harga-jahe-melonja
 ➔ https://news.detik.com/berita-jawa-timur/d-4929980/ramai-virus-corona-harga-jahe-merah-di
 k-tembus-rp-90-ribu-per-kilogram/full&view=ok
 -ponorogo-rp-60-ribukg
 ➔ https://radarbali.jawapos.com/read/2020/03/09/182880/dampak-corona-
 ➔ https://www.liputan6.com/bisnis/read/4198067/melambung-hingga-rp-100-ribu-per-kilo-jahe-
 harga-jahe-merah-di-denpasar-melambung-tinggi
 merah-tetap-diburu-warga
 ➔ https://www.tagar.id/bisa-tangkal-corona-harga-jahe-di-makassar-naik
 ➔ https://www.liputan6.com/bisnis/read/4199288/minat-warga-berkurang-harga-jahe-cs-berang
 ➔ https://www.tribunnews.com/metropolitan/2020/03/11/harga-jahe-mera
 sur-turun
 h-di-pasar-ciracas-naik-di-tengah-kekhawatiran-virus-corona
 ➔ https://www.liputan6.com/regional/read/4193866/imbas-corona-harga-rempah-rempah-di-pa
 ➔ https://www.merdeka.com/uang/harga-jahe-merah-di-salatiga-naik-capai
 sar-nguter-naik-hingga-2-kali-lipat
 -rp-50000-per-kg.html
 ➔ https://regional.kompas.com/read/2020/03/09/05300771/wabah-virus-corona-harga-jahe-mer
 ➔ https://sukabumiupdate.com/detail/sukabumi/ekonomi-dan-bisnis/6578
 ah-di-tasikmalaya-naik-400-persen?page=all
 3-Corona-Efek-Rempah-rempah-di-Pasar-Cicurug-Sukabumi-Laris-Manis
 ➔ https://tagar.id/imbas-corona-harga-jahe-di-gowa-melonjak
 ➔ https://banten.idntimes.com/news/banten/khaerul-anwar-2/harga-jahe-
 ➔ https://www.goriau.com/berita/baca/disebut-bisa-cegah-corona-harga-jahe-merah-dan-kunyit
 merah-kunyit-dan-temulawak-melambung-di-kota-serang/full
 -kini-lebih-mahal-dari-ayam-potong.html
 19
Annex
Sub-National Trend: Soaring Prices of Herbs (Additional Charts)

Note: Price data for ginger and curcuma are not collected regularly by government agencies, thus information regarding price changes for these herbs are compiled from various news articles. Dates of each report
are displayed in brackets (d/m).

 20
You can also read