VARIABILITY AND TRENDS OF PRECIPITATION ON LOW- AND HIGH-ALTITUDE STATIONS IN SERBIA
←
→
Page content transcription
If your browser does not render page correctly, please read the page content below
Researches Reviews of the Department of Geography, Tourism and Hotel Management
                                            50–1/2021
Original scientific article

       VARIABILITY AND TRENDS OF PRECIPITATION
        ON LOW- AND HIGH-ALTITUDE STATIONS
                      IN SERBIA
                                  Igor LeščešenA, Dragan MiloševićA, Rastislav StojsavljevićB
                                       Received: February 2, 2021 | Accepted: June 28, 2021
                                                  DOI: 10.5937/ZbDght2101014L

          ABSTRACT: For the trend analysis of theannual, seasonal and monthly precipitation linear regression and
          Mann–Kendall (MK) tests at the 5% significance level were applied. In this study, precipitation data from two
          stations in Serbia for the 1949–2019 period were used. Results indicate that increasing trends of precipitation
          for the selected station can be observed but these trends were not statistically significant according to MK test.
          Then again, MK test has shown that only on Palić station during autumn precipitations have statistically signifi-
          cant increase during the observed period with a p value of 0.0441 at the significant level p=0.005.
          Keywords: Precipitation; trend; Serbia; Vlasina; Palić

                                                   INTRODUCTION

     Current climate change has caused the study of many precipitation characteristics, such as precipitation
amounts (Dai et al., 1997; New et al., 2001; Smith et al., 2012; Becker et al., 2013;Hynčica et al., 2019), precip-
itation extremes (Frich et al., 2002; Allan, Soden, 2008; van den Besselaar et al., 2013; Villarini et al., 2013;
O’Gorman, 2015) and precipitation intensity (e.g., Brunetti et al., 2000; Maraun et al., 2008; Berg et al., 2013;
Cioffi et al., 2015; Ye et al., 2016).
     Nguyen et al. (2018) observed a global increasing trend in precipitation. However, there are regional varia-
tions that do not follow global trends (Gocić, Trajković, 2013). During the 20thcentury, precipitation decreased
over southern parts of Europe, Africa and Asia (Spinoni et al., 2017). Over some regions, mainly North Africa,
north Italy and some parts of Iberian Peninsula anincreasing trend of precipitation is observed (Philandras,
2011; Brunnetti et al., 2001). Annual and monthly precipitation patterns over the East and Central Europe
was examined by Niedźwiedź et al. (2009). Regarding other parts of the European continent, annual rainfall
shows that every decade since 1960 an increasing trend of 70 mm is observedover Northern and Western Eu-
rope. In contrast, over Southern Europe a decrease of 90 mm per decade has been observed (European Envi-
ronment Agency [EEA], 2017).
     Several studies from different countries on Balkan Peninsula has considered precipitationsas an indicator
of climate change, e.g. Montenegro (Burić et al., 2018a; Burić et al., 2018b; Burić, Doderović, 2019), Bosnia and
A
    Climatological and Hydrological Research Center, University of Novi Sad, Serbia; corresponding author,
    e-mail: igorlescesen@yahoo.com
B
    Department of Geography, Tourism and Hotel Management, Faculty of Sciences, University of Novi Sad, Serbia

                                                                                  Researches Review DGTH | 50–1, 14–23 | 2021 | 14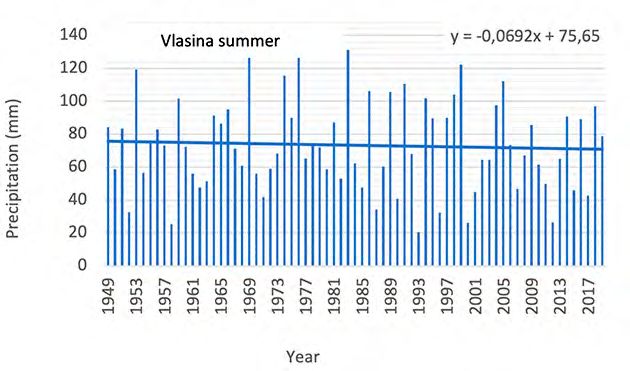
Herzegovina (Popov et al., 2019), Slovenia (Tošić et al., 2016; Milošević et al., 2016) Croatia (Gajić-Čapka et al.,
2015), Greece (Markonis et al., 2017), and Bulgaria (Alexandrov et al., 2004; Nikolova, 2004; Radeva, Nikolo-
va, 2020). Precipitation variability and trends were the subject of many studies worldwide (Oguntunde et al.,
2011; Tabari, Hosseinzadeh Talaee, 2011; Libanda et al., 2017;Kingúza, Tilwebwa, 2019; Ghaedi, Shojaiean,
2020) as well as in Serbia. For instance, Tosic (2004) investigated spatial and temporal variability of summer
and winter precipitation for the period of 50 years at 30 stations. Milovanović (2005) analyzed precipitation
over Stara planina mountain in southeast part of Serbia. Several authors investigated precipitation variabili-
ty and trends in Belgrade (Tosic and Unkasevic, 2005; Djordjevic, 2008), while Savić et al. (2020) investigated
the precipitation variability in Novi Sad. Furthermore, Unkasevic and Tosic (2011) examined the daily precip-
itation over Serbia for the 1949–2007 period. Milošević and Savić (2013) investigated precipitation changes in
the Pannonian and Peripannonian parts of Serbia, as well as the effects of changes in precipitation and tem-
perature on the crop yield variability in the Autonomous Province of Vojvodina (Milošević et al., 2015). Pre-
cipitation trends over Serbia show only weak and mostly nonsignificant trends according to the results pre-
sented by Luković et al. (2013). Milentijević et al. (2020) analyzed precipitation trends in Mačva district.
     This study examines the precipitation amounts and trends registeredon two meteorological stations with
substantially different altitudes: Palić (102 m) and Vlasina (1254 m). Analyzed period covers 71 years from
1949 to 2019, which is the longest available dataset. Precipitation trends per seasons were also analyzed. With
this study, the aim is to contribute to the increased understanding of precipitation variability on different low
and high altitudeareas in Serbia.

                                                   STUDY AREA
     The study area is located in Serbia that occupies the central part of the Balkan Peninsula. The area of Ser-
bia is 88.499 km2. Central and southern regions of the country are made up ofmountains and highlands, while
in the north vast and mainly flat Pannonian plain is located. Climate of the country is characterized as tem-
perate continental climate with four seasons (Gocić, Trajković, 2013).The geographical information of the in-
vestigated stations is listed in Table 1. Selection criteria for these stations were as follows: (1) good quality da-
tasets; (2) availability and reliability of the data; (3) the data should have sufficientrecord length; and (4) each
station has to be located near a major lake.

Table 1. Geographical information about investigated stations
Meteorological station                Latitude (φ)                 Longitude (λ)                 Altitude (m)
Palić                                   46о 06’N                     19о 46’E                        102
Vlasina                                 42о 45’N                     22о 20’ E                       1254

                                    DATA AND METHODOLOGY
    This study analyzes monthly and annual precipitation sums for two stations in the period 1949-2019. Data
from two meteorological stationswere taken from the Republic Hydrometeorological Service of Serbia (http://
www.hidmet.gov.rs/).
    Precipitation trends were processed using two statistical approaches as suggested by Gavrilov et al., 2016;
Milentijević et al., 2020) the trend equation was determined for each station and the statistical significance of
trend was analyzed byapplying a non-parametric Mann-Kendall (MK) test.The trend equation procedure is
based on determining the slope size of the precipitation data in the trend equation. Three scenarios are proba-

                                                                       Researches Review DGTH | 50–1, 14–23 | 2021 | 15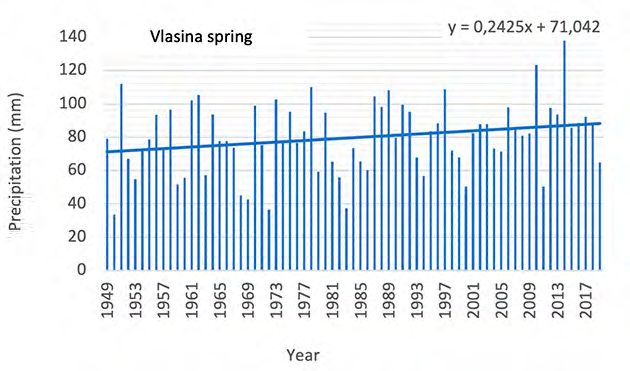
ble: a) the trend is positive – when the slope size is greater than zero; b) the trend is negative – when the slope
size is less than zero and c) there is no trend - when slope equals zero. For the second statistical procedure the
non-parametric Mann-Kendall (MK) test was applied (Mann 1945, Kendall 1970). This test is the most exten-
sively used at-site test for determining trend significance (Bocheva et al., 2009; Kysely´ , 2009; Sadri et al., 2009;
Korhonen, Kuusisto, 2010; Petrow, Merz, 2009; Petrow et al., 2009; Bormann et al., 2011; Meilutyte-Barausk-
iene et al., 2010; Blöschl et al., 2012; Giuntoli et al., 2012). The main advantage of MK test is that it is a robust,
rank-based test that, in contrast to the regular Student’s t-test, is not to be determined by the statistical distri-
bution of the parameter that is analyzed (Schmidli, Frei 2005). For trend significance a weaker criteria were
applied dueto the high variability in precipitation (Hänsel 2009, Łupikasza et al. 2017). MK test was applied to
test two hypotheses were tested: H₀ (null hypothesis) that indicates that there is no trend in data series; and
the H0hypothesis that indicates that there is a statistically significant trend in data series, at the selected lev-
el of significance (α). The level of significance in the hypothesis was determined by calculating probability (p).
Significance levelαwas set at 0.05. For analyzing the data, a Microsoft Office Excel 2007 software and its XL-
STAT extension (https://www.xlstat.com/en) were used.
     For the filling of the missing data two methods were used. First, we used the interpolation method that
was applied if a station had five or less consecutivemonths of missing data. Extrapolation was implemented as
the second method if a station had six or more consecutive months of missing data (Savić et al., 2010). Arith-
metic mean was applied for the first method, while for the second method firstly Person product moment cor-
relation coefficient was performed and then arithmetic mean (Stojsavljević et al., 2013). Extrapolation for the
Vlasina station was conducted by using data from the neighboring stations that are presented in table 2.

Table 2. Geographical information about meteorological stations used for extrapolation
 Meteorological station                 Latitude (φ)        Longitude (λ)   Altitude (m)       Distance from Vlasina (km)*
 Babušnica                               43o 04’ N            22o 25’ E         520                        73
 Predejane                               42o 50’ N            22o 08’ E         311                        38
 Kukavica                                42o 47’ N            21o 57’ E         1438                       64

*All distances are calculated using software Google Earth

     Pearson’s correlation moment for correlative cells was used for extrapolation Pearson’s correlation mo-
ment: maximum correlation 1, minimum 0 minimum correlation is 0.5 all three correlative cells meet the
conditions Babusnica 0.76, Predejane 0.77, Kukavica 0.62.
     For defining the seasons we used interpretation suggested by Milošević et al, (2016) and Leščešen et al.
(2020) where seasons are defined as follows: winter (December – January - February), spring (March – April
- May), summer (June – July - August) and autumn (September – October - November). Regarding the win-
ter season, it is important to highlight that precipitation amount corresponds to January-February of the cal-
endar year and to December of the previous year.

                                             RESULTS AND DISCUSSION
     For two time series covered in this study both linear trend and MK test were calculated. The analysis was
complemented with calculation of precipitation change per decade and trend probability for both time series
from the investigated stations. Obtained results are presented in figure1 and table 3.
     Total annual amount of precipitation on investigated stations during observed period was 560.5 mm on
Palić and 837.1 mm on Vlasina station. This indicates that on every 100m altitude increase amount of precip-
itation rises by 24mm. This result is also confirmed by the result presented by Gocić and Trajković (2013b).

                                                                            Researches Review DGTH | 50–1, 14–23 | 2021 | 16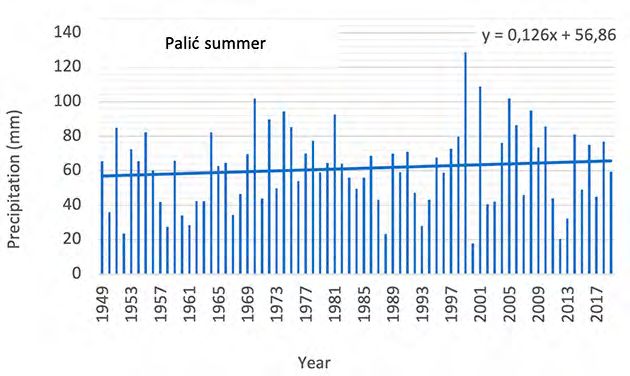
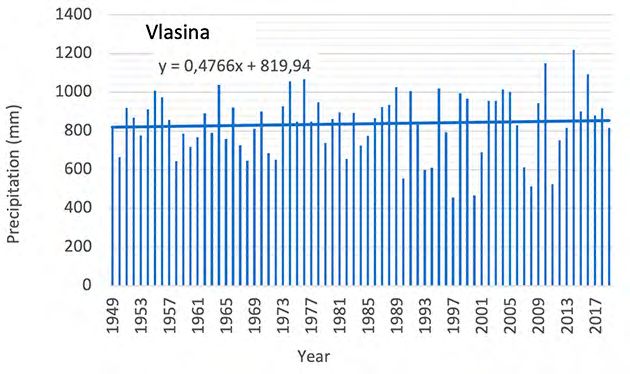
Figure 1. Linear trend of annual sums of precipitations on selected stations

Table 3. Change per decade and reliability probability for average annual precipitation at selected stations
 Meteorological station                                 Change per decade (mm)                              p (%)
 Palić                                                          -13,93                                      0.0586
 Vlasina                                                        +4.76                                       0.1679

*Trend equations are presented in figure 1.

     Figure 1 and table 3 show that the trend equations for the Palić station is positive, presented result is in
good accordance with conclusions made by Unkašević et al (2011) and Stojanović (2012). To further check
these results, MK test was applied. Because the probabilities p are bigger than the significance level, α = 5%,
the null hypothesis cannot be excluded in this case. The risk of excluding the null hypothesis while it is true is
5.86%. Regarding Vlasina station, figure1 and table 3 show a slightly positive trend, but MK trend has shown
that this trend is not statistically significant at the α = 5% because the risk of excluding the null hypothesis
while it is true is 16.79%. Results presented by Gocić and Trajković (2013) conclude that there is no statistical-
ly significant trend in the annual amount of precipitation at most stations in Serbia.

Table 4. Change per decade and reliability probability for average seasonal precipitation at selected stations
 Period of the year                                  Palić                                          Vlasina
                               Change per decade (mm)            p (%)           Change per decade (mm)              p (%)
 Winter                                       0,38              0.7765                    0,94                       0.5196
 Spring                                       1,47              0.1996                     2,4                       0.1005
 Summer                                       1,26              0.2870                    -0,69                      0.7571
 Autumn                                       1,69              0.0441*                   1,05                       0.6518

* Trend equations are presented in FIGURE 3.

     Seasonal amount of precipitation is highest during spring with 44.4 mm on Palić and 79.7 mm on Vlasina sta-
tion, while the lowest amount of precipitation is recorded during winter with 37.5 mm on Palić and 65.6 mm on
Vlasina station. At 100 m elevation the amount of precipitation increases by 2.39 mm during winter, 3.14 mm in
spring, 1.1 mm in summer and 2.04 mm during autumn. Explanation for this is provided by Tošić and Unkašević
(2013) where it is stated that this is in direct association with the intensive convection of humid and cold air masses.
     Figure 2 and table 4 show that the trend equations and p value of precipitations per seasons. At the Pal-
ić station it is noticeable that according to the trend equation that the precipitation trend is positive and in-
creasing over colder period of the year (winter and autumn). These results are in good agreement with the re-
sults presented by Gocić and Trajković (2013b) that show that, at the seasonal level, a positive trend is observed
during the autumn months. Furthermore, when precipitation trend is Vojvodina were studied by Tošić et al.
(2014) a positive trend in precipitation was found bot at annual and seasonal level (winter and autumn).Then

                                                                                 Researches Review DGTH | 50–1, 14–23 | 2021 | 17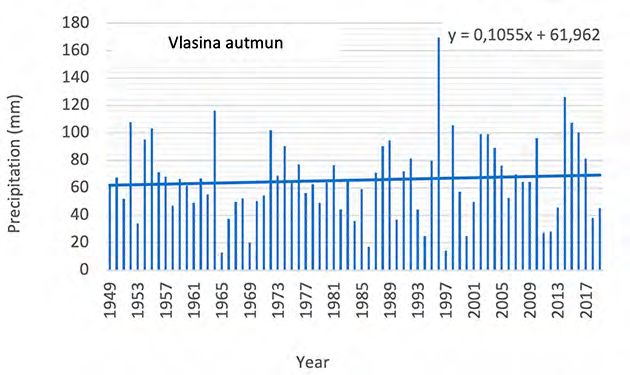
Figure 2. Linear trend of annual sums of precipitations on selected stations

                                                   Researches Review DGTH | 50–1, 14–23 | 2021 | 18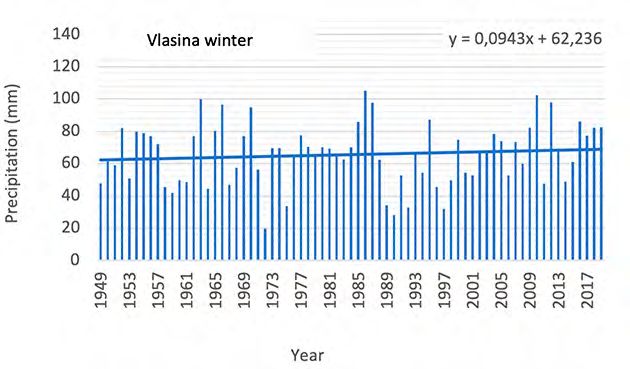
again, MK test has shown that only autumn precipitations have statistically significant increase during the ob-
served period with a p value of 0.0441 at the significant level p=0.005. As the calculated p-value is lesser than
the significance level alpha=0.05, the null hypothesis should be rejected and the alternative hypothesis should
be accepted, that is, that there is a trend in the series. During warm period of the year, spring and summer MK
test results show that the trend is not statistically significant with p values of 0.1996 and 0.2870 respectively. At
the Vlasina station, linear trend equation shows a positive trend over autumn, winter and spring while during
summer the trend is negative (Table 3). MK test results for the precipitation at the Vlasina station show that
during neither season trend was statistically significant.
     Linear trend analysis of the monthly precipitation on Palić station show that April, July, November and De-
cember had negative trend of precipitation but based on the MK test these trends were not statistically significant
(0.5164, 0.2457, 0.2625 respectively). During other months’ linear trend showed positive increase of precipitation but
according MK test this positive trend is statistically significant in the months of September and October, 0.0312 and
0.0452 respectively. Meanwhile, on Vlasina station even thou linear trend equation indicate that there is a positive
trend during some months (January, February, April, Jul, October and December) and negative trends during the
other months, no statistically significant trend was detected during either month (Table5).

Table 5. Monthly linear trend equation,change per decade (mm) and reliability probability (p) at the selected stations
Months                                  Palić                                              Vlasina
                     Linear trend       Change per         p(%)          Linear trend      Change per          p(%)
                       equation        decade (mm)                         equation       decade (mm)
January             0.095x + 30.04         0.95           0.5565       0.1296x + 61.854        1.29           0.7053
February          0.2003x + 26.303         2.00           0.3405       0.1078x + 56.352        1.08           0.7417
March              0.1855x + 25.561        1.86           0.4439       0.1875x + 59.194        1.86           0.3565
April             -0.0459x + 43.823        0.45           0.5164       0.2146x + 71.106        2.15           0.4650
May                 0.301x + 47.851        3.01           0.1875      0.3194x + 82.689         3.19           0.1575
June               0.1989x + 66.757        1.99           0.6813      -0.3307x + 112.21       -3.31           0.4202
July               -0.0043x + 60.08       -0.04           0.6446       0.1752x + 61.38         1.75           0.4000
August             0.1833x + 43.742        1.83           0.1557      -0.0521x + 53.354       -0.52           0.8195
September          0.4278x + 29.387        4.28           0.0315       0.2455x + 51.777        2.46           0.3777
October            0.3378x + 25.966        3.38           0.0452      0.3333x + 52.831         3.33           0.9482
November          -0.2699x + 57.704       -2.69           0.2457      -0.2646x + 83.754       -2.65           0.4583
December           -0.1824x + 51.985       -1.82          0.2625       0.088x + 68.318        0.88            0.7693

    Precipitation analysis on monthly level suggests that on both stations a decreasing trend was observed in
November, while both decreasing and increasing trends were observed in other months. Similar results were
presented by Gocić and Trajković (2013a). Average monthly amount of precipitation on Palić station is lowest
during March, which is in agreementwith the results presented by Unkašević et al (2011). The spatial distribu-
tion of average annual precipitation indicates that it increases with the altitude (Gocić et al 2013), that is clear-
ly noticeable in figure 2.

                                                   CONCLUSION
    In this study determination of the monthly, seasonal and annual precipitation trends at stations with dif-
ferent altitudes in the period from 1949to 2019 was conducted. For this purpose, precipitation data from Palić
and Vlasina meteorological stations were analyzed by applying both analysis of linear trends and the Mann–
Kendall test. Results obtained provide no definitive conclusion. Even thou positive linear trend is detected on

                                                                         Researches Review DGTH | 50–1, 14–23 | 2021 | 19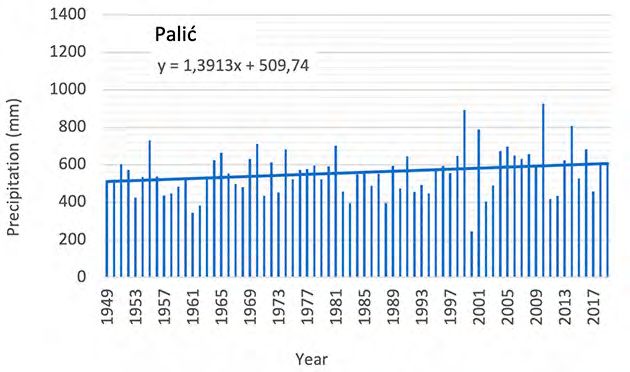
most time scales (annual, seasonal and monthly), according to the MK test only during autumn this trend was
statistically significant (p=0.441) and only on Palić station. On monthly scale, statistically significant trend
was detected during September and October with a p value of 0.0315 and 0.0452 respectively. Regarding Vlasi-
na station, no statistically significant trend has been detected on any time scale. Results presented in this study
are in good accordance with global precipitation trends, yet, precipitations over Southeastern Europe have de-
creased. For that purpose, further research of precipitation distributions, trends and tendencies is necessary in
order to define probable reasonsfor these phenomena. This paper provides solid basis for the future research
as it offersperceptions into the precipitation dynamic over the past several decades and the differences that al-
titude makes in the precipitation trends.

                                               REFERENCES
Alexandrov, V., Schneider, M., Koleva, E., Moisselin, J-M. (2004). Climate variability and change in Bulgaria
    during the 20th century. Theor. Appl. Climatol. 79, 133–149. DOI 10.1007/s00704-004-0073-4.
Allan, R.P.,Soden, B.J.(2008). Atmospheric warming and the amplification of precipitation extremes. Science,
    321, 1481–1484. https://doi.org/10.1126/science.1160787.
Becker, A., Finger, P., Meyer-Christoffer, A., Rudolf, B., Schamm, K., Schneider, U.,Ziese, M.(2013). A descrip-
    tion of the global land-surface precipitation data products of the Global Precipitation Climatology Centre
    with sample applications including centennial (trend) analysis from 1901–present. Earth Syst. Sci. Data,
    5, 71–99. https://doi.org/10.5194/essd-5-71-2013.
Berg, P., Moseley, C.H., Haerter, J.O.(2013). Strong increase in convective precipitation in response to higher
    temperatures. Nat. Geosci., 6, 181–185. https://doi.org/10.1038/ngeo1731.
Brunetti, M., Buffoni, L., Maugeri, M., Nanni, T.(2000). Precipitation intensity trends in northern Italy. Int. J.
    Climatol., 20, 1017–1031. https://doi.org/10.1002/1097-0088.
Brunetti, M., Maugeri, M., Nanni, T. (2001). Changes in total precipitation, rainy days and extreme events in
    northeastern Italy, Int. J. Climatol., 21, 861–871.
Burić, B. D., Dragojlović, M. J., Milenković, M., Popović, Z. Lj., Doderović, M. M. (2018a). Influence of varia-
    bility of the East Atlantic Oscillation on the air temperature in Montenegro. Thermal Science, 22(1B), 759-
    766.
Burić, D., Doderović, M.(2019). Precipitation, humidity and cloudiness in Podgorica (Montenegro) during the
    period 1951-2018. Geographica Pannonica, 23(4), 233-244.
Burić, D., Ducić, V., Mihajlović, J. (2018b). Relationship between mean annual temperatures and precipitation
    sums in Montenegro between 1951-1980 and 1981-2010 periods. Bulletin of the Serbian Geographical Soci-
    ety, 98(1), 31-48.
Cioffi, F., Lall, U., Rus, E., Krishnamurthy, C.K.B.(2015). Space-time structure of extreme precipitation in Eu-
    rope over the last century. Int. J. Climatol. 35, 1749–1760. https://doi.org/10.1002/joc.4116.
Dai, A., Fung, I.Y., Del Genio, A.D.(1997). Surface observed global land precipitation variations during 1900–
    88. J. Clim., 10, 2943–2962. https://doi.org/10.1175/1520442(1997)010.
Đorđević, S.V. (2008). Temperature and precipitation trends in Belgrade and indicators of changing extremes
    for Serbia. Geographica Pannonica, 12(2), 62-68. DOI: 10.5937/GeoPan0802062D.
European Environment Agency (EEA), (2017). Climate change, impacts and vulnerability in Europe 2016, an
    indicator - based report (EEA Report No. 1/2017). European Environment Agency, Copenhagen.
Frich, P., Alexander, L.V., Della-Marta, P., Gleason, B., Haylock, M., Klein Tank, A.M.G., Peterson, T.(2002).
    Observed coherent changes in climate extremes during the second half of the twentieth entury. Clim. Res.,
    19, 193–202. https://doi.org/10.3354/cr019193.
Gajić-Čapka, M., Cindrić, K., Pasarić, Z. (2015). Trends in precipitation indices in Croatia, 1961–2010.Theor
    Appl Climatol, 121, 167–177 https://doi.org/10.1007/s00704-014-1217-9

                                                                      Researches Review DGTH | 50–1, 14–23 | 2021 | 20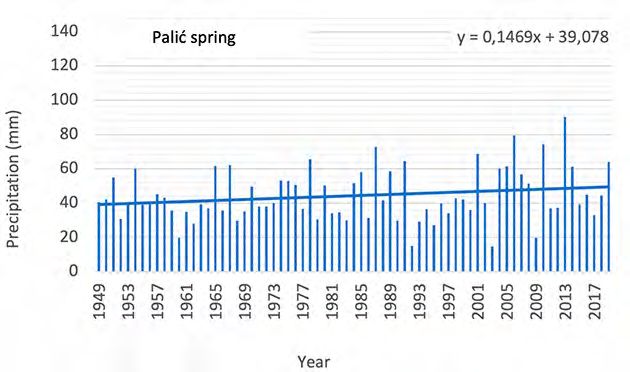
Ghaedi, S., Shojaiean, A. (2020). Spatial and temporal variability of precipitation concentration in Iran. Geo-
    graphica Pannonica, 24(4), 244-251. doi: 10.5937/gp24-27361
Gocić, M., Trajković, S. (2013a). Spatio-temporal patterns of precipitation in Serbia. Theor Appl Climatol DOI
    10.1007/s00704-013-1017-7
Gocić, M.,Trajković, S. (2013b). Analysis of precipitation and drought data in Serbia over the period 1980–
    2010. Journal of Hydrology, 494, 32–42. http://dx.doi.org/10.1016/j.jhydrol.2013.04.044
Hänsel, S. (2009).Changes in Saxon precipitation characteristics. Trends of extreme precipitation and droughts.
    Doctoral dissertation, TU Bergakademie Freiberg, Cuvillier Verlag, Göttingen.
Hynčica, M.,Hutha, R. (2019). Long-term changes in precipitation phase in Europe in cold half year, Atmos-
    pheric Research, 227, 79–88. https://doi.org/10.1016/j.atmosres.2019.04.032
Kendall, M.G.(1975).Rank correlation methods. Charles Griffin, London.
Kingúza, P.H.,Tilwebwa, S.L.P.(2019). Inter-annual variability of March to May rainfall over Tanzania and its
    association with atmospheric circulation anomalies. Geographica Pannonica, 23(3), 147-161.
Leščešen, I., Dolinaj, D., Pantelić, M., Telbisz, T., Varga, G. (2020). Hydrological drought assessment of the
    Tisza river. J. Geogr. Inst. Cvijic, 70(2), 89–100. https://doi.org/10.2298/IJGI2002089L
Libanda, B., Zheng, M., Banda, N.(2017). Variability of extreme wet events over Malawi. Geographica Pannon-
    ica, 21(4), 212-223.
Luković, J., Bajat, B., Blagojević, D., Kilibarda, M. (2013). Spatial pattern of recent rainfall trends in Serbia
    (1961-2009). Regional Environmental Change, 14(5), 1-11 DOI: 10.1007/s10113-013-0459-x
Łupikasza, B.E. (2017). Seasonal patterns and consistency of extreme precipitation trends in Europe, Decem-
    ber 1950 to February 2008. Climate Research, 72, 217–237. https://doi.org/10.3354/cr01467
Mann, H.B. (1945). Nonparametric tests against trend. Econometrica, 13, 245–259.
Maraun, D., Osborn, T.J., Gillett, N.P. (2008). United Kingdom daily precipitation intensity: improved early
    data, error estimates and an update from 2000 to 2006. Int. J.Climatol. 28, 833–842. https://doi.org/10.1002/
    joc.1672.
Markonis, Y., Batelis, S. C., Dimakos, Y., Moschou, E., Koutsoyiannis, D. (2017). Temporal and spatial varia-
    bility of rainfall over Greece. Theoretical and Applied Climatology, 130, 217-232.
Milentijević, N., Bačević, N., Ristić, D., Valjarević, A. Pantelić, M., Kićović, D. (2020). Application of Mann-Ken-
    dal (MK) test in trend analysis of air temperature and precipitation: case of Mačva district (Serbia). UNI-
    VERSITY THOUGHT, Publication in Natural Sciences, Vol. 10, No. 1, 37-43. DOI: https://doi.org/10.5937/
    univtho10-24774
Milivoj B. Gavrilov, B.M., Tošić, I., Marković, B.S., Unkašević, M., Petrović, P. (2016). Analysis of annual and
    seasonal temperature trends using the Mann-Kendall test in Vojvodina, Serbia. Időjárás, 120(2), 183–198.
Miloševic, D., Savic, S.(2013). Analysis of precipitation quantities and trends from Pannonian and Peripanno-
    nian parts of Serbia. Dela, 39, 125-139
Milošević, D., Savić, S.M., Stojanović, V., Popov-Raljić, J. (2015). Effects of precipitation and temperatures on
    crop yield variability in Vojvodina (Serbia). Italian Journal of agrometeorology, 20, 35-46.
Milošević, D.D., Savić, S.M., Pantelić, M., Stankov, U., Žiberna, I., Dolinaj, D., Leščešen, I. (2016). Variability
    of seasonal and annual precipitation in Slovenia and its correlation with large-scale atmospheric circula-
    tion. Open geosciences, 8(1), 593-605.
Milovanović. B. (2005). Statistical procedures application and results of research of precipitation on mountain
    Stara planina. Geographical institute “Jovan Cvijic” SASA collection of papers, 54, 33-44.
New, M., Todd, M., Hulme, M., Jones, P. (2001). Precipitation measurements and trends in the twentieth cen-
    tury. Int. J. Climatol., 21, 1889–1922. https://doi.org/10.1002/joc.680.
Nguyen, P. A., Thorstensen, S., Sorooshian, K., Hsu, A., Aghakouchak, H., Ashouri, H. T., Braithwaite, D.
    (2018). Global precipitation trends across spatial scales using satellite observations. Bulletin of the Ameri-
    can Meteorological Society, 99, 689-697. DOI: https://doi.org/10.1175/BAMS-D-17-0065.1
Niedźwiedź, T., Twardosz, R., Walanus, A. (2009). Long-term variability of precipitation series in East central
    Europe in relation to circulation patterns. Theoret. Appl. Climatol. 98(3–4), 337–350.

                                                                      Researches Review DGTH | 50–1, 14–23 | 2021 | 21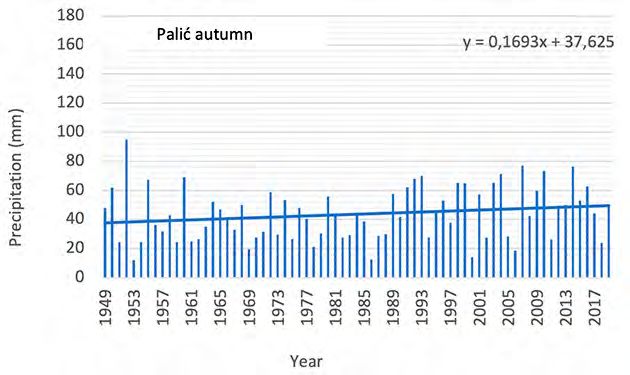
Nikolova, N. (2004). Rainfall Variability In Bulgaria And Its Relation With North Atlantic Oscillation. Ohrid,
     FY Republic of Macedonia, 25-29 May 2004.
O’Gorman, P.A. (2015). Precipitation extremes under climate change. Curr. Clim. Chang. Rep., 1, 49–59.
Oguntunde, P.G., Abiodun, B.J., Lischeid, G. (2011). Rainfall trends in Nigeria, 1901–2000. J Hydrol, 411, 207–
     218
Philandras, C. M., Nastos, P. T., Kapsomenakis, J., Douvis, K. C., Tselioudis, G., Zerefos, C. S. (2011). Long
     term precipitation trends and variability within the Mediterranean region. Natural Hazards and Earth
     System Sciences, 11, 3235-3250.
Popov, T., Gnjato, S., Trbić, G. (2019). Analysis of extreme precipitation over the Peripannonian region of Bos-
     nia and Hercegovina. Időjárás, 122(4), 433-452. doi:10.28974/idojaras.2018.4.5
Popov, T., Gnjato, S., Trbić, G. (2019). Changes in precipitation over the East Herzegovina region. Bulletin of
     the Serbian Geographical Society, 99(1), 29-44.
Radeva, K., Nikolova, N. (2020). Hydrometeorological Drought hazard and vulnerability assessment for North-
     ern Bulgaria. Geographica Pannonica, 24(2), 112-123. DOI: 10.5937/gp24-25074
Savić, S., Kalfayan, M., Dolinaj, D. (2020). Precipitation spatial patterns in cities with different urbanisation
     types: Case study of Novi Sad (Serbia) as a medium-sized city. Geographica Pannonica, 24(2), 88-99.
Savić, S., Petrović, P., Milovanović, B. (2010). Homogenisation of mean air temperature data series from Serbia,
     EGU General Assembly 2010, Geophysical Research Abstract, vol. 12, EGU2010-5521-1.
Smith, T.M., Arkin, P.A., Ren, L., Shen, S.S. (2012). Improved reconstruction of global precipitation since 1900.
     J. Atmos. Ocean. Technol., 29, 1505–1517. https://doi.org/10.1175/JTECH-D-12-00001.1.
Spinoni, J., Naumann, G., Vogt, V. J. (2017). Pan-European seasonal trends and recent changes of drought fre-
     quency and severity. Global and Planetary Change, 148, 113-130.
Stojanović, G. (2012). Analiza godišnjih padavinskih suma na prostoru Srbije. J. Geogr. Inst. Cvijic, 62(2), 1-13.
Stojsavljevič, R., Savić, S., Milošević, D., Stojanov, S., Leščešen, I., Majstorović, V. (2013). Interpolation and Ex-
     trapolation of Precipitation Quantities in Serbia. European Researcher, 55(7-2), 1980-1986.
Tabari, H.,Hosseinzadeh Talaee, P. (2011). Temporal variability of precipitation over Iran: 1966–2005. Journal
     of Hydrology, 396(3–4), 313-320. https://doi.org/10.1016/j.jhydrol.2010.11.034
Tosic, I., Unkasevic, M. (2013). Extreme daily precipitation in Belgrade and their links with the prevailing di-
     rections of the air trajectories. Theor Appl Climatol, 111, 97–107.
Tošić, I. (2004). Spatial and temporal variability of winter and summer precipitation over Serbia and Monte-
     negro. Theor. Appl. Climatol., 77, 47–56. DOI 10.1007/s00704-003-0022-7
Tošić, I., Unkašević, M. (2005). Analysis of precipitation series for Belgrade. Theor Appl Climatol, 80, 67–77.
Tošić, I., Zorn, M., Ortar, J., Unkašević, M., Gavrilov, M. B., Marković, S. B. (2016). Annual and seasonal var-
     iability of precipitation and temperatures in Slovenia from 1961 to 2011. Atmospheric Research, 168, 220-
     233.
Unkašević, M., Tošić, I. (2011). A statistical analysis of the daily precipitation over Serbia: trends and indices.
     Theor Appl Climatol, 106, 69–78. DOI 10.1007/s00704-011-0418-8
van den Besselaar, E.J.M., Klein Tank, A.M.G., Buishand, T.A. (2013). Trends in European precipitation ex-
     tremes over 1951–2010. Int. J. Climatol. 33, 2682–2689. https://doi.org/10.1002/joc.3619.
Villarini, G., Smith, J.A., Vecchi, G.A. (2013). Changing frequency of heavy rainfall over the Central United
     States. J. Clim., 26, 351–357. https://doi.org/10.1175/JCLI-D-12-00043.1.
Ye, H., Fetzer, E.J., Behrangi, A., Wong, S., Lambrigtsen, B.H., Wang, C.Y., Cohen, J., Gamelin, B.L. (2016). In-
     creasing daily precipitation intensity associated with warmer air temperatures over Northern Eurasia. J.
     Clim. 29, 623–636. https://doi.org/10.1175/JCLI-D-14-00771.1.

                                                                       Researches Review DGTH | 50–1, 14–23 | 2021 | 22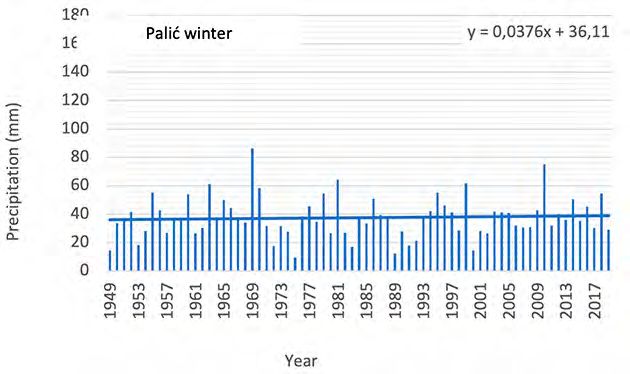
CONFLICTS OF INTEREST The authors declared no potential conflicts of interest with respect to the re-
                      search, authorship, and/or publication of this article. © 2021 by the authors.
                      This article is an open access article distributed under the terms and condi-
                      tions of the Creative Commons Attribution (CC BY) license (http://cre-ative-
                      commons.org/licenses/by/4.0/).

ORCID      Igor Leščešen https://orcid.org/0000-0001-9090-2662
           Dragan Milošević https://orcid.org/0000-0001-5050-0052
           Rastislav Stojsavljević https://orcid.org/0000-0002-4317-6765

                                                              Researches Review DGTH | 50–1, 14–23 | 2021 | 23
You can also read