The ATLAS Tile Calorimeter Tools for Data Quality Assessment
←
→
Page content transcription
If your browser does not render page correctly, please read the page content below
EPJ Web of Conferences 251, 03018 (2021)                                      https://doi.org/10.1051/epjconf/202125103018
CHEP 2021

      The ATLAS Tile Calorimeter Tools for Data Quality Assess-
      ment

      Daniel Scheirich1,∗ on behalf of the ATLAS Tile Calorimeter System
      1
          Charles University, V Holešovičkách 2 180 00 Prague 8 Czech Republic

                    Abstract.
                    The ATLAS Tile Calorimeter (TileCal) is the central part of the hadronic
                    calorimeter of the ATLAS experiment and provides important information for
                    reconstruction of hadrons, jets, hadronic decays of tau leptons and missing
                    transverse energy. The readout is segmented into nearly 10000 channels that are
                    calibrated by means of Cesium source, laser, charge injection, and integrator-
                    based systems.
                    The data quality (DQ) relies on extensive monitoring of both collision and cal-
                    ibration data. Automated checks are performed on a set of pre-defined his-
                    tograms and results are summarized in dedicated web pages. A set of tools is
                    then used by the operators for further inspection of the acquired data with the
                    goal of spotting the origins of problems or other irregularities. Consequently,
                    the TileCal conditions data (calibration constants, channel statuses etc) are up-
                    dated in databases that are used for the data-reprocessing, or serve as an impor-
                    tant input for the maintenance works during the shutdown periods. This talk
                    reviews the software tools used for the DQ monitoring with emphasis on recent
                    developments aiming to integrate all tools into a single platform.

      1 The ATLAS Tile Calorimeter
      The ATLAS Experiment [1] is a multi-purpose experiment located at the Large Hadron Col-
      lider at CERN. It consists of many sub-systems designed to measure momentum and energy
      of particles as well as to provide particle identification. The Tile Calorimeter [2] (TileCal)
      is the main component of the hadronic calorimetry system and contributes to measurements
      of energy of jets, hadronically decaying tau leptons and missing transverse energy. It also
      assists in identification of muons and provides one of the inputs to the trigger system. The
      TileCal consists of three main parts: long barrel covering pseudorapidity2 in absolute value
      up to 1 and two extended barrels covering range between 0.8 and 1.7. The long barrel readout
      is split into two partitions marked as LBA and LBC and the two extended barrels are marked
      as EBA and EBC.
          ∗ e-mail: daniel.scheirich@cern.ch
      This work was supported by the Ministry of Education, Youth and Sports of the Czech Republic under grant
      LTT17018, research infrastructure project CERN-CZ LM2018104, and by Charles University grant UNCE/SCI/013.
          2 ATLAS uses a right-handed coordinate system with its origin at the nominal interaction point (IP) in the centre

      of the detector and the z-axis along the beam pipe. The x-axis points from the IP to the centre of the LHC ring, and
      the y-axis points upwards. Cylindrical coordinates (r, φ) are used in the transverse plane, φ being the azimuthal angle
      around the z-axis. The pseudorapidity is defined in terms of the polar angle θ as η = − ln tan(θ/2).

© The Authors, published by EDP Sciences. This is an open access article distributed under the terms of the Creative Commons
Attribution License 4.0 (http://creativecommons.org/licenses/by/4.0/).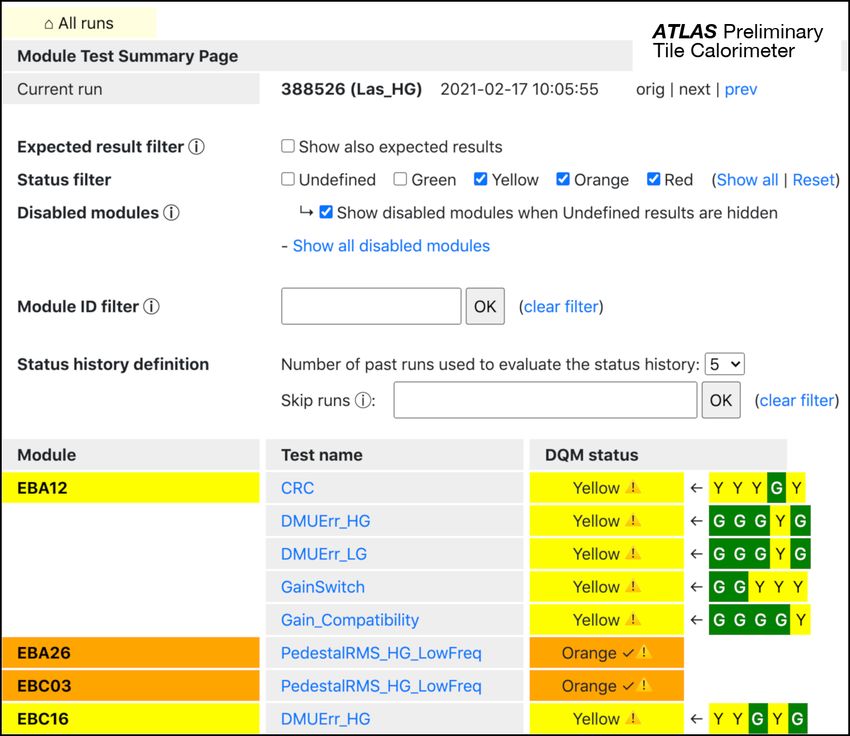
EPJ Web of Conferences 251, 03018 (2021)                          https://doi.org/10.1051/epjconf/202125103018
CHEP 2021

           TileCal is a sampling calorimeter that uses plastic scintillator tiles as an active medium
      and steel as an absorber. Signal from groups of tiles (readout cells) is collected by
      wavelength-shifting optical fibers and transported to photomultipliers (PMTs) where it is
      converted to electrical signal. Signal from the PMTs is shaped and amplified using two am-
      plifiers with different gains, with the ratio between the gains being 1:64. The signal from each
      amplifier is then digitized using 10bit ADCs with a sampling rate of 40 MHz, seven-sample
      windows are used to read out the signal. The readout electronics automatically determines
      whether to use the signal from the low-gain (LG) or the high-gain (HG) amplifier in order to
      achieve the best possible precision for both the high and low signals.
           The TileCal has about 5000 cells and 9852 channels, each cell is usually read by 2
      channels. The on-detector electronics is arranged into 256 modules, marked as LBA01-64,
      LBC01-64, EBA01-64, and EBC01-64 for long barrel and extended barrel sections, respec-
      tively. Triplets of channels are controlled by a single Data Management Unit chip (DMU).
      Each long barrel module has 16 DMUs which read out 48 channels, typical extended barrel
      module have 12 DMUs and 32 channels.

      2 Calibration Runs
      Signal coming from each channel in ADC counts has to be converted into energy. This
      conversion is done in two steps: first the ADC counts are converted into electric charge
      (pC), which is then converted into energy (GeV). While the relation between pC and GeV
      was fixed using the dedicated test beam campaigns, other aspects of the energy calibration
      are continuously monitored and adjusted. There are several aspects that affect its stability,
      from aging of the scintillators, to stability of the high-voltage supplies and electronics. To
      monitor all these effects TileCal employs several monitoring and calibration systems [3–5].
      The calibration and its monitoring is performed using dedicated runs.
          The calibration of TileCal optics is performed using a Cesium radioactive source which
      emits gamma rays of well known energy (662 keV). The Cesium source can be moved
      through all TileCal cells. The Cesium system is used to check the analog part of the
      read-out chain, to equalize response of all channels and to monitor evolution of the cell
      electromagnetic-scale calibration in time. The Cesium calibration run uses a special read-
      out system (integrator) which integrates PMT signal over a large time window (∼ 10 µs).
      The same readout system is also used during the data-taking period to measure the detector
      response to the minimum bias events (i.e. events containing only soft parton interactions).
      Other calibration and physics runs use the standard readout system.
          The calibration of PMTs is performed using a laser calibration system. It sends laser
      pulses into the PMTs and measures their response. Two laser intensities are used to test both
      the LG and HG readouts. The laser system measures the drift seen in PMT response with
      respect to the last Cesium scan.
          Response of the electronics is calibrated and monitored using the Charge Injection System
      (CIS). It injects the known charge into the readout system and measures its response. It is used
      to calibrate pC/ADC-counts conversion factor for both gains and corrects for non-linearity at
      low gain. The CIS system can perform either a scan with charge ranging from 0 to 800 pC to
      test the linearity or it can inject a constant charge to test stability of the readout electronics .
          Electronic noise is measured in dedicated runs with no signal in the detector.

      3 Data Quality Assessment
      During ATLAS operation, the data acquisition experts and operators check the calibration
      runs using a suite of web-based tools. They are responsible for performing the quality check

                                                      2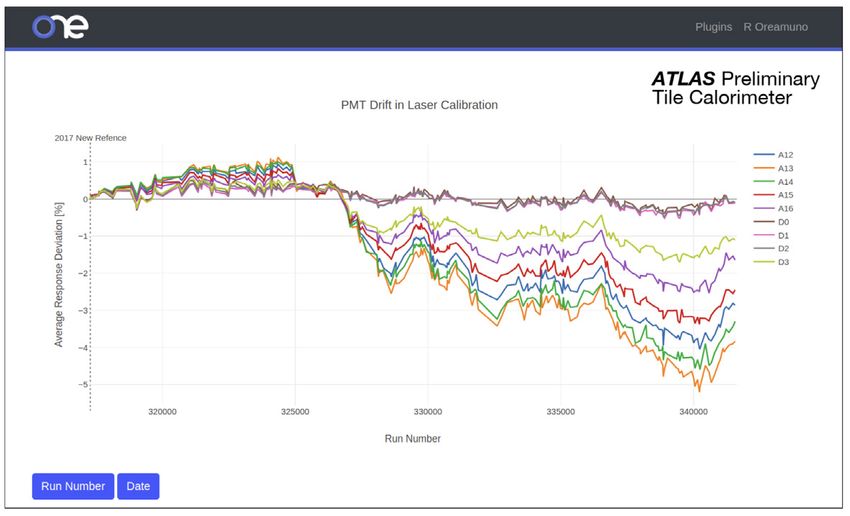
EPJ Web of Conferences 251, 03018 (2021)                        https://doi.org/10.1051/epjconf/202125103018
CHEP 2021

     of reconstructed data and recording the results. They check mainly for faulty hardware com-
     ponents.
          During the data-taking period the main focus is given to the data quality checks of col-
     lision data, although calibration runs are also monitored. During the maintenance period
     (when there is no collision data) the main focus goes to detailed checks of calibration runs
     since these serve as input for the TileCal maintenance team. The following types of calibra-
     tion runs are monitored:
     • Laser calibration runs. There are two types of laser runs: "Laser LG" and "Laser HG",
       which use two different intensities of the laser signal.
     • Charge-injection runs. Three types of runs are used: "CIS" calibration runs where a scan
       with the variable injected charge and phase is performed and "MonoCIS LG" and "Mono-
       CIS HG" runs with a constant value of injected charge.
     • Pedestal runs without any signal in the detector.
          Raw data from calibration runs are reconstructed using the dedicated software based on
     the ATLAS data processing framework Athena [6]. It produces plots and histograms (stored
     in the ROOT-format files [7]) which further undergo a suit of tests in order to identify potential
     problems.
          Two types of tests are employed. The first checks the consistency of data (e.g. parity bits,
     data header, etc) sent by individual DMU chips. The second type of tests monitors quality of
     the signal read from individual channels (e.g. digital errors, RMS of signal amplitude, timing
     shifts, etc). The first type of tests provides a result for each DMU on the module while the
     second type provides a result for each channel. Some tests are run for all types of calibration
     runs while other tests are run-type specific.
          Each test takes some specific value obtained for each channel or DMU and compares it
     to predefined thresholds. Based on this comparison it assigns a status (called Data Quality
     Monitor or DQM status) to each channel (or DMU). The status can be Green if the expected
     value is observed. If a problem is found the status can be Yellow or Red depending on its
     severity. Statuses of individual channels or DMUs are then propagated into the DQM module
     test status:
     • Green status: all channels/DMUs test results are within expected range.
     • Yellow status: some problems, usually no more than one channel affected.
     • Orange status: more serious problems, usually two or more channels affected.
     • Red status: serious problems.
     • Undefined status: there is not enough data to evaluate the test.
     The overall module DQM status is then taken as the worst test status for the whole test suite.
          The goal of these automatic DQM tests is to identify potential problems. However, oper-
     ators and experts still have to check each test result and manually submit the final report. This
     can be tricky and time-consuming effort. The goal of the ongoing DQ software development
     is to make this task as automated and as comfortable as possible.

     4 Tile DQ Software Tools and Tile-in-One Platform
     During the period of ATLAS commissioning phase and the first run of the LHC, many soft-
     ware tools were created to monitor TileCal data quality. They were usually created by differ-
     ent groups and use a variety of technologies and data sources. As a consequence, maintenance
     of such tools is difficult and some of them are no longer supported by their original devel-
     opers. Another disadvantage is that users usually have to browse multiple widely different

                                                     3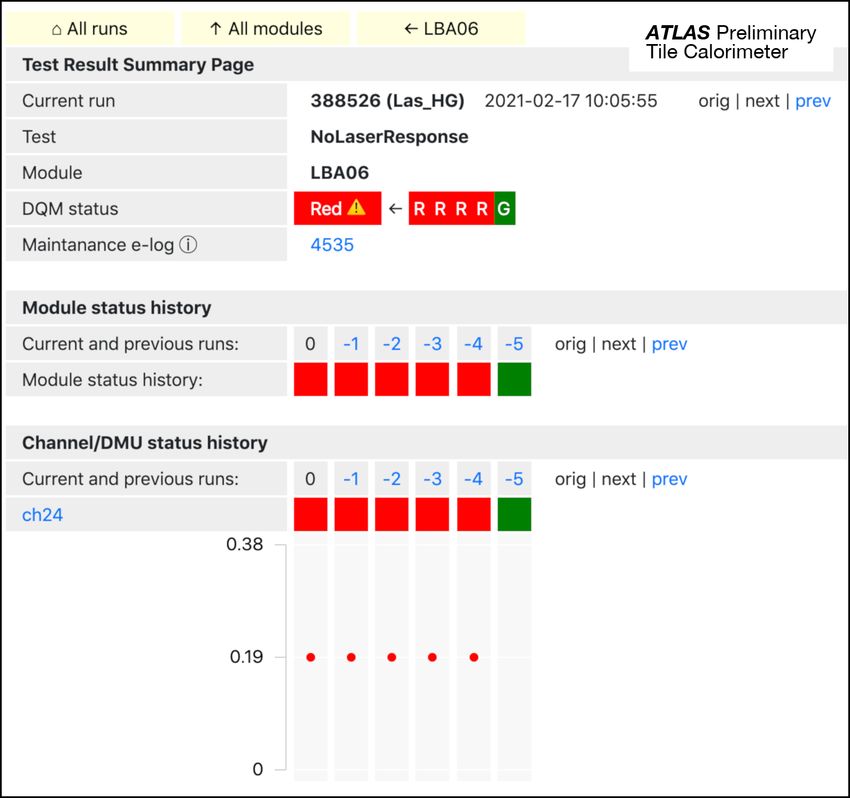
EPJ Web of Conferences 251, 03018 (2021)                       https://doi.org/10.1051/epjconf/202125103018
CHEP 2021

      Figure 1. Design of the Tile-in-one platform.

      web pages in order to perform some given task, e.g. as part of the TileCal DQ shift. One
      example of the old DQ tools is the "Web Interface for Shifters" (WIS) [8], which is still being
      used as the main TileCal DQ web application although its support by original authors was
      discontinued.

          The aim of the Tile-in-One [9] (TiO) platform is to provide a single platform for all the
      TileCal-related web applications. It provides common computing infrastructure and tools,
      such as access to CERN’s authentication service or the ready-to-use web toolkit libraries such
      as Bootstrap [10], while at the same time being flexible enough to serve specific purpose of
      individual applications. This is done to encourage collaborators to integrate their tools into
      the TiO and to minimize repetition of common code.

          The design of the infrastructure is illustrated in Figure 1. The platform is built around
      the main server (TiO VM0) hosted at https://tio.cern.ch. It is running Nginx server [11]
      and works as a reverse proxy for the individual web pages (called plugins) that each run on
      their own virtual machines. The main server is in charge of the user authentication via the
      oauth2_proxy [12] together with the CERN authentication service. Virtual machines that run
      the main server and individual plugins are hosted at CERN’s OpenStack [13] instance. The
      advantage of this approach is that individual virtual machines can run their own dedicated
      software best suited for the particular plugin. In practice, however, most plugins up-to-date
      are build upon a common template utilizing the uWSGI [14] server and the Python-based
      Bottle framework [15] together with the Bootstrap [10] toolkit. One of the advantages of
      using the python-based web server is that the web applications can directly access and analyze
      data files produced by the CERN’s data analysis framework ROOT [7] which comes with a
      Python interface. Source code of each plugin is version controlled using Git and it is required
      that it has clearly defined person or group responsible for it.

          The platform currently supports 8 plugins (see Figure 2). In addition, the platform also
      has a non-public development area accessible only from CERN network where more plugins
      are currently under development. The first three plugins in the list complement the platform
      itself: from a "Plugin Template" which can be used as a starting point for a new plugin devel-
      opment, through a very important "Tile-in-One Documentation", to a "Tile-in-One Monitor-
      ing" plugin which can be used to monitor the system load. Remaining plugins are dedicated
      to TileCal.

                                                      4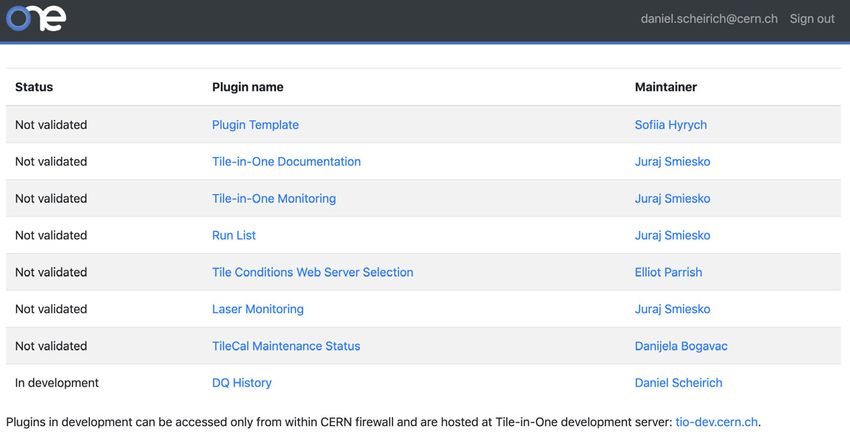
EPJ Web of Conferences 251, 03018 (2021)                    https://doi.org/10.1051/epjconf/202125103018
CHEP 2021

     Figure 2. List of Tile-in-One plugins

     Figure 3. Plugin Template interactive graph example.

     5 Examples of Tile-in-One plugins

     5.1 Plugin Template

     The "Plugin Template" serves as a generic template to ease development of new plugins. Most
     of the current plugins were built up from this template. It is based on the uWSGI and Bottle
     frameworks. The plugin illustrates usage of a server-side scripting in the Bottle framework
     as well as a client-side scripting using Bootstrap, d3 [16] and dc [17] frameworks.
         On server side, the plugin uses web page templates (called "views") which are HTML
     documents interlaced with python code. The python code snippets are pre-processed by
     Bottle and a pure HTML document is generated and served to the client. The plugin also
     contains an example of how to setup a uWSGI cron-like job (which regularly updates some
     data) and how to access a MariaDB database [18].
         On the client side, the plugin uses the Bootstrap framework to render the page, which
     makes it well presented also on mobile devices. In addition, it contains an example of an
     interactive graph rendered using the d3 library (see Figure 3).

                                                      5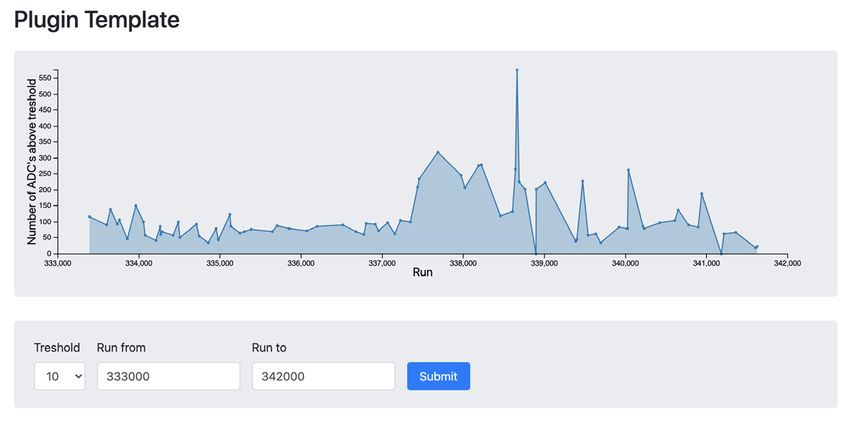
EPJ Web of Conferences 251, 03018 (2021)                          https://doi.org/10.1051/epjconf/202125103018
CHEP 2021

      Figure 4. Example of a graph rendered using Plotly JavaScript library in Laser Calibration Monitoring
      plugin.

      5.2 Laser Calibration Monitoring

      The "Laser Calibration Monitoring" plugin displays data from laser calibration runs. It can
      either display laser calibration constants for a given run, or it can display evolution (drift) of
      PMT average response as a function of time (or run number). The user can choose for which
      part of the calorimeter and for which group of readout cells the graphs are displayed. This
      plugin is built upon the Plugin Template, however, it uses the Plotly [19] JavaScript library to
      display graphs (see Figure 4).

      5.3 DQ History

      The most recent development has gone into the "DQ History" plugin. It is part of the ongoing
      effort to replace WIS, the old web tool for DQ monitoring, with a collection of new Tile-
      in-One plugins. The "DQ History" plugin displays results of DQ tests for calibration runs
      and allows for easy browsing through the run history. When going back and forth through
      the runs, only runs of the same type are considered, so one can watch evolution of a certain
      specific problem in time. The plugin offers a variety of filters which allow users to hide
      statuses of certain type (e.g. Green or Undefined) but also test results whose status has not
      changed in a given number of runs. Users also choose which run numbers are considered
      (e.g. to hide known problematic runs) and also filter specific module IDs.
          The plugin is built upon the "Plugin Template", but its use of the Bootstrap library is
      minimal. Most of the scripting is done on the server side within the Bottle framework.
          The plugin uses the same original data as WIS, i.e. the XML files produced by the DQM
      program. These XML files contain results (statuses) of individual tests. They are parsed and
      uploaded into a dedicated database (mariaDB) by an external script. The "DQ History" plugin
      then pulls these results from this database. It is expected in future, when the WIS application
      is discontinued, that the database will be filled directly by the DQM program.
          The plugin currently offers three main pages. The Module Test Summary page (Figure 5)
      shows test results for all modules in a chosen calibration run. The top section of the page
      is dedicated to filters, which by default are set up to only show modules with potential new

                                                       6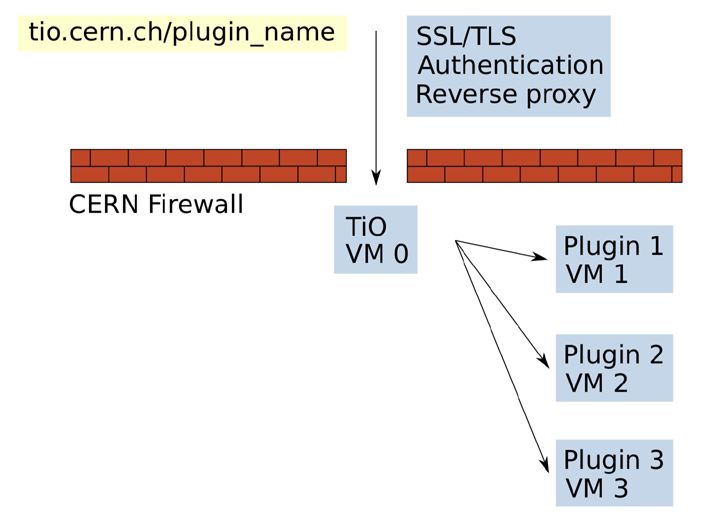
EPJ Web of Conferences 251, 03018 (2021) https://doi.org/10.1051/epjconf/202125103018
CHEP 2021
Figure 5. Module Test Summary page in the DQ History plugin of the Tile-in-One platform. This
example shows DQM test statuses for the laser high-gain calibration run 388526 together with statuses
in the previous five runs of the same type. Users can set up filters for specific statuses, modules, or run
numbers.
problems. The rest of the page shows the actual test results: module ID, the name of the test,
and its DQM status. The last column also shows an evolution of the status in the previous runs
of the same type. The user can choose the length of this history and also remove undesired
runs.
The Test Result Summary page (Figure 6) offers details about a concrete test for a concrete
module. Apart from the module status, it also shows a history of individual problematic
channels or DMUs. By clicking on the channel number one can display an evolution of the
actual value that was used to evaluate this test.
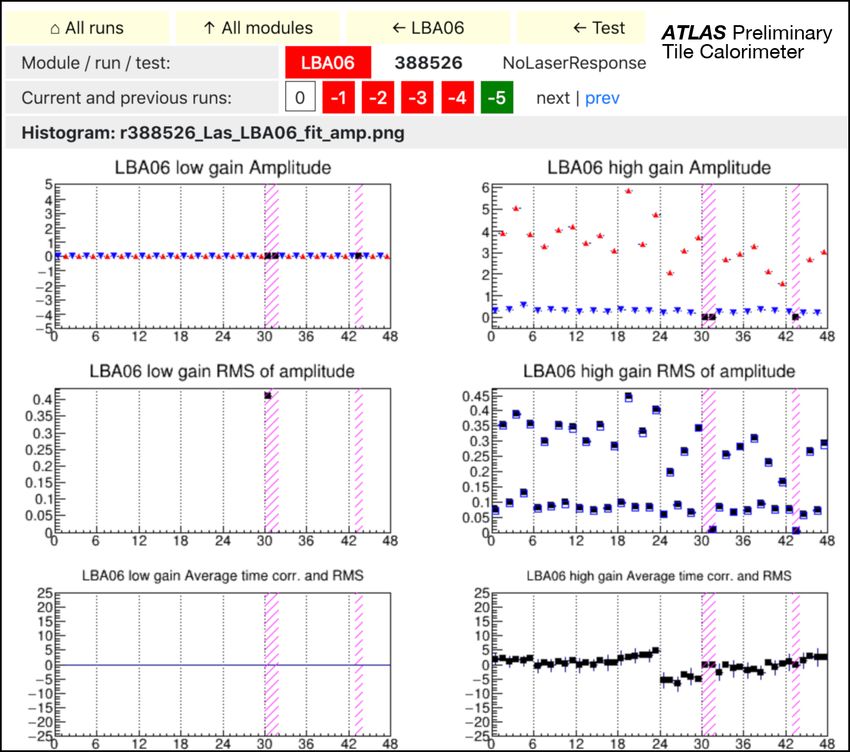
Finally, the Test Gallery page (Figure 7) displays actual histograms that were used to
perform this test. The user can browse back and forth through the run history to see how the
histograms evolve in time.
The "DQ History" plugin is still in development and undergoes testing by the TileCal
community. Therefore, many new features will be implemented in near future. For example,
a possibility to aggregate results from all types of calibration runs in a single table is currently
being investigated. Such a summary would be very valuable, since multiple test failures in
different calibration runs are actually often caused by a single common hardware problem.
Having the test results for all types of runs displayed on a single page would remove the need
of browsing through multiple pages in search of the origin of this problem.
7EPJ Web of Conferences 251, 03018 (2021) https://doi.org/10.1051/epjconf/202125103018
CHEP 2021
Figure 6. Test Result Summary page in the DQ History plugin of the Tile-in-One platform. This
example shows DQM test status for the "NoLaserResponse" test for module LBA06 in the laser high-
gain calibration run 388526 together with statuses in the previous five runs of the same type. A history
of the test status and the corresponding tested value for individual problematic channels are also shown.
6 Conclusions
A common platform for the ATLAS Tile Calorimeter data quality assessment tools is pre-
sented. The Tile-in-one platform offers a common, flexible, and easy-to-extend supporting
system for individual tools (plugins). It is built on modern technologies and requires minimal
maintenance. A rich variety of plugins has already been implemented which will gradually
replace obsolete web tools used by the ATLAS Tile Calorimeter community.
References
[1] ATLAS Collaboration, JINST 3, S08003 (2008)
[2] ATLAS Collaboration, Eur. Phys. J. C 78, 987 (2018), 1806.02129
[3] K. Anderson, A. Gupta, F. Merritt, M. Oreglia, J. Pilcher, H. Sanders, M. Shochet,
F. Tang, R. Teuscher, H. Wu et al., Nuclear Instruments and Methods in Physics Re-
search Section A: Accelerators, Spectrometers, Detectors and Associated Equipment
551, 469 (2005)
[4] G. Blanchot, M. Bosman, J. Budagov, M. Cavalli-Sforza, I. Efthymiopoulos, A. Isaev,
Y. Ivanyushenkov, A. Karyukhin, S. Kopikov, M. Nessi et al., Journal of Instrumentation
15, P03017 (2020)
8EPJ Web of Conferences 251, 03018 (2021) https://doi.org/10.1051/epjconf/202125103018
CHEP 2021
Figure 7. Test Gallery page in the DQ History plugin of the Tile-in-One platform. The page displays
histograms used as an input for the DQM tests. In this example, detailed histograms are shown for the
module LBA06 in the laser high-gain calibration run 388526. These histograms allow identification of
a problem in this module. The x-axis on all plots show the channel number. In this page, users can also
display histograms from the previous runs of the same type to track evolution of the problem.
[5] J. Abdallah, C. Alexa, Y.A. Coutinho, S.A.D. Santos, K. Anderson, G. Arabidze,
J. Araque, A. Artamonov, L. Asquith, R. Astalos et al., Journal of Instrumentation 11,
T10005 (2016)
[6] The ATLAS Experiment’s main offline software repository, https://gitlab.cern.ch/atlas/
athena (2021), accessed: 2021-02-17
[7] Root, https://root.cern.ch/ (2020), accessed: 2021-02-17
[8] Web interface for shifters, http://tcws.web.cern.ch/tcws/dashboard/current/
showRunList.php (2021), accessed: 2021-02-17
[9] Tile-in-one documentation, https://tio.cern.ch/documentation/index.md (2020), ac-
cessed: 2021-02-17
[10] Bootstrap, https://getbootstrap.com/ (2014), accessed: 2021-02-17
[11] Nginx, https://nginx.org/ (2004), accessed: 2021-02-17
[12] oauth2_proxy, https://github.com/bitly/oauth2_proxy/ (2014), accessed: 2021-02-17
[13] Openstack, https://www.openstack.org/ (2010), accessed: 2021-02-17
[14] uwsgi, https://uwsgi-docs.readthedocs.io/ (2016), accessed: 2021-02-17
[15] Bottle framework, https://bottlepy.org/docs/dev/ (2013), accessed: 2021-02-17
[16] Data-driven documents, https://d3js.org/ (2021), accessed: 2021-02-17
[17] Dimensional charting javascript library, https://dc-js.github.io/dc.js/ (2021), accessed:
2021-02-17
9EPJ Web of Conferences 251, 03018 (2021) https://doi.org/10.1051/epjconf/202125103018
CHEP 2021
[18] Mariadb server: The open source relational database, https://mariadb.org/ (2021), ac-
cessed: 2021-02-17
[19] Plotly javascript open source graphing library, https://plotly.com/javascript/ (2021), ac-
cessed: 2021-02-17
10You can also read