Object-based approach for urban land cover mapping using high spatial resolution data
←
→
Page content transcription
If your browser does not render page correctly, please read the page content below
E3S Web of Conferences 227, 01001 (2021)                                 https://doi.org/10.1051/e3sconf/202122701001
GI 2021

       Object-based approach for urban land cover
       mapping using high spatial resolution data
       Malgorzata Verone Wojtaszek 1,*, Levente Ronczyk 2 , Zokhid Mamatkulov3, and
       Mamanbek Reimov3
       1
         OU Alba Regia Technical Faculty, Pirosalma str. 1-3, 8000 Székesfehérvár, Hungary
       2
         UP Faculty of Sciences Institute of Geography, Ifjúság str. 6. 7624 Pécs, Hungary
       3
         Tashkent Institute of Irrigation and Agricultural Mechanization Engineers (TIIAME), Koriy Niyaziy
       str., 39, 100000, Tashkent, Uzbekistan.

                     Abstract. This paper deals with object-oriented image analysis applied
                     for an urban area. Very high-resolution images in conjunction with object-
                     oriented image analysis have been used for land cover detection. Using the
                     eCognition software with object-oriented methods, not only the spectral
                     information but also the shape, compactness and other parameters can be
                     used to extract meaningful objects. The spectral and geometric diversity of
                     urban surfaces is a very complex research issue. It is the main reason why
                     additional information is needed to improve the outcome of classification.
                     The most consistent and relevant characteristic of buildings is their height.
                     Therefore, elevation data (converted from LIDAR data) are used for
                     building extraction, segmentation and classification. The study deals with
                     the problem, how to determine the most appropriate parameters of
                     segmentation, feature extraction and classification methods. The data
                     extraction includes two phases, the first part consists the following steps:
                     data pre-processing, rule set development, multi-scale image segmentation,
                     the definition of features used to map land use, classification based on rule
                     set and accuracy evaluation. The second part of the data process based on
                     classical raster analysis GIS tools like focal and zonal function.
                     Keywords: OBIA, GIS, remote sensing, land cover, urban environment,
                     zonal statistics

       1 Introduction
           The loss of natural and semi-natural ecosystems and hereby induced negative change in
       the environment are among the most actual problems nowadays. In the last decades the
       rapid increase of large cities and the transformation of urban landscapes are the grates
       challenges to human welfare and a viable global environment. Urbanization is the most
       visible anthropogenic force on the earth, affecting its surface, atmosphere, water, its
       biodiversity and the life of people. There needed reliable data to assess the ecosystem
       health and biodiversity of many urban areas. The town planning and city management
       requires wide spectrum of topographical, environmental, infrastructure and several other

       *
           Corresponding author: wojtaszek.malgorzata@amk.uni-obuda.hu

© The Authors, published by EDP Sciences. This is an open access article distributed under the terms of the Creative Commons
Attribution License 4.0 (http://creativecommons.org/licenses/by/4.0/).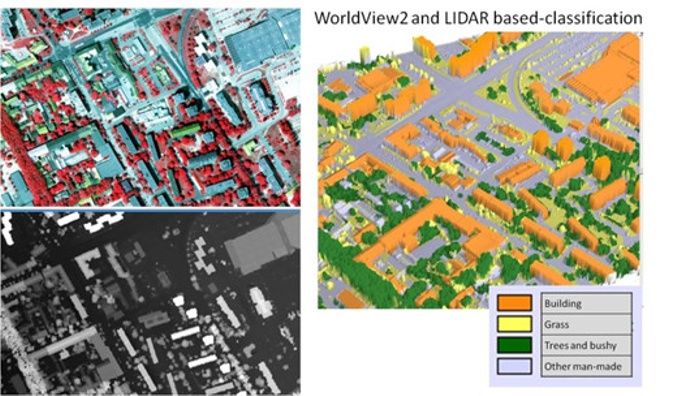
E3S Web of Conferences 227, 01001 (2021) https://doi.org/10.1051/e3sconf/202122701001
GI 2021
information as well. Remote sensing provides an important data source for many fields of
research. Data available from satellites presents an opportunity to collect information
relevant to urban environments at various of spatial and temporal scales. Urban land cover
and land use data play an important role in ecological and environmental investigations. In
several studies remote sensing data are used as a source, but the results are not quite
satisfying for detailed land use detection in urban areas [6, 8, 14-17,]. Many studies have
been carried out to find an appropriate method to classify the high resolution remote
sensing data [3, 7, 12-13]. The difficulty of mapping land cover in urban environment is not
due to the classification methods (algorithms). The problem is related to the creation and
selection of features. It is very difficult to find out the representative features or training
samples for man‐made objects. Recent sensor development including high spatial and
spectral resolution like WorldView sensors have the potential for more detailed and
accurate mapping of urban land cover and land use [4]. Number of study have focused on
the issues of spectral properties of urban materials and their representation and mapping
from remote sensing data. The results indicate highly complex and diverse spectral
properties of urban land cover types. The spectral reparability of urban land cover types is
strongly dependent on spectral sensor characteristics [18]. The development of
classification methodologies for analysis of high resolution satellite imagery is relevant to
studies related with mapping of urban environments [11-12].
High-resolution satellite images provide an important data source for many fields of
research. The difficulty of mapping land cover in urban environment is not due to the
classification methods (algorithms). The problem is related to the creation and selection of
features. It is very difficult to find out the representative training samples or features for
man‐made objects. The present study aims at finding an appropriate classification method
in order to map urban land cover based on high resolution remote sensing data. This paper
deals with object-oriented image analysis applied for an urban area. Very high-resolution
aerial photos and satellite images in conjunction with object-oriented image analysis have
been used for land cover detection. Using the eCognition software with object-oriented
methods, not only the spectral information but also the shape, compactness and other
parameters can be used to extract meaningful objects. The spectral and geometric diversity
of urban surfaces is a very complex research issue. It is the main reason why additional
information is needed to improve the outcome of classification. The most consistent and
relevant characteristic of buildings is their high. The elevation data are suitable for building
and the different vegetation levels extraction, segmentation and classification.
2 Materials and methods
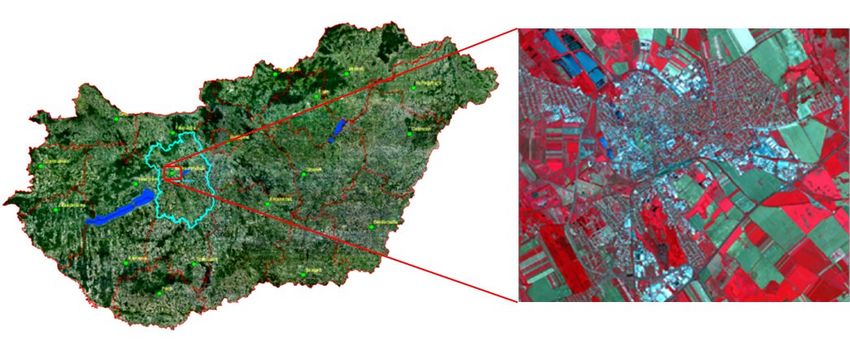
The study area (Székesfehérvár) is situated in central Hungary and one of the largest
settlements in Transdanubia (Fig.1). It is the county seat, the cultural and economic centre
of Fejér County. According to the historical documents the place has been inhabited since
the 5th century BC, but Székesfehérvár was first mentioned in 1009, as Alba Civitas. After
World War II the city was subject to industrialization. Parallel with industrialization the
population was also growing. By the 1970s Székesfehérvár had swelled to more than
100,000 inhabitants (in 1945 it had only about 35,000.) The city and its surroundings were
the most dynamically growing regions of Hungary in the 1990's. A number of new housing
estates were built, but the city centre was able to preserve its Baroque character. It is
inhabited by 101,943 people [5], the density of population is 594-person/sq km and ranks
among the middle-sized cities of the country. With a total area of 170.9 sq km it is the
second largest county centre in the Transdanubian region.
2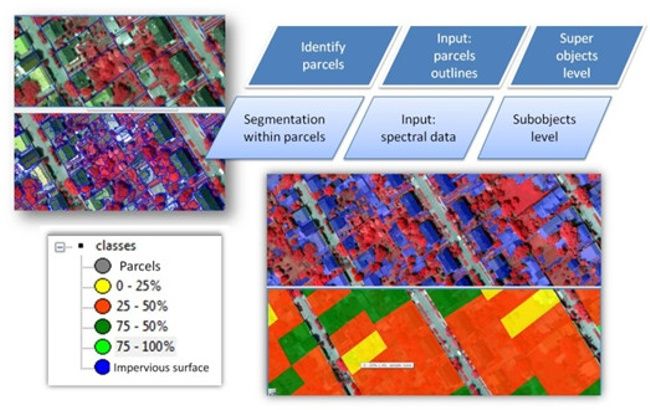
E3S Web of Conferences 227, 01001 (2021)                       https://doi.org/10.1051/e3sconf/202122701001
GI 2021

      Fig. 1. Study area: Székesfehérvár (Hungary)

      2.1 Data source

          The study used the following remote sensing data:
        • WorldView2 satellite image (2011, 2017)
        • Airborne photographs (2008, 2009, 2015)
        • LIDAR data (2008)
          WorldView-2 developed by DigitalGlobe, USA, in 2009, is the first high resolution
      multispectral commercial satellite having eight spectral sensors from the visible to near-
      infrared range. Spatial resolution of the Pan is 0.5 m and MS sensors is 2.0 m. WorldView-
      2 image was acquired 2011 and 2017.
          In 2008 the inner part of the city Székesfehérvár was laser scanned and in parallel with
      the laser scanning a digital airborne photographs were taken in visible and in NIR spectra.
      The images cover an area of 5 km2. The air photo made in 2009 covered all study area.
      Both of the airborne datasets were acquired in similar spatial resolution of approximately
      0.5 m. The Lidar points measured directly from the field, their point original density is 6-8
      point/m2, and the absolute horizontal accuracy is 0,5 m, the vertical accuracy is ±0,15 m (1
      Table, Fig. 2).

      Fig. 2. Airborne photograph and Digital Surface model based on LIDAR

                                                     3
E3S Web of Conferences 227, 01001 (2021) https://doi.org/10.1051/e3sconf/202122701001
GI 2021
Table 1. The specification of remote sensing data
Datasets Spectral resolution Other specification
Spatial Resolution: PAN – 0,5 m
WorlView2 (2011, Multispectral (400-1040 nm), 8
MS – 2 m, Quantization Level: 11
2017) bands, Panchromatic
Bits
Aerial photographs
visible/infrared Spatial Resolution: 0,5 m
(2008, 2009, 2015)
LIDAR point cloud FE/LE
LIDAR (2008) Absolute accuracy: horizontal < ±0.50
m; height < ±0.15 m
2.2 Methodology
One of the main objectives of this study was to develop a methodology to generate land
cover classes of urban area from high spatial resolution satellite images through object-
based classification. Using the eCognition software not only the spectral information but
also the shape, compactness and other parameters can be employed for mapping. To extract
buildings a combination of spectral (WorldView2) and LIDAR data contains elevation
information were applied. The most relevant information about buildings is their different
elevation compared to their surroundings. We used an object-oriented approach, which
allowed context consideration during the classification process. A consideration of spatial
context is very important for correct identification and classification of objects.
The aim of this papers is to describe the potential of object-based image analysis
(OBIA) for urban land cover detection and mapping impervious surface within parcels
using very high spatial resolution imagery.
2.3 Object-oriented image classification
The land cover classification system presented in this paper includes only the more
generalized levels (first and second level). The classification system is capable of further
refinement. Defining the categories, the next main view-points were considered: to give
names to categories by simply using accepted terminology, to use remote sensing as the
primary data source. The process considered spectral value and spatial characteristics of
objects and it is included the following steps:
• Segmentation
• Feature extraction
• Object classification
• Refinement of classification based on spectral value and spatial characteristics of
objects
• Final identification of categories
• Accuracy assessment
2.4 Segmentation and feature extraction
Segmentation of images is one of the main steps that have to be solved in the object-
based classification [1-2]. Segmentation is a process by which pixels are grouped into
segments according to their spectral similarity and other criteria (shape, area, position etc.)
[9]. At the beginning of segmentation, the heterogeneity criterion is thresholded by the user.
This is done by choosing a scale factor and by fixing the weights of the colour and shape
criteria, and the smoothness and compactness criterions as well. The multiresolution
4E3S Web of Conferences 227, 01001 (2021) https://doi.org/10.1051/e3sconf/202122701001
GI 2021
segmentation algorithm was run with different scale factors (10, 20, 30, and 40) while all
other parameters were held constant (shape: 0.1 and compactness: 0.5; shape: 0.4 and
compactness: 0.5). In general, a scale factor of 10 a shape factor of 0.1 and compactness of
0.5 produced the best results. The algorithm spectral difference was used to refine existing
segmentation results by merging spectrally similar image objects.
One of the critical steps in image analysis is to determine the most relevant features and
algorithms to be used in classification [1]. The eCognition works with objects and
information of whole objects like as the spectral signature, the shape and size or context is
available. All these attributes can be applied and combined for classification. Features
usually define the upper and lower limits of a range measure of characteristics of image
objects. Image objects within the defined limits are assigned to a specific class, while those
outside of the feature range are assigned to a different class (or left unclassified). Table 2.
summarizes the features used to aid the classification process.
Table 2. The features used to aid the classification process
Class Main features Other features
Vegetation (trees, NDVI Vegetation (trees, brushy, grass,
brushy, grass, barren)
barren)
Building Height information Spectral features, NDVI, context
(Rel. Border to building), size
information
Other man-made Spectral information (NDWI, size: area, length to width ratio
(road, other) NDVI)
Parking place (big Spectral information (NDVI, Shape: rectangular fit, shape index;
area) NDWI) size: area, length to width ratio,
context: rel. Border to parking place)
Water* Spectral information (NDWI)
Shadows* Spectral information (NDWI )
* At the end of classification the segments of shadow class were reclassed to the road and other
man-made classes according to the shape. The water in not included in presented study area.
3 Results and discussion
3.1 Rule set based classification
The classification of urban areas was done in two levels. In the first one the main
categories of land cover were determined by taking advantage of spectral properties of
WorldView2 image. In this process some normalized difference index was created
according to the spectral mean data of determined classes in different bands. Normalized
Difference Vegetation Index (NDVI) was used to select vegetation and no-vegetation and
to investigate different kind of vegetation. Other indices also were developed and utilized
during the classification (e.g. NDWI Normalized Difference Water Index). In the second
level during the building extraction the elevation data was used as the most relevant
characteristic of buildings. Additionally, the spectral and context features were employed to
clarify the classification. Table 2 and Fig. 3 summarize the features, which were utilized to
reveal the appropriate land cover classes.
5E3S Web of Conferences 227, 01001 (2021) https://doi.org/10.1051/e3sconf/202122701001
GI 2021
Fig. 3. Input data and the results of classification draped on DSM (Digital Surface Model based on
LIDAR points)
3.2 Performing accuracy assessment
The results of the land cover classifications derived from remotely sensed data are
compared by an accuracy assessment. An accuracy assessment analysis was performed by
producing an error matrix that compared the interpreted land cover map and a map contains
the result of ground truth investigation. The most important outputs from the accuracy
assessment included an error matrix, errors of omission and commission, both for all
classes and on a per category basis. The assessment indicates the producer’s and user’s and
overall accuracy (Table 3).
Table 3. Accuracy assessment
LIDAR and WorldView based classification
Class
Producer’s accuracy % User’s accuracy %
Building 88 99
Parking place 96 99
Road 67 92
Other man-made 97 26
Vegetation (trees- 98 54
bush)
Grass 94 51
Overall accuracy: 82
3.3 Mapping impervious surface
In this process other kind of segmentation (super object) were used to determined
objects representing the parcels and all types of parcels were identified at super object level.
To identity impervious surface within the parcels a new segmentation level (sub object) was
6E3S Web of Conferences 227, 01001 (2021) https://doi.org/10.1051/e3sconf/202122701001
GI 2021
added and the parcel area has been split up into image objects suited for identifying
impervious surface. In the classification process the objects were assigned into two classes,
vegetation and impervious surface. The final step of this work focus on categorizing parcels
based on the degree of impervious surface. Four classes have been distinguished using the
“classification” algorithm. The class distinction was based on imperviousness, in steps of
25% (Fig.4). The process is included the following steps:
1. Identify parcels (super object level)
• Segmentation representing the parcels (cheesboard segmentation)
• Classify the parcels (thematic layer attributes)
2. Identify impervious surface within the parcels (subobject level)
• A segmentation representing impervious surface (multiresolution segmentation)
• Classify impervious surface
3. Categorize parcels (classification, class description)
Fig. 4. Mapping impervious surface within the parcels
3.4 Urban landscape extraction using high spatial resolution imagery and GIS
techniques
In this process a raster analysis GIS tools like focal and zonal function we used for
urban landscape extraction. It included the following steps:
1. Segmentation
• Cheesbroad segmentation using thematic layer (Level 1)
• Cheesbroad segmentation 1 hectare units (Main Level)
• Multi resolution segmentation using mainly (0.9) the spectral information (Working
Level)
2. Object classification
• Spectral values of 8 bands, indexes
• Position
• Relation to super object
In the classification process the objects were assigned into two classes, vegetation and
water. Water bodies and vegetated area composed the class of Blue & Green Area (BGA).
The rest of the object was denoted as non-vegetated surface. To reach this classification
7E3S Web of Conferences 227, 01001 (2021) https://doi.org/10.1051/e3sconf/202122701001
GI 2021
firstly the vegetated area and lakes were separated and merged into one common class. The
portion of BGA in one hectare was the final result of the classification and it was export out
from the eCognition software as raster file. Two basic raster analysis tools were run on the
exported data. Focal functions process data using different neighbourhoods cells. During
the application of the zonal statistics tool of ArcGIS 9.3 software the polygons of district
dataset calculated the statistics of raster layers were produced by neighbourhoods tool. The
summary statistics of the zonal function is suitable to reveal the following information:
• Majority – the BGA value that appears most often in a given district,
• Range – range of the BGA values; homo- or heterogeneity of the BGA values in a
given district
• Std – Standard deviation of BGA values in a given district
The outcome of our research confirms the original assumption that from the city center
BGA value started to increase. The city center has the lowest BGA value, and there was not
any cell which was covered more than 90% by BGA. The majority of the pixels BGA value
is between 50-20 % (Fig. 5).
Fig. 5. BGA % in one hectare
Employing zonal statistic functions other aspects of urban landscape were analyzed.
According to urban morphological zone the statistical parameters of the district also were
dissolved (Table 4) Five categories were used according to the Urban Atlas of European
Union (URBAN ATLAS 2010). Value one demonstrate more than 90% of VBA value, and
category 5 shows more than 80% of sealed or anthropogenic surfaces.
Table 4. Different statistical parameters of the urban morphological zones
Morphological Maximum Range Mean STD Major Minority
zone value value value value value value
Downtown 4 2 3,5 0,5 4,0 2
Village like 5 5 1,8 1 1,6 5
Traditional 4,8 4,8 2,4 0,7 2,8 3
House with
5 5 1,8 0,75 2,0 5
garden
Building estate 4,75 4,5 2,3 0,9 2,2 4
An additional result was calculated the neighborhood of 1 hectare BGA area around a
given cell, to highlight the accessibility of natural environment of examined cell. Our
results are able to explain the reason behind recent population trends of Székesfehérvár.
Using focal function and calculating the maximum BGA value in 5 cells distance
8E3S Web of Conferences 227, 01001 (2021) https://doi.org/10.1051/e3sconf/202122701001
GI 2021
highlights, that the most of the historical center of the city does not have any area, which
can provide 1 ha green area for the young inhabitants. This is one of the main motivation,
why the young families leave the downtown and separating their living and working
environment.
4 Conclusion
An urban ecosystem presents a wide structural diversity and consequently spectral
variability therefore the process of classification needs not only spectral information but
other information like context or geometry as well. The fusion of remote sensing techniques
(imagery and aerial LIDAR) offers an efficient way to map and update GIS ready land
cover information. Using enhanced data source and object based image analysis accurate
results could be obtained.
Accuracy measures have shown that the use of elevation parameters leads to significant
improvements in comparison to only spectral bands classifications. However, the best
classification results were reached with the application of combined dataset of spectral and
elevation features, the further studies are needed in this field. The accuracy of this method
can be increased by integrated using high resolution aerial photos or hyperspectral data.
Our study presented a multifaceted method to evaluate an index, which is able to represent
one of the most important elements of the urban landscape. Object based image analysis
and further GIS functions supplied useful information of inner pattern of Székesfehérvár
and clarify some reason of present population trend.
References
1. T. Blaschke, ISPRS J. Photogramm. Remote Sens. 65, 2 (2010)
2. C. Burnett, T. Blaschke, Ecol. Modell. 168, 233 (2003)
3. I. Fekete, D. Dezső, I. László, K. Ócsai. Information Technology in higher education is
an electronic publication (Debrecen, 2008)
4. S. Hartling and others, doi: 10.3390/s19061284 (Published online, 2019)
5. KSH 2014, Gazetteer of the Republic of Hungary (Online:
http://portal.ksh.hu/docs/hun/hnk/hnk_2011.pdf, 2015)
6. D. Lu, S. Hetrick, E. Moran, Photogramm. Eng. Rem. S, 76, No 10, 1159 (2010)
7. S. W. Myint, P.Gober, A. Brazel, S. Grossman-Clarke, Q. Weng, Remote Sens.
Environ. 115 (5), 1145 (2011)
8. R. Pu, S. Landry. Yu, Qian, Int. J. Remote Sens. 32 (12), 3285 (2011)
9. E. Schöpfer, S. Lang, J. Strobl: In: Rashed, T. – Jürgens, C. (Eds): Remote Sensing of
Urban and Suburban Areas, 181 (Springer, Dordrecht, 2010)
10. R. Valbuena, T. F. de Sevilla, F.Mauro, C. Pascual, Abril, Martín, A. G. S., J. A.
Manzanera, Lidar and true-orthorectification of infrared aerial imagery of high Pinus
sylvestris forest in mountainous relief (Edinburgh, UK
http://oa.upm.es/3104/2/INVE_MEM_2008_53075.pdf, 2008)
11. M. Verőné Wojtaszek, L. Ronczyk, Object based classification of urban land cover
extraction using high spatial resolution imagery (2012)
12. Q. Weng, J. Remote Sens. Environ. 117, 34 (2012)
13. Y. Zhang, J. Photogramm. Remote Sens., 54 (1), 50 (1999)
9E3S Web of Conferences 227, 01001 (2021) https://doi.org/10.1051/e3sconf/202122701001
GI 2021
14. W. Zhou, G. Huang, A. Troy, M. L. Cadenasso, J. Remote Sens. Environ, 113, 1769
(2009)
15. S.Abdurakhmanov, Diss. Autoref. (TIIAME, Geodesy and Geoinformatics, 2020)
16. L. Gulyamova, J. Geograph. Societ. Uz. Spacial Vol., 28 (2018)
17. M. Sultanov, Research. Diss. (NUUz, 2018)
18. M. Herold, S. van der Linden, P. Hostert, D. Roberts, J. Urban Remote Sens. 137
(2006)
10You can also read