AirNow Fire and Smoke Map: Extension of the US-Wide Correction for Purple
←
→
Page content transcription
If your browser does not render page correctly, please read the page content below
EPA Tools and Resources Webinar
 AirNow Fire and Smoke Map: Extension
 of the US-Wide Correction for Purple
 PM2.5 Sensors
 Ron Evans                                             Karoline Johnson Barkjohn
 US EPA Office of Air Quality Planning and Standards   Andrea Clements
                                                       Amara Holder
 Sim Larkin                                            US EPA Office of Research and Development
 US Forest Service AirFire Research Team

  May 19, 2021
Office of Research and Development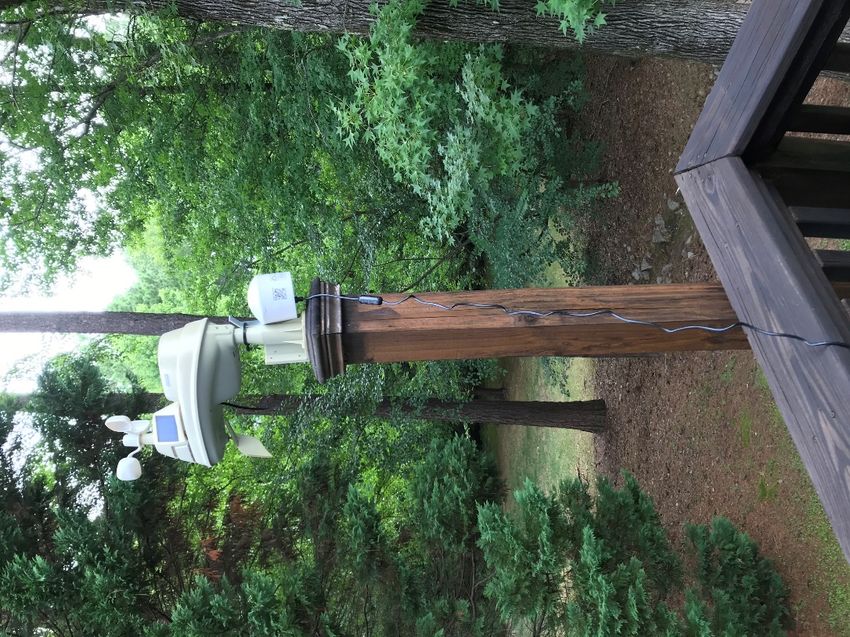
Presentation Outline

    •   Adding a sensor data layer to the AirNow Fire and Smoke Map
    •   Planned updates for the AirNow Fire and Smoke Map
    •   Background on air sensors
    •   Updating the US-wide correction for PurpleAir sensors
    •   Sensor user’s frequently asked questions (FAQs)
    •   Take home messages
    •   Resources

2
Adding a sensor data layer to the
      AirNow Fire and Smoke Map

3                                   3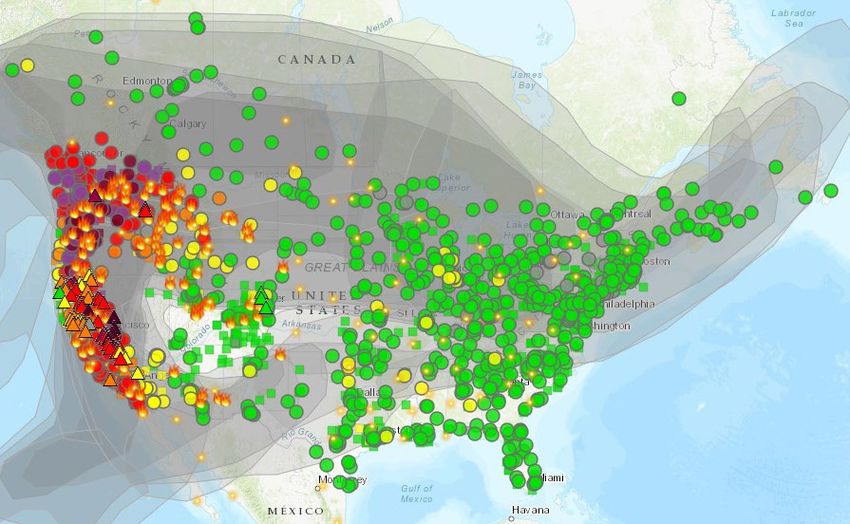
AirNow Sensor Data Pilot Released by
                             US EPA and USFS1

    • The Fire and Smoke (F&S) Map on AirNow.gov provides
      important air quality information during fire and smoke
      episodes
       • The map showed data from regulatory and temporary (added
         during fires) monitors along with smoke plumes and fire locations
    • In August 2020, a new layer of corrected, publicly available
      PM2.5 data from PurpleAir sensors was added to the map

4   1USFS   – US Forest Service
                                                                             4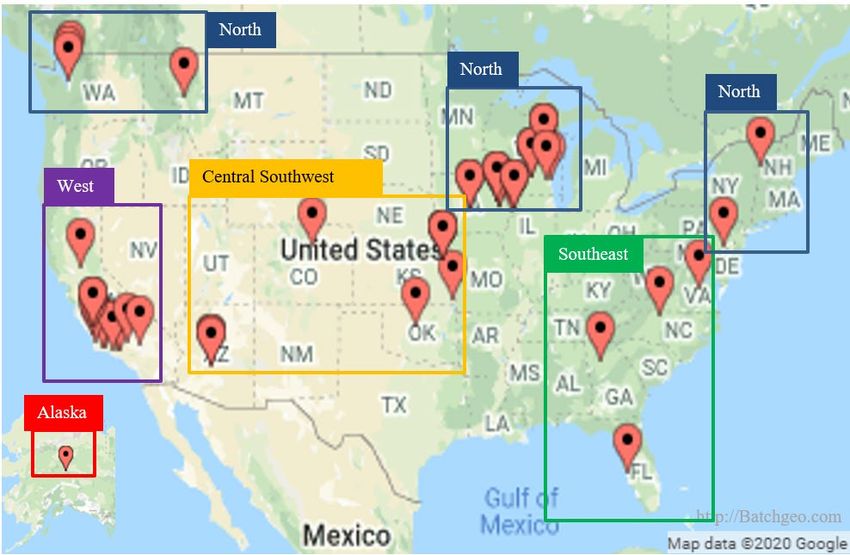
Goals of the Original Sensor Data Pilot

    • Two primary goals:
      • Provide additional air quality information the public can
        use to protect their health during fire and smoke events
      • Provide more coverage where permanent monitors do not
        exist

5
                                                                    5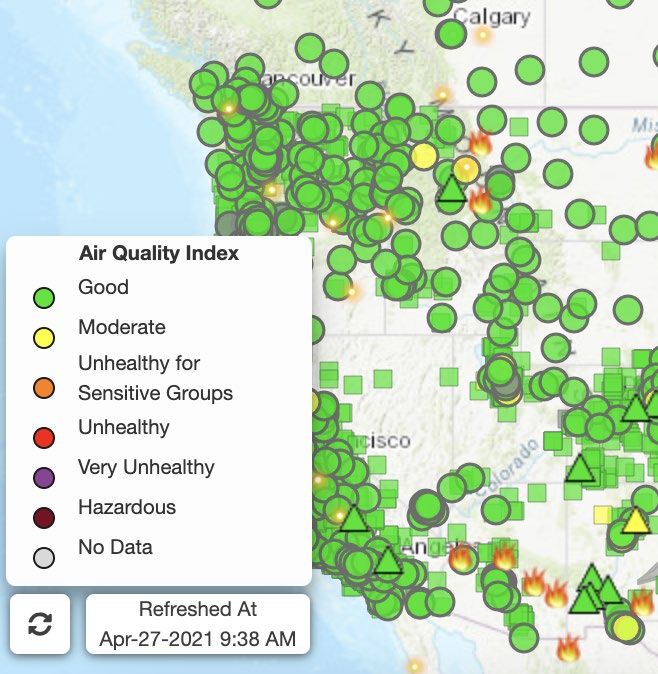
Why did US EPA & USFS conduct the
                     sensor data pilot?
                             ?
    • The pilot gave the public the ability to see air quality information
      from permanent monitors and sensors in a way that is comparable,
      consistent, and scientifically credible
    • Consistency and comparability is important because
      • As sensor use increases, so does the potential for conflicting information and
        public confusion
      • Sensor websites display data differently at different time scales than AirNow
        and state websites
      • Private sector air quality indices (AQIs) differ from the US EPA AQI

6
                                                                                         6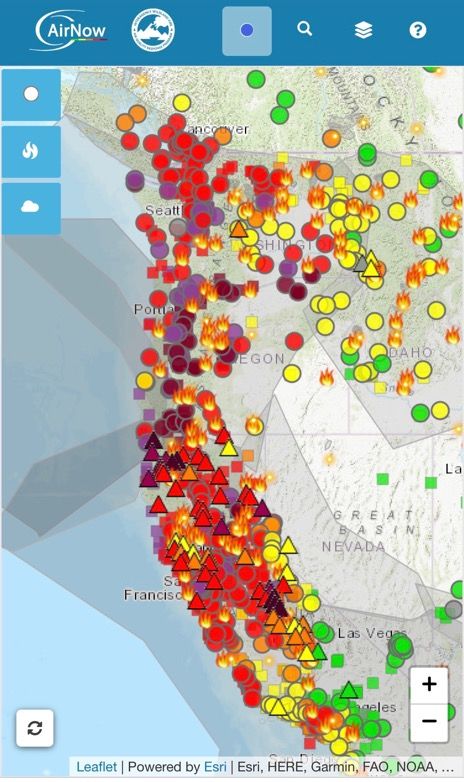
Timing of Release was Fortuitous

    Pilot release
    coincided with
    onset of one of
    the worst fire
    seasons in US
    history

7
                                                    7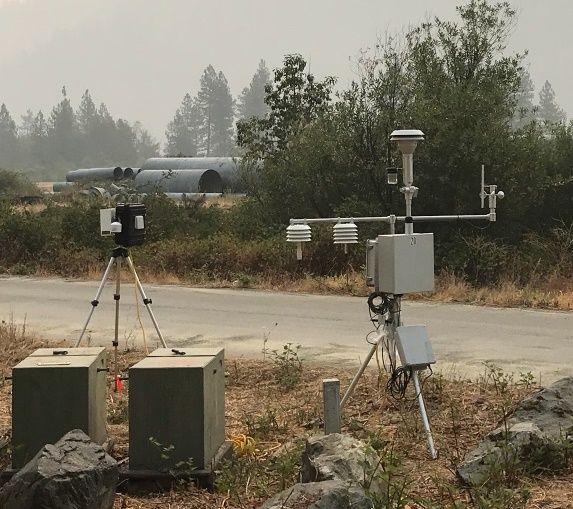
Positive Feedback

    • Over 7.4 million page views over the first 3 months
    • Numerous comments from public and government
      agencies welcoming the new information
      • “The EPA website change allows lower quality sensors to provide
        information that helps real people decide how to live their lives in a
        city threatened by smoke and catastrophic fires. It was a positive and
        very useful step.”
      • “I have asthma and the information on this site has helped me to
        make critical decisions about how to protect myself during the
        wildfires in Sonoma County this month August 2020. ….Overall, I give
        this an A grade for information in real-time to the public.”

8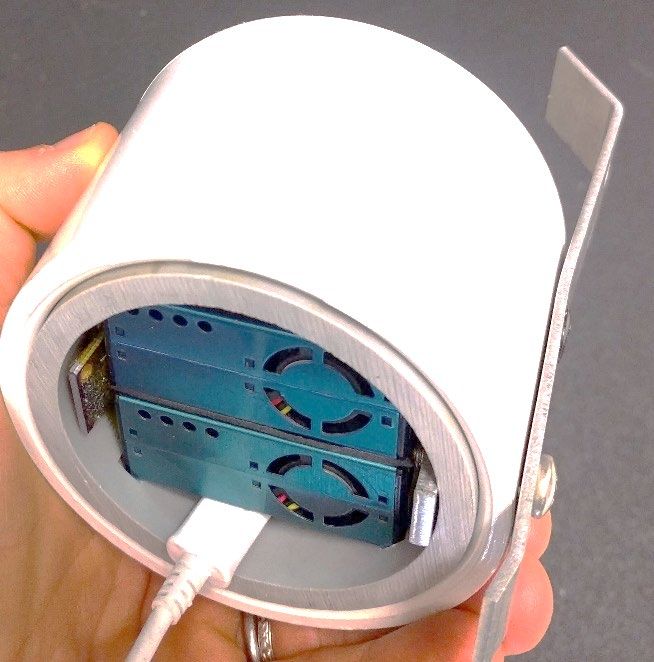
Next Steps for Fire and Smoke Map

     • Work on upgrades and improvements; some will be
       incorporated before the 2021 fire season
     • Map will remain as a pilot to allow us to investigate
    Next
       waysSteps
             to continue to improve the value of the
       information and display to the public
     • Consult with state, tribal, and local partners and EPA
       regional staff on map changes
     • Publish new version of the map before next fire
       season, targeting late July 2021
9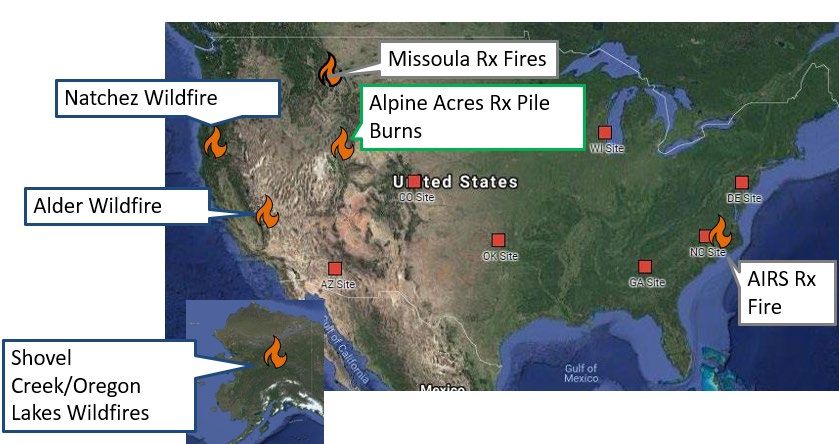
Responding to Map User Comments
     • Improving
        •   Underlying functionality of the webpage
        •   Ability of users to find FAQs
        •   Ease of navigation
        •   User experience for mobile users
     • Clarifying
        • Differences between the air quality information displayed on the Fire and Smoke map and the
          AirNow webpage
        • Differences between the values from the PurpleAir Sensors on the Fire and Smoke map and
          those on the PurpleAir website
        • FAQs
     • Exploring
        • Adding information on the map for actions people can take to protect themselves
        • Adding information on the air quality trends in their area
10
Planned Updates for the AirNow
Fire and Smoke Map
11 11EPA-USFS AirNow Fire and Smoke Map v1 (2020)
https://fire.airnow.gov
September 11, 2020 shown
Desktop: Mobile:
12Updates for 2021
Many changes are under development for 2021
Final version subject to change as testing and development continues
Specific changes include
• Updated correction factor
• Faster loading / less data usage
Large updates to backend
• Enhanced mobile experience
• Additional features
13Update: More Purple Air Sensors
• Number of Purple Air sensors has significantly increased since 2020
> +50 %
14Update: Easier to understand
Map Legend Visibility
• The map legend is being moved to
provide easier access and is now visible
upon opening to provide easier access
and to help users understand the map
Better Frequently Asked Questions (FAQs)
• The FAQs will be updated, expanded to
offer more information, and will be
easier to revise/clarify as needed
15Update: Easier to find the
info you are looking for
• When clicking on a monitor or
sensor, a new display highlights
the most pertinent information
• The first page provides a quick
overview; click through to see
details
16
Example onlyUpdate: A variety of ways to see the data
• Since everyone responds to
information in a different way,
offering many ways to view the
data is important
• Working to make this graphical
gauge similar to the AirNow
main site
17Update: Take advantage of the rapidly updating
low-cost sensor data
Primary Display = NowCast AQI; Updates Hourly
• Primary display will remain the PM2.5 NowCast Air Quality Index (AQI)
due to relationship with health messaging
• For permanent/temporary monitors, we only have hourly PM2.5 data
More Recent Conditions = Trending
• Use shorter time average / rapidly refreshed low-cost sensor data to
display more recent conditions (For permanent and temporary
monitors, use an average of nearby low-cost sensor data)
18Trend Example 19 Example only; not real data
Update: Fire Information Linked to Inciweb
     • Inciweb contains the latest incident information

20
Future: Addition of Other Air Sensors
• Accuracy and data availability criteria are being defined under which
we can consider bringing in other air sensor networks
• Any decision to add other sensor networks to the map will be done in
consultation with State, Local, and Tribal air monitoring agencies
• This will likely not happen in time for the start of the 2021 western
wildfire season
21Background on Air Sensors 22 22
Background: Collocation
• How do we determine the
performance of air sensors?
• Collocation: Running side by side with
trusted methods
• Why do we need to collocate sensors?
• Sensors often have systematic offsets
and may be influenced by relative
humidity or other external conditions
• How do we improve performance?
• Build corrections based on collocated
data to account for offsets
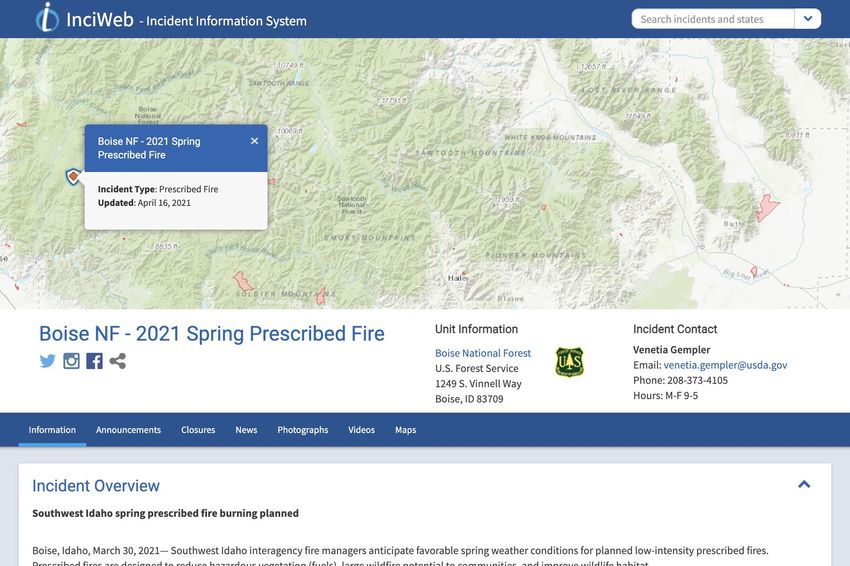
Air sensors (red circle) collocated with
a temporary smoke monitor during the
Natchez Fire (Happy Camp, CA)
23 Photo Credit: Lauren MaghranHow does this apply to PurpleAir?
• How we determined the performance
of PurpleAir sensors?
• Collocations across the US under typical
ambient and smoke impacted times
A & B channels
• How do we improve performance?
• We built a US-wide correction in 2019
• We developed data cleaning steps based
on the duplicate (A & B) channels
PurpleAir underside view
24Updating the
US-wide correction
25 252019
US-wide Correction Timeline
US-wide correction
built • Built and tested on
24-hr averaged data
from Federal
Reference and
Equivalent methods
(FRMs and FEMs)
• 16 States
Original US-wide correction
PM2.5 = 0.52*PAcf_1 - 0.086*RH + 5.75
26 https://doi.org/10.5194/amt-2020-4132019
US-wide Correction Timeline
US-wide correction
• Tested on 1-hr
built
smoke and
2020 ambient
Evaluated on smoke datasets
impacted datasets
from 2018 & 2019 Smoke Impacted
1-hr PurpleAir PM2.5 (µg m-3)
Smoke site
Ambient site
Correction
Cf_1
US-wide correction
27
FEM or near FEM PM2.5 (µg m-3) https://doi.org/10.3390/s201747962019
US-wide Correction Timeline
US-wide correction 1:1
• Collocation
built Strong
data captured
in 2020 underestimation
US-wide correction
2020
Evaluated on smoke spanned a
impacted datasets much larger
from 2018 & 2019 range of
concentrations
Summer 2020
Underpredicts at
extreme smoke Range captured
concentrations Pre-2020
282019
US-wide Correction Timeline
US-wide correction 1:1
• Collocation
built Strong
data captured
in 2020 underestimation
US-wide correction
2020
Evaluated on smoke spanned a
impacted datasets much larger AN EXTENDED
from 2018 & 2019 CORRECTION IS
range of
NEEDED!
concentrations
Summer 2020
Underpredicts at
extreme smoke Range captured
concentrations Pre-2020
29Past Work
• Lab studies have shown:
• Polynomial fit may be
better at higher
concentrations (Sayahi et
al. 2019)
• PurpleAir stops responding
at about 11,000 – 13,000
µg m-3, depends upon PM
composition and size (Zou
et al. 2019)
30Correction Requirements
• Fits full range
• Important so that the map can
be used during times of the
year with and without smoke
impacts
• Considers relative humidity
(RH) influence Higher PurpleAir
• Important since monitors response when
measure dry PM2.5 and RH can more humid
increase light scattering per
mass
• Simple is better
• Want model to be broadly
31 applicable and easy to interpretCorrection Development: Site identification
• Identify nearby sensor/monitor pairs
on the AirNow Fire and Smoke map in
smoke impacted areas (Aug-Oct 2020)
• Exclude some sites with poor
PM2.5 (µg m-3)
agreement and some distinct outlier
points
• Suspected issues with the sensor (e.g.,
poor performance leading to data
exclusion, mid-season replacement,
location uncertainty)
• Suspected issues with FEM and near-
FEM performance at extreme conditions
> 500 µg m-3
Example of site excluded due to likely FEM
32 error at elevated concentration 32Site Characteristics:
2020 Sites
• Experiencing smoke concentrations greater than 250 µg m-3
• Moderate range of temperature and relative humidity
• Range of ecosystems and fire conditions
Site Fire Date Range Concentration
2020 Range 1-hour
3
averaged (µg/m )
Atascadero, CA River – Dolan 08/01 - 10/19 -2-448
Bend, OR Beachie Creek 08/01 - 10/19 2-485
Bishop, CA Creek 08/01 - 10/20 2-496
Boise, ID Aged OR smoke 08/01 - 10/20 -4-158
Forks of Salmon, CA Red Salmon Complex 08/14 - 10/20 -5-1504
Hoopa, CA Red Salmon Complex 07/31 - 10/20 -5-1502
Keeler, CA Creek 08/01 - 10/20 0-260
Mammoth Lakes, CA Creek 08/01 - 10/19 1-1464
33 Oroville, CA North Complex 08/25 - 10/15 -5-1506Map of Smoke and Ambient Sites
• Included previous smoke
collocations
• Included typical ambient sites for
~1+ year
Ambient collocations
Site Date Range
Atascadero, CA 01/2018 - 10/2019
Davenport, IA 01/2019 - 10/2020
Decatur, GA 08/2019 - 08/2020
Denver, CO 08/2019 - 09/2020
Research Triangle Park, NC 08/2019 - 10/2020
Edmond, OK 08/2019 - 09/2020 Alaska
Missoula, MT 11/2019 - 07/2020
Phoenix, AZ 10/2019 - 07/2020
Sarasota, FL 05/2019 - 06/2020 Ambient 2018-2019 2020 smoke
Topeka, KS 03/2019 - 06/2020 smoke
34
Wilmington, DE 07/2019 - 06/2020Corrections Considered
• Considered a variety of terms From Simple:
• Linear, quadratic, and cubic fits US-wide correction: Ref = 0.52*PAcf_1 - 0.086*RH + 5.75
• PA, PA2, PA3
To complex:
• Relative humidity Ref = a x PA2 + b x PA2 x RH+ c x PA + d x PA x RH + e x RH + f
• RH
• Interaction between RH and PM2.5
• RH*PA, RH*PA2
• Piecewise fits
PurpleAir PM2.5
PurpleAir PM2.5
• Switch equations at a specific
concentration gap
• Targets:
• Reduce any gaps that may occur
• Limit to ≤ 2-piece equation if possible Reference PM2.5 Reference PM2.5
Gap between piecewise Well fitting piecewise
corrections corrections
35 PA = Reported PurpleAir cf_1 PM2.5 ConcentrationMethods: Model Evaluation Bins to evaluate
Performance
• Evaluate performance at each AQI breakpoint AQI Categories break points
• Important since AQI is the primary way risk is ±20%
communicated on the map 10-14 µg m-3
• Build and test using withholding
• Gives us a better idea of how the correction may 28-42 µg m-3
work on sites not included in our dataset
• It helps us avoid selecting too complicated of a
44-66 µg m-3
model
• Targets: 120-180 µg m-3
• Bias* ≤ ± 5% in each bin
• Reduce errorƚ in each bin 200-300 µg m-3
400-600 µg m-3
*Normalized mean bias error (NMBE) (calOSHA respirator)
36 ƚNormalized mean absolute error (NMAE)Final Correction
Use the US-wide correction until PAcf_1 exceeds
343 µg m-3 then use a quadratic fit
Low Concentration PM2.5 = 0.52 x PAcf_1 - 0.086 x RH + 5.75
PAcf_1 ≤ 343 µg m-3
High Concentration PM2.5 = 0.46 x PAcf_1 + 3.93 x 10⁻⁴ x PAcf_12 + 2.97
PAcf_1 > 343 µg m-3
37How does this change the PM2.5 estimates?
Example: Forks of Salmon
Better agreement
Monitor
over the full range of
concentrations
PurpleAir
updated
correction
PurpleAir
old
US-wide
correction
38 38How does this change the PM2.5 estimates?
Example: Forks of Salmon
Better agreement over
the full range of
concentrations Monitor
PurpleAir
Note: Other corrections updated
correction
available on PurpleAir.com look
very similar to the old US-wide PurpleAir
correction except the LRAPA1 old
US-wide
correction which underestimates correction
above 60 µg m-3
39 1LRAPA – Lane Regional Air Protection Agency 39How does this change the PM2.5 estimates?
• Better agreement over the full
range of concentrations
• Evaluation by breakpoint:
• Bias*: ±5%
• Errorƚ: ± 22%
*Normalized mean bias error (NMBE)
40 ƚNormalized mean absolute error (NMAE)How does this change the PM2.5 estimates?
• Better agreement over
the full range of
concentrations
• Evaluation by Note: It is challenging to truly
breakpoint: estimate error on the PurpleAirs
• Bias*: ±5% because:
• Errorƚ: ± 22% - Uncertainty in the monitors
- Potential distance between
PurpleAirs and monitors
- Variations between individual
sensors
*Normalized mean bias error (NMBE)
41 ƚNormalized mean absolute error (NMAE)Sensor Users FAQs 42
Why doesn’t my PurpleAir show up on the
                    Fire and Smoke Map?
• Indoor user label                            Temperature map           Example of
• Installed
How should I site my Air Sensor?
Top 5 siting considerations 2. Ideally >270° Siting Quality Control Assessment
free air flow - Review the data to determine if
1. Away from no less than 180°
the site may be impacted by a
PM sources at sensor
local source or environmental
- Dusty roads
- Building
conditions
exhausts - Does high time resolution data
- Barbecue 3. At least 1 m show spikes (e.g., indicative of a
grills above ground local source – smoking, cooking)?
- Fire pits Breathing zone Do spikes have a routine nature
- Smokers height better (e.g., indicative of cyclic operation
represents of an HVAC fan)?
exposure - Compare to a nearby reference, do
>1m
long term trends agree?
4. Away from
structures
If must be next Are you planning a collocation to develop a
to building, 5. Site with support
- WiFi/Cellular signal correction?
place on up wind See EPA’s sensor collocation guide for more siting criteria and
side - Power available
- Tamper resistant analysis tools
https://www.epa.gov/air-sensor-toolbox/air-sensor-collocation-
44 - Safe to install
instruction-guideWhat would be needed to have similar confidence
in a different sensor for this application?
• Need evaluations over the full range of conditions
• Typical ambient
•Take Home Messages
• The AirNow Fire and Smoke Map is a
useful tool to understand local PM2.5
conditions
• Shows sensors and monitors side by side
allowing users to better compare
• The quality assurance and correction
allow data from sensors to be comparably
displayed
• Gives users a consistent picture of air quality 9/15/20 9:48am ET
• The extended correction will allow sensors
to provide measurements comparable to
monitors over ~0-1500 µg m-3
1
46Resources & Publications
Additional resources and details about EPA's work with air sensors
http://www.epa.gov/air-sensor-toolbox
AirNow Fire and Smoke Map
https://fire.airnow.gov/
Project Publications:
Holder, A., A. Mebust, L. Maghran, M. McGown, K. Steward, D. Vallano, R. Elleman, and K. Baker, 2020. ‘Field Evaluation of Low-Cost
Particulate Matter Sensors for Measuring Wildfire Smoke’, Sensors. https://doi.org/10.3390/s20174796
Barkjohn (Johnson), K, B. Gantt, A. Clements, 2020 ‘Development of a United States Wide Correction for PM2.5 Data Collected with
the PurpleAir Sensor’, Atmospheric Measurement Techniques Discussion. https://doi.org/10.5194/amt-2020-413
Barkjohn (Johnson), K, A. Holder, S. Frederick, A. Clements, (in preparation) ‘PurpleAir PM2.5 US Correction and Performance During
Smoke Events’.
47 47Contacts
Ron Evans Karoline Johnson Barkjohn, PhD
Office of Air Quality Planning and Standards US EPA Office of Research and Development
US EPA Office of Air and Radiation Johnson.Karoline@epa.gov
firesmokemap@epa.gov
Andrea Clements, PhD
US EPA Office of Research and Development
Sim Larkin, PhD Clements.Andrea@epa.gov
AirFire Research Team
US Forest Service Amara Holder, PhD
Sim_Larkin@firenet.gov US EPA Office of Research and Development
Holder.Amara@epa.gov
This work would not have been possible without support from
partner state, tribal and local agencies, EPA regional offices and
other federal agencies including the National Park Service, US
Forest Service, and the Wildland Fire Air Quality Response Program.
48 The views expressed in this presentation are those of the authors and do not necessarily reflect the views or policies of the US
EPA or USFS. Mention of trade names or commercial products does not constitute endorsement or recommendation for use.USDA Forest Service AirFire Univ. of Washington–
AirFire
Q&A
EPA Office of Air
Quality Planning and
Standards Peter Lahm Sim Larkin, PhD Stuart Illson
EPA Office of Research and Development
Ron Evans
Karoline Johnson Barkjohn, PhD Amara Holder, PhD Andrea Clements, PhD
49Additional detailed slides 50
Full list of considered equations
     • US-wide correction
         • Ref=5.72+PA*0.524-0.0852*RH

     • Linear with RH (PA*RH PA~
What are PurpleAir sensors?
PurpleAir Data
• 2 Plantower PMS5003 PM sensor (channels A & B)
• Channels alternate 10 s sampling intervals
• Reports 2 min averages (previously 80 s)
A & B channels
PurpleAir Data Outputs
• Particle count by size
• PM1, PM2.5, PM10 with 2
correction factors:
• CF=atm (lower concentrations) 1:1 PurpleAir underside view
PurpleAir map outdoor sensors
• CF=1 (higher concentrations)
PurpleAir map indoor sensors
• Internal temperature, relative
humidity, pressure (BME280 Cf_atm “Outdoor”
sensor)
522020 Fire Season Site Details
Targeted sites: Site State/Agency Instrument Fire Date Range Concentration
2020 Range 1-hour
• PurpleAir averaged
collocated or
3
(µg/m )
nearby monitor Atascadero, CA CA/SLOCAPCD BAM1020 River – Dolan 08/01-10/19 -2-448
Bend, OR OR/DEQ Nephelometer Beachie Creek
• Limited spatial Bishop, CA (NCORE site?) CA/GBUAPCD T640x Creek
08/01-10/19 2-485
variation of PM2.5 Boise, ID ID/DEQ BAM1020 Aged OR smoke
08/01-10/20 2-496
08/01-10/20 -4-158
• Experiencing Forks of Salmon, CA CA/SCAQMD E-BAM Red Salmon Complex 08/14-10/20 -5-1504
smoke Hoopa, CA CA/NCUAQMD E-BAM Red Salmon Complex 07/31-10/20 -5-1502
concentrations Keeler, CA CA/GBUAPCD R&P TEOM 1400a Creek 08/01-10/20 0-260
greater than 250 Mammoth Lakes, CA CA/GBUAPCD T640x Creek 08/01-10/19 1-1464
µg/m3 Oroville, CA CA/BCAQMD E-BAM North Complex 08/25-10/15 -5-1506
SLOCAPCD =San Luis Obispo County Air Pollution Control District; DEQ = Department of Environmental Quality; GBUAPC= Great Basin
Unified Air Pollution Control District; SAQMD = Siskiyou County Air Quality Management District, NCUAQMD = North Coast Unified Air
53 Quality Management District ; BCAQMD = Butte County Air Quality Management DistrictAmbient Site Details
Site State/Agency Instrument Date Range Concentration
Range 1-hour
averaged
3
(µg/m )
• Captures various Atascadero CA/SLOCAPCD BAM1020
01/01/2018-
10/24/2019
-5-108
parts of the country
01/03/2019-
Davenport IA/SHL T640 10/31/2020
0-243
08/01/2019-
Decatur GA/DEP T640 0-64
• Some sites do
08/31/2020
08/14/2019-
Denver CO/DPHE T640 09/30/2020
0-206
experience smoke Durham NC/EPA T640x 08/01/2019-
10/14/2020
1-45
impacts though not Edmond OK/DEQ T640 08/01/2019-
09/30/2020
1-91
smoke specific sites Missoula MT/DEQ BAM1020 11/22/2019-
07/28/2020
-6-27
10/28/2019-
• Grass fires in KS Phoenix AZ/Maricopa TEOM 07/31/2020
-2-550
05/30/2019-
Sarasota FL/SCG T640 1-98
• Residential burning in 06/30/2020
03/12/2019-
Topeka KS/DHE T640
AZ 06/30/2020
07/27/2019-
0-202
Wilmington DE/DAQ T640 1-44
• Most sites 1 year+
06/30/2020
SLOCAPCD =San Luis Obispo County Air Pollution Control District; SHL = State Hygienic Laboratory; DEP =
Department of Environmental Protection; DPHE = Department of Public Health and Environment; EPA =
Environmental Protection Agency; DEQ = Department of Environmental Quality; Maricopa = Maricopa County Air
Quality Department; SCG = Sarasota County Government; DHE = Department of Health and Environment; DAQ =
54 Division of Air QualityMethods: Building corrections using withholding
Examples
• For each correction considered: Withholding by
Withholding
• Build an equation based on all but one site by site week of year
• Fit to the withheld site Build a quadratic
Build a quadratic
equation based on all
• Build a corrected dataset where each site equation based on all
but the first week of
sites but Oroville
has been built using withholding January
• Repeat the process using withholding by
week of the year Ref=a x PA2 + b x PA + c Ref=a x PA2 + b x PA + c
Note: Withholding is important!
Apply the correction Apply the correction
to the Oroville to the first week of
It gives us a better idea of how the correction dataset January dataset
may work on sites not included in our dataset
(x28) (x52)
Repeat for the Repeat for the other
It helps us avoid selecting too complicated of a other 27 sites 51 weeks of the year
model
Repeat for each
55
model formFinal Correction (cf_atm) 2-min comparison of cf_1 and cf_atm data
• The PurpleAir US-wide & extended corrections
PurpleAir, Plantower cf=1 [Higher]
were developed using cf=1 [higher]
• Cf=1 is more strongly correlated with FRM/FEM/near
FEM over the full concentration range
• If cf_atm must be used due to API limitations this
piecewise equation may be used
• There may be slightly more uncertainty at the
breakpoint (~30 µg m-3 as measured by the PurpleAir, Plantower cf=atm [Lower]
reference) depending on what averaging interval
this is applied to Low Concentration PM2.5 = 0.52 x PAcf_atm - 0.086 x RH + 5.75
PAcf_atm < 50 µg m
-3
Mid Concentration PM2.5 = 0.786 x PAcf_atm - 0.086 x RH + 5.75
50 µg m-3≤PAcf_atm 229 µg m-3You can also read