Lingfield Fire Station - Station Plan 2020/21 - Surrey County Council
←
→
Page content transcription
If your browser does not render page correctly, please read the page content below
Lingfield Fire
Station
Station Plan 2020/21
Introduction – Lingfield Station Plan
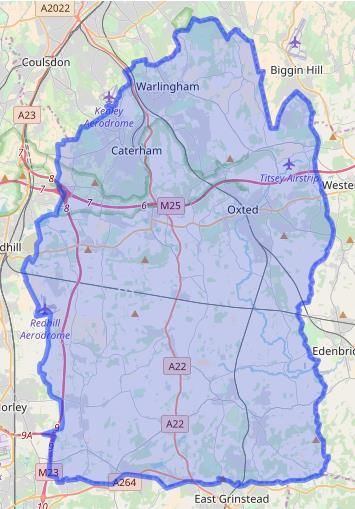
Welcome to Surrey Fire and Rescue Services’ Station Plan for Lingfield, which is situated in the
district of Tandridge, which covers the towns of Warlingham, Caterham, Oxted, Godstone and
Lingfield.
As part of our commitment to delivering Business and Community Safety services to Surrey, Surrey
Fire and Rescue Service produces tailored station plans to show what our local priorities are and how
we are working with other agencies in the area to
improve the local quality of life. In order to do this
we set specific goals/benchmarks in each area to
address the issues particularly relevant to that area.
The Station Plan is a public document and is
available to everybody - for our staff, it gives clear
direction in setting annual priorities and projects.
For the public, it gives a clear indication of what we
will be focusing on in the local area and what we
aim to achieve as a result. It allows us to address
risks at a local level, putting the right resources into
the right areas to ensure we reduce the risks faced
by everybody in that district. It also enables us to
work with other agencies such as the police and
health services to ensure that, where a local trend
cannot be resolved by one service alone, we work
together to achieve improved outcomes for the
community.
Surrey Fire and Rescue Service also recognises that,
in order to achieve our strategic aims and objectives, we must have a risk managed and diverse
approach, tailored to local needs, that is affordable and provides value for money.
The Station Plan supports both the principal aim of the Service (as detailed in our Public Safety
Plan/Integrated Risk Management Plan) to deliver high performing services necessary to keep our
communities safe in the modern world whilst improving the value for money we offer as the
financial climate public services find themselves in continues to tighten.
In 2020/21 we will be prioritising the local delivery of certain key business and community safety
activities, in order to improve the safety of our staff and residents, while providing maximum use of
our available time when not responding to emergencies. The priorities are:
1. Operational Premises Surveys (OPS) – These are premises known to the Service that form
part of our risk-based inspection programme, aiding firefighter familiarisation and safety.
We will survey 100% of those premises scheduled for inspection.
2. Safe and Well Visits (SAWV) – This community safety initiative targets vulnerable people in
domestic premises, aiming to make them safer and more resilient.
3. Thematic Audits/Initial Premises Surveys (IPS) – These audits/surveys ensure that simple
premises are legally compliant and enables firefighter familiarisation with new/non-OPS
premises.
4. Other Localised Risk-Based Activities, including road safety, water safety, etc.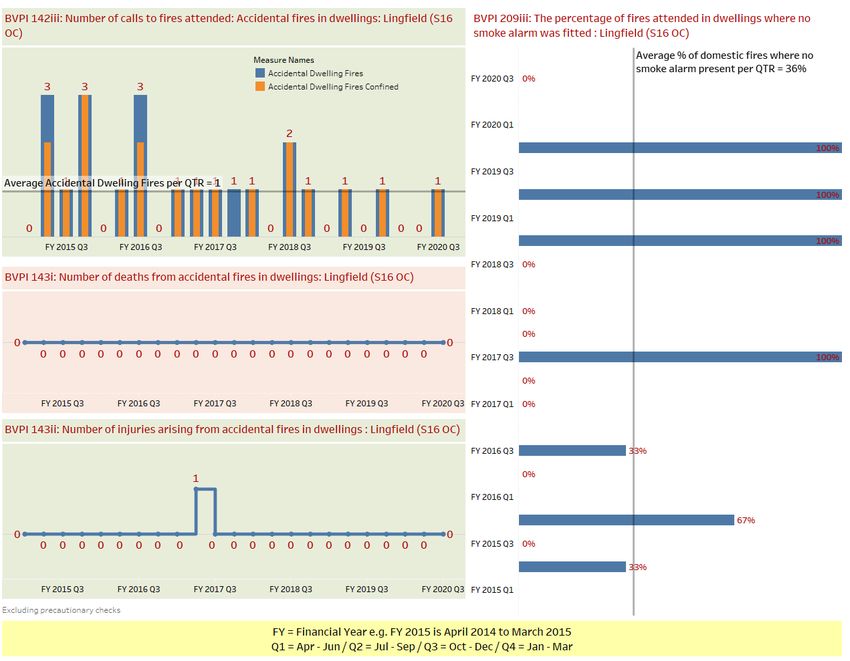
The County of Surrey
Geography

Surrey is approximately 648 sq miles (1,679 sq km) in size. It is landlocked and has no
coastline. Surrey is bordered by the counties of Greater London, Kent, East Sussex, West Sussex,
Hampshire and Berkshire.

Population

According to the last census (2011) the population of Surrey was 1.13 million; recent estimates state
that this has grown to 1.19m. The county rates highly in environmental terms. Surrey is England’s
most wooded county and over 70% of its land lies within the greenbelt. However, per square mile, it
is the most densely populated shire county in England. The most densely populated area is Epsom
and Ewell, with an average population of over 20 people per hectare of land.

Transport

Surrey is served by two of the world’s largest international airports on its borders, Gatwick and
Heathrow. Most major towns in Surrey have connections by rail to central London with a frequency
of under one hour.

The county has more cars per mile of road than any other UK shire, containing some of the country's
busiest arterial routes such as the M3, A3, M25 and M23. There are more than 3,000 miles of
highway in the county, including almost 70 miles of motorway.

Employment

The main employment is concentrated in the central towns of Guildford and Woking, to the west in
Camberley and Staines and to the East in Leatherhead, Dorking and Reigate. Employment levels are
very high, although the county’s commercial premises have varying levels of occupancy. The
unemployment figure remains under 1%.

Education

There are approximately 288,678 children and young people aged 0 to 19 in the county. There
are over 700 schools and colleges in Surrey providing education up to compulsory attendance age,
and education is Surrey County Council's single biggest area of expenditure. The county has three
established Universities: Surrey, Royal Holloway and the University for the Creative Arts. Together
these universities have nearly 33,000 undergraduate and postgraduate students.

Politics

The county is run by a two-tier system comprised of the County Council and 11 borough/district
councils. The political composition of Surrey County Council is currently: 58 Conservative, 9 Liberal
Democrats, 11 Residents' Associations/Independents, 1 Brexit Party, 1 Labour and 1 Green. There
are 81 county councillors in total.
Living in Tandridge

                      87,496 people in
Population size
                                                                             24,819 hectares
                      36,051 households             Geographical
                                                        size
                                                                          Population         Below Surrey
                                                                            = 3.5           average of 7.2
                            16,940                                         Business
   Number of                                                                                 Below Surrey

   businesses                                           Density             = 0.7           average of 1.9

                                   Below Surrey
                        4          average of 16                             32        Around Surrey
Number of high                                     Numbers killed and
                                                                                       average of 32 per
                                                                                       borough/district
 rise premises                                     seriously injured on
   (5 floors+)                                     roads 2014 to 2018

                      Zero heathland
                                                                               Urban with
                      and significant
   Extent of                                                                Significant Rural
heathlands and          woodland                    Rural-Urban
  woodlands                                         Classification

 Average cars
                             1.5                                            21%          Around Surrey
                                                    Those aged 65                        average of 19%
per household                                      and over as % of
                                                     population

                      29%      Around Surrey                                27%         Around Surrey
% of pensioners                average of 30%
                                                   % single person                      average of 28%
  living alone                                       households

Prevalence of some     69                          % of population          14%
   mental health
disorders (per 1000            Around Surrey        with mobility                       Around Surrey
      people)                  average of 73            issues                          average of 14%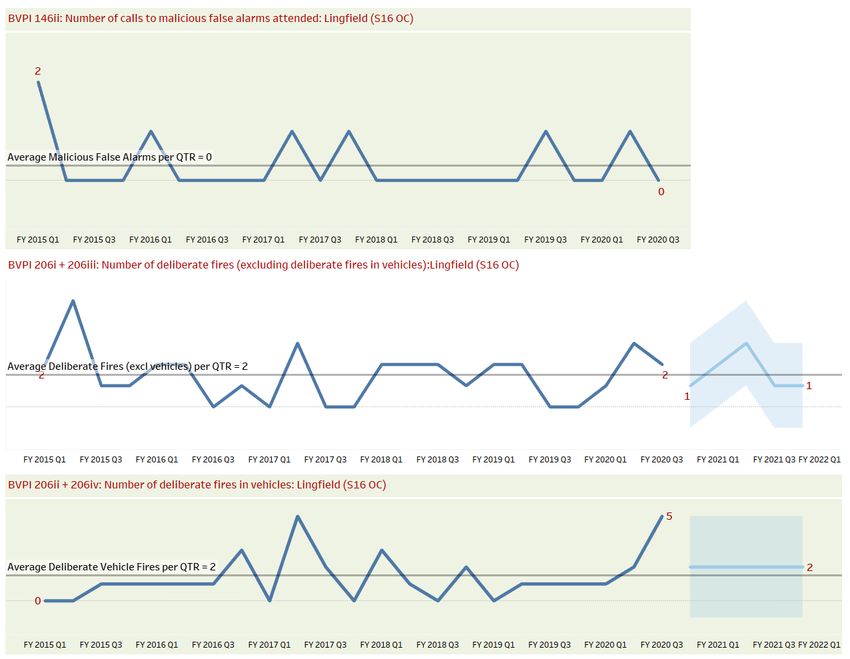
Above Surrey
     % people           0.7%          Above Surrey
                                    average of 0.4%
                                                      % people who       18%        average of 14%
  registered with                                        smoke
learning disabilities
    and autistic
spectrum disorders

                                                                                     Above Surrey
 Persons with           1,067                                            72          average of 41
                                Around Surrey
alcohol related                 average of 1,082
conditions (per                                          Number of
100,000 people)                                       listed buildings

  Number of                     5                                             Gatwick
 railway lines                                         Proximity to
    running                                              airports
 through area
                          Low areas of
                         higher risk and
                                                        Number of
                                                                                1
 Likelihood of          very Low areas of
    flooding                                          reservoirs and
                           middle risk                    lakes
Summary of incidents attended,
activities undertaken and standards
met by Lingfield 2019/20
Performance Area Result
Business and Community Safety Activities Undertaken
Business Safety Audits [Borough/District level data capture] 2
Consultations (Building Regulations, Licensing Applications, Post Event Reviews etc.)
99
[District level data capture]
Incidents Attended
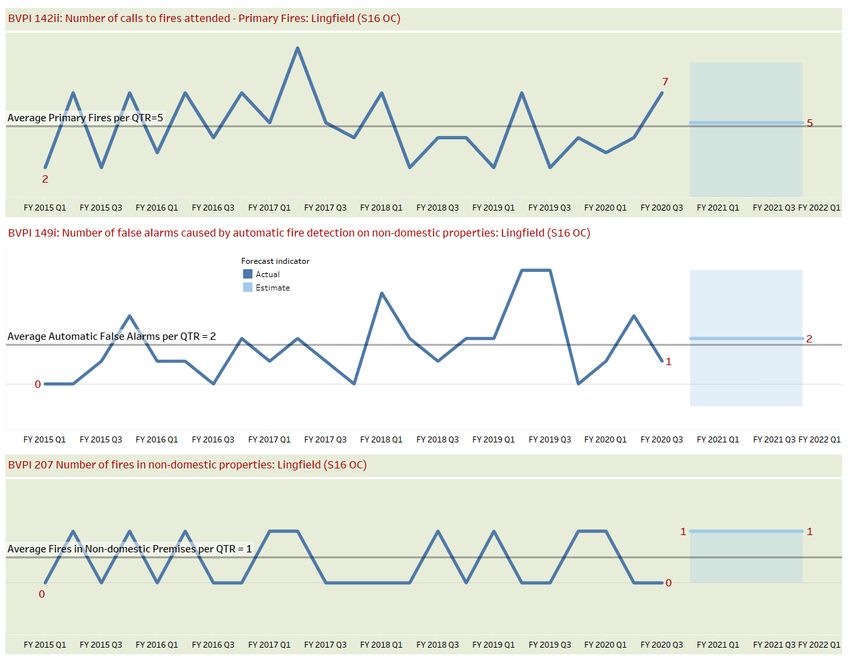
BVPI 142ii: Number of calls to fires attended - Primary Fires (excl prisons) 14
BVPI 142iii: Number of calls to fires attended: Accidental fires in dwellings 2
BVPI 143i: Number of deaths from accidental fires in dwellings 0
BVPI 143ii: Number of injuries (excluding precautionary checks and first aid) arising
0
from accidental fires in dwellings
BVPI 144: Percentage of accidental dwelling fires confined to room of origin 100%
BVPI 146ii: Number of calls to malicious false alarms attended 1
BVPI 149i: Number of false alarms caused by automatic fire detection 5
BVPI 206i + 206iii: Number of deliberate fires (excluding deliberate fires in vehicles) 6
BVPI 206ii + 206iv: Number of deliberate fires in vehicles 8
BVPI 207 Number of fires in non-domestic properties (excl prisons) 1
BVPI 209iii: The percentage of fires attended in dwellings where no smoke alarm was
50%
fitted
Standards Achieved
Average turnout time (hh:mm:ss) 00:04:28
Organisational Health
Number of workplace safety events 0
Number of vehicle collisions due to driver behaviour 0
Percentage of safety events where management action has been completed within 14
n/a
days
Attendance management - days lost per person 2.1
Attendance management – hours lost per person (days multiplied by 7.71) 16.2Business and Community Safety
Surrey Fire and Rescue Service sets out in its Station Plan the business and community safety
initiatives that it feels will reduce risk in the community and make Elmbridge a safer place in which
to live and work. To promote understanding of these initiatives and allow partners to become
involved in them where applicable a short précis of each is provided in the following paragraphs.
The Service continues to educate the public through community safety campaigns and SAWVs
(which replaced the previous Home Fire Safety Visits) initiative, to drive down the numbers of
accidental dwelling fires and Road Traffic Collisions (RTCs). Our SAWV is designed to cover fire
safety, road safety, environment safety and by using the One Stop Surrey referral process, cover a
range of health and social issues that support independent living. The SAWV service also supplies a
range of equipment, including smoke alarms, hard of hearing alarms, fire retardant bedding and
advises on Telecare alarms and sprinklers. Surrey Fire and Rescue Service (SFRS) continues to work
with the Surrey Health and Wellbeing Board members, such as Adult Social Care, the NHS, public
health and Age UK Surrey, to develop the content of SAWVs to reduce risk to the elderly.
SFRS has an important part to play in improving the life chances for young people. It works with
partners in a number of different areas including the county’s Youth Justice Service and the
Educational Welfare Service who identify young people considered at risk of falling out of education
and/or becoming involved in anti-social behaviour and crime. SFRS co-developed and deliver the
Youth Engagement Scheme to give these young people the opportunity to develop practical and
social skills through a number of different activities.
Further examples of other effective community safety activities include:
Keeping YOU safe from Fire (High Risk Vulnerable People)
Dementia Awareness
Fire Safety Education in Schools
Road Safety (Drive SMART and Safe Drive Stay Alive)
Water Safety
Youth Engagement Scheme
FireWise (juvenile fire setters)
Safeguarding Vulnerable People
Arson Reduction
Ride It Right
Biker Down
There is still more that can be done; such as the opportunity for SFRS to tap into and support wider
business and community safety agendas across the other council services, such as Adult Social Care,
to best utilise the service’s skills, knowledge and experience for the greater benefit of communities.Performance Monitoring 2020/21: Business & community safety activities and response capability
RAG
Station Goal Q1 Q1 Q2 Q2 Q3 Q3 Q4 Q4 Status
rea to measure performance against
(by annum) Target Actual Target Actual Target Actual Target Actual (based upon YTD
forecast against
annual Goal)
Average Turnout time On-call 360 seconds 360 360 360 360
Number of workplace safety events 3 1 2 3 3
Number of vehicle collisions due to driver behaviour Count only
Percentage of safety events where management action has been completed
At least 95% 95% 95% 95% 95%
within 14 days
Attendance management - days lost per person 6.5 1.6 3.3 4.9 6.5
Attendance management - hours lost per person (days multiplied by 7.71) 50 12 26 38 50
Station Open Day - At least one individual /combined per station
Fitness tests completed At least 95% 24% 47% 71% 95%
Fitness tests passed At least 95% 95% 95% 95% 95%
3 yearly medicals in date 100% 100% 100% 100% 100%
Operationally fit ‘In Ticket’ for Emergency Fire Appliance Driving 95% 95% 95% 95% 95%
Operationally fit ‘In Ticket’ for Road Traffic Collision Rescues 95% 95% 95% 95% 95%
Operationally fit ‘In Ticket’ for Fire Behaviour Training 95% 95% 95% 95% 95%
Operationally fit ‘In Ticket’ for Working at Heights 95% 95% 95% 95% 95%
Operationally fit ‘In Ticket’ for Incident Command System Level 1 95% 95% 95% 95% 95%
Operationally fit ‘In Ticket’ for Breathing Apparatus 95% 95% 95% 95% 95%
Operationally fit ‘In Ticket’ for Immediate Emergency Care Responder 95% 95% 95% 95% 95%
Status Description
Red The measure has not achieved its target by a margin greater than 10%. Robust actions are in place to bring performance back on track.
Amber The target has almost been reached – this is defined as being within 5% of the agreed target. Robust actions are in place to bring performance back on track.
Green The measure has achieved its target OR the measure is on track to achieve its target.Tracking of fire incidents over time The charts on the next three pages show numbers of incidents occurring over time within the Lingfield Station ground. Where data is available it is showing from 1 April 2014 through to 31 December 2019. In many cases the charts also include a line to show the average number of incidents per quarter (3 month period) over this period of time. Where possible some forecast figures up to 31 March 2021 are also included (line within the blue shading). In a couple of cases the charts show factors surrounding a domestic dwelling fire: how well the fire was confined, and whether a working smoke alarm was found to be present.
A. Fires in dwellings
B. Primary (major) fires, and automatic false alarms / fires in non-domestic properties
C. Deliberate fires and malicious calls
Commentary (provided by Assistant Group Commander(S) responsible for station plan to comment on performance in each area)
Lingfield Fire Station Action Plan
Action Plan 2020/21

               Priority Area                                                       Activity                                      Lead Officer
                                                    Targeted work to meet community needs and deliver a risk based fire safety
          Community Risk Reduction
                                                                            inspection programme

                  Narrative                                                        Initiative                                       Leads
The people of Surrey are more likely to be killed
or injured on our roads than they are from any
involvement with fire. Surrey Fire and Rescue can
help reduce RTC’s through targeted education,
response and prevention work.
An important part of reducing risk to both our
personnel and the community is by ensuring that
we offer effective water rescue capabilities and
associated community risk reduction.
Engage with the local community about the
effects on the environment and climate change,
such as flooding and wildfire.
An important part of reducing risk to both our
personnel and the community is by ensuring all
our information is up to date and by enforcing
statutory fire safety requirements.
We will provide targeted schools education and
youth engagement activities to ensure that both
the risk within and anti-social behaviour that
affects the community are reduced.
Priority Area Activity Lead Officer
Enhance integration and meaningful Work with partner organisations to assist in responding to an increased demand for
collaboration with other services. services.
Narrative Leads
Initiative
By supporting collaboration and works closer
with partner agencies at a local level there is an
opportunity to improve community
Safety, and add public value.
Priority Area Activity Lead Officer
Reduction in number and severity of Accidental Targeted community safety work to reduce the risk in people’s homes and limit the
Dwelling Fires impacts of fire on the community.
Narrative Leads
Initiative
Whilst ownership of smoke alarms is relatively
high in Surrey, this ownership does not fall
evenly throughout the community. Free SAWVs
provide an opportunity for fire service personnel
to visit residents within the district of Tandridge.
Our targeted campaigns will ensure that we visit
the most vulnerable members of the community
to ensure the risk of fire is reduced and that they
are safe in their homes.
Wherever possible we will develop meaningful
partnerships that enable us to reach, educate,
improve the safety and welfare and increase
smoke alarm ownership amongst those members
of our community whom ourselves or our
partners consider to be at a higher risk.Priority Area Activity Lead Officer
Targeted work to reduce the number of false alarm calls. This includes both automatic
Reduction in number of Unwanted Calls
fire alarm and hoax calls.
Narrative Initiative Leads
The vast majority of calls to automatic fire alarms
are statistically proven not to require an
emergency response. Steam, cooking, fumes,
deliberate misuse of the system or poor design
together with a lack of maintenance are often
causes of these false alarms.
These calls take the fire engines away from more
essential work and can have a negative effect on
local business continuity. Unnecessary
activations can also lead to complacency
amongst occupants of the premises.
Priority Area Activity Lead Officer
Reduction in Deliberate Fires Targeted work to reduce the number of deliberately set fires
Narrative Initiative Leads
Deliberately set fires are an indication of anti-
social behaviour. They lead to injury or loss of
life, close down businesses, damage the
environment and often cause the unnecessary
loss of community amenities.
We want to reduce the deliberate car fires that
are a continuing problem. Car fires are a result of
theft of vehicles, anti-social behaviour and
deliberate act.Priority Area Activity Lead Officer
Narrative Initiative Leads
Appendix A – Station Plan Local Engagement
Date Description of Group FeedbackYou can also read