Estimation of Unregulated Monthly, Annual, and Peak Streamflows in Forest City Stream and Lake Levels in East Grand Lake, United States-Canada ...
←
→
Page content transcription
If your browser does not render page correctly, please read the page content below
Prepared in cooperation with the International Joint Commission

Estimation of Unregulated Monthly, Annual, and Peak
Streamflows in Forest City Stream and Lake Levels
in East Grand Lake, United States-Canada Border
Between Maine and New Brunswick

Scientific Investigations Report 2018–5044

U.S. Department of the Interior
U.S. Geological Survey
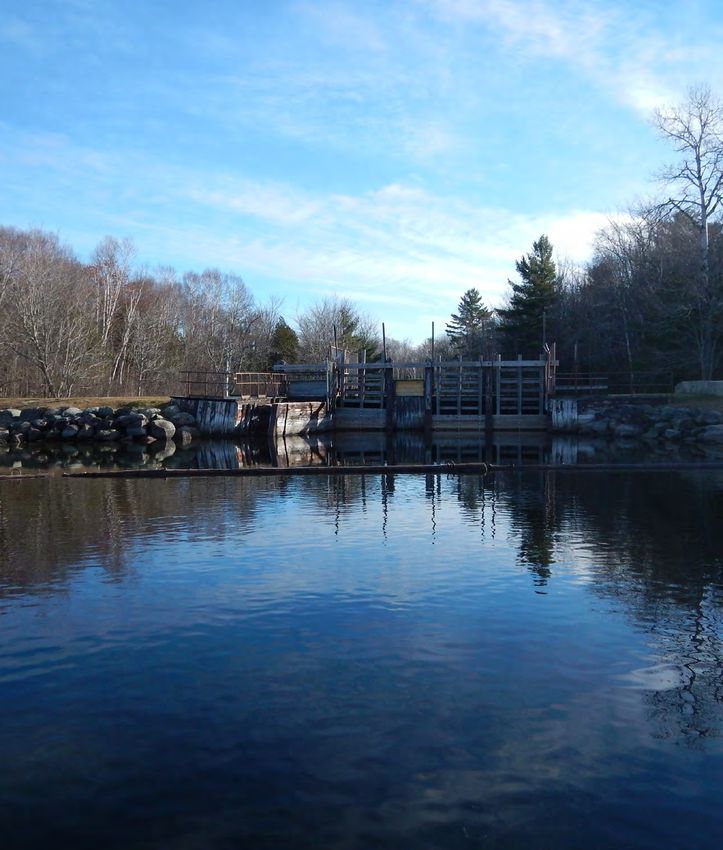
Cover. Forest City Dam, Forest City, Maine, November 18, 2015. Photograph by Jeff Kinsey, U.S. Geological Survey.
Estimation of Unregulated Monthly, Annual,
and Peak Streamflows in Forest City
Stream and Lake Levels in East Grand Lake,
United States-Canada Border Between
Maine and New Brunswick

By Pamela J. Lombard

Prepared in cooperation with the International Joint Commission

Scientific Investigations Report 2018–5044

U.S. Department of the Interior
U.S. Geological Survey
U.S. Department of the Interior
RYAN K. ZINKE, Secretary

U.S. Geological Survey
William H. Werkheiser, Deputy Director exercising
      the authority of the Director

U.S. Geological Survey, Reston, Virginia: 2018

For more information on the USGS—the Federal source for science about the Earth, its natural and living
resources, natural hazards, and the environment—visit https://www.usgs.gov or call 1–888–ASK–USGS.
For an overview of USGS information products, including maps, imagery, and publications,
visit https://store.usgs.gov.

Any use of trade, firm, or product names is for descriptive purposes only and does not imply endorsement by the
U.S. Government.

Although this information product, for the most part, is in the public domain, it also may contain copyrighted materials
as noted in the text. Permission to reproduce copyrighted items must be secured from the copyright owner.

Suggested citation:
Lombard, P.J., 2018, Estimation of unregulated monthly, annual, and peak streamflows in Forest City Stream and lake
levels in East Grand Lake, United States-Canada border between Maine and New Brunswick: U.S. Geological Survey
Scientific Investigations Report 2018–5044, 8 p., https://doi.org/10.3133/sir20185044.

ISSN 2328-0328 (online)
iii
Contents
Abstract............................................................................................................................................................1
Introduction.....................................................................................................................................................1
Data Collection and Analysis.......................................................................................................................1
Historical Streamflow and Lake Level Data .....................................................................................3
Estimates of Unregulated Streamflows ............................................................................................3
Field Surveys..........................................................................................................................................5
Modeled Unregulated East Grand Lake Levels................................................................................5
Summary..........................................................................................................................................................7
Acknowledgments..........................................................................................................................................7
References Cited............................................................................................................................................7
Figures
1. Map showing the East Grand Lake study area in Maine, United States, and New
Brunswick, Canada.......................................................................................................................2
2. Graph showing historical regulated monthly mean streamflows at Forest City,
Maine, Environment Canada streamflow monitoring station 01AR011 from 1975 to
2015, and estimated unregulated monthly mean streamflows calculated by using
regression equations....................................................................................................................6
3. Graph showing historical lake levels at East Grand Lake at Forest City, Maine,
Environment Canada monitoring station 01AR009 from 1969 to 2016, and
unregulated mean monthly lake levels calculated by using a hydraulic model. ...............6
Tables
1 Historical regulated monthly mean streamflows at Forest City, Maine, Environment
Canada streamflow monitoring station 01AR011 from 1975 to 2015, and unregulated
monthly mean streamflows calculated with Dudley (2015) regression equations and
Dudley (2004) regression equations. .........................................................................................3
2. Historical monthly mean lake levels at Grand Lake at Forest City, Maine,
Environment Canada monitoring station 01AR009 from 1969 to 2016, and monthly
mean lake levels associated with unregulated flows calculated by using a
hydraulic model..............................................................................................................................4
3. Drainage basin characteristics of East Grand Lake in Maine, United States, and
New Brunswick, Canada, as determined through the U.S. Geological Survey web
application StreamStats...............................................................................................................4
4 Unregulated flood flows for Forest City Stream at Forest City, Maine, calculated
with regression equations............................................................................................................5
5. East Grand Lake levels associated with unregulated flood flows calculated by
using a hydraulic model, Maine, United States, and New Brunswick, Canada..................7iv
Conversion Factors
U.S. customary units to International System of Units
Multiply By To obtain
foot (ft) 0.3048 meter (m)
mile (mi) 1.609 kilometer (km)
square mile (mi2) 2.590 square kilometer (km2)
cubic foot per second (ft3/s) 0.02832 cubic meter per second (m3/s)
International System of Units to U.S. customary units
Multiply By To obtain
meter (m) 3.281 foot (ft)
kilometer (km) 0.6214 mile (mi)
square kilometer (km2) 0.3861 square mile (mi2)
cubic meter per second (m3/s) 35.31 cubic foot per second (ft3/s)
Datum
Vertical coordinate information is referenced to the North American Vertical Datum of 1988
(NAVD 88).
Horizontal coordinate information is referenced to the North American Datum of 1983 (NAD 83).
Elevation, as used in this report, refers to distance above the vertical datum.
Abbreviations
ADCP acoustic Doppler current profiler
EC Environment Canada
HEC–RAS Hydrologic Engineering Center’s River Analysis System
PRESS prediction error sum of squares
TRDI Teledyne RD Instruments
USGS U.S. Geological SurveyEstimation of Unregulated Monthly, Annual, and Peak
Streamflows in Forest City Stream and Lake Levels in East
Grand Lake, United States-Canada Border Between Maine
and New Brunswick
By Pamela J. Lombard
Abstract in Canada. East Grand Lake (referred to as Grand Lake by
Environment Canada) drains an area of 133 square miles (mi2)
The U.S. Geological Survey, in cooperation with the (344 square kilometers [km2]) in the upper part of the St. Croix
International Joint Commission, compiled historical data on River Basin (fig. 1). The impoundment at its outlet (Forest
regulated streamflows and lake levels and estimated unregu- City Dam) provides storage for hydropower operations. Mini-
lated streamflows and lake levels on Forest City Stream mum streamflows in Forest City Stream are maintained for
at Forest City, Maine, and East Grand Lake on the United environmental compliance. Forest City Stream runs between
States-Canada border between Maine and New Brunswick the outlet of East Grand Lake and Spednic Lake. The U.S.
to study the effects on streamflows and lake levels if two Geological Survey (USGS), in cooperation with the Interna-
or all three dam gates are left open. Historical regulated tional Joint Commission, estimated unregulated streamflow in
monthly mean streamflows in Forest City Stream at the outlet Forest City Stream and lake levels in East Grand Lake in the
of East Grand Lake (referred to as Grand Lake by Environ- interest of understanding streamflow and lake level conditions
ment Canada) fluctuated between 114 cubic feet per second in the basin in the event that the gates at the dam are left open.
(ft3/s) (3.23 cubic meters per second [m3/s]) in November and This report presents historical streamflow data and
318 ft3/s (9.01 m3/s) in September from 1975 to 2015 accord- estimates of unregulated monthly and annual streamflows
ing to Environment Canada streamgaging data. Unregulated and flood flows for Forest City Stream at the outlet of East
monthly mean streamflows at this location estimated from Grand Lake, calculated by statistical methods. The report also
regression equations for unregulated sites range from 59.2 ft3/s presents historical East Grand Lake level data and estimates of
(1.68 m3/s) in September to 653 ft3/s (18.5 m3/s) in April. levels, as calculated from hydraulic modeling and bathymet-
Historical lake levels in East Grand Lake fluctuated between ric data, associated with the unregulated streamflows and the
431.3 feet (ft) (131.5 meters [m]) in October and 434.0 ft opening of the gates at the dam.
(132.3 m) in May from 1969 to 2016 according to Environ-
ment Canada lake level data for East Grand Lake. Average
monthly lake levels modeled by using the estimated hydrol-
ogy for unregulated flows, and an outflow rating built from a
Data Collection and Analysis
hydraulic model with all gates at the dam open, range from
Hydrologic and hydraulic data collection and analyses in
427.7 ft (130.4 m) in September to 431.1 ft (131.4 m) in April.
this study included the compilation of historical streamflows
Average monthly lake levels would likely be from 1.8 to 5.4 ft
in Forest City Stream and lake levels in East Grand Lake, cal-
(0.55 to 1.6 m) lower with the gates at the dam opened than
culations using regression equations to estimate unregulated
they have been historically. The greatest lake level changes
streamflows at this site, and differential leveling and bathymet-
would be from June through September.
ric surveys to define the Forest City Dam outlet structure. The
data were used to build a Hydrologic Engineering Center’s
River Analysis System (HEC–RAS) hydraulic model at the
Introduction outlet dam, for a run condition with the gates open, to compute
unregulated lake levels at this site. Lake bathymetry data and
The St. Croix River forms the border between eastern dam survey data from this study are available as a USGS data
Maine in the United States and southwestern New Brunswick release (Lombard, 2018).2 Estimation of Unregulated Monthly, Annual, and Peak Streamflows and Lake Levels, Maine-New Brunswick Border
67°50' 45' 67°40'
EC
EXPLANATION
EB
NEW
QU
BRUNSWICK
East Grand Lake
Study area
MAINE Maine town boundaries
45°48'
I NE
MA TIA
VA
OF Forest City Dam
LF
NO
SCO
GU
ATLANTIC OCEAN Environment Canada
monitoring station
Orient and number
Weston
45'
New Brunswick
UNITED
01AR009
CANAD
Forest City Dam
STATES
Fo
Ea
re
A
s
01AR011
st
tC
45°42'
ity
Gr
Str
an
ea
m
dL
ak
e
Sai
nt C
Bancroft
roix
Danforth
Forest City
Riv
er
45°39'
CA
UN
Sp
N
IT
ed
AD
ED
nic
A
La
ST
AT
ke
E S
Forest Township
Basemap is copyright Esri Inc. and its licensors; used under license 0 1 2 3 4 MILES
NAD 83 UTM Zone 19N coordinate system
Transverse Mercator projection 0 1.5 3 4.5 6 KILOMETERS
North American Datum of 1983
Figure 1. The East Grand Lake study area in Maine, United States, and New Brunswick, Canada.Data Collection And Analysis 3
Historical Streamflow and Lake Level Data Estimates of Unregulated Streamflows
Historical regulated daily mean streamflows at Forest Estimated unregulated streamflows at the Forest City
City Stream below Forest City Dam at Forest City, Maine, Stream station were calculated by using regression equations.
collected at Environment Canada (EC) monitoring station The USGS recently completed an investigation in coopera-
01AR011 from 1975 to 2015 and historical daily mean lake tion with the Maine Department of Transportation to derive
levels at Grand Lake at Forest City, Maine, collected at EC state-wide regression equations that can be used to estimate
monitoring station 01AR009 from 1969 to 2016 (Environment monthly and annual mean streamflows for ungaged, unregu-
Canada, 2017) were used in the analysis. Daily mean stream- lated rivers in Maine (Dudley, 2015). All of the regression
flows from 1975 to 2015 were averaged to compute historical equations used were derived on the basis of streamflow and
monthly means and mean annual streamflow. Monthly mean basin characteristics from unregulated, rural drainage basins
streamflows historically were lowest in November (114 ft3/s; without substantial drainage improvements; therefore, applica-
3.23 m3/s) and highest in September (318 ft3/s; 9.01 m3/s) tion of the regression equations to any given basin assumes
(table 1); mean annual streamflow over this same period unregulated conditions. Variables used to estimate monthly
was 235 ft3/s (6.66 m3/s). Monthly mean lake levels for the mean and mean annual streamflows and their accuracy include
period 1969 to 2016 in East Grand lake ranged from 431.3 ft drainage area (all monthly and annual flows), mean basin
(131.5 m) (October) to 434.0 ft (132.3 m) (May), with an elevation (annual flows and July, August, September, and
average annual value of 432.5 feet (131.8 m) (Environment October flows), maximum basin elevation (November flows),
Canada, 2017) (table 2). the fraction of sand and gravel aquifers in the basin (July,
Table 1 Historical regulated monthly mean streamflows at Forest City, Maine, Environment Canada streamflow monitoring station
01AR011 from 1975 to 2015, and unregulated monthly mean streamflows calculated with Dudley (2015) regression equations and
Dudley (2004) regression equations.
[ft3/s, cubic foot per second; m3/s, cubic meter per second]
Historical regulated monthly Difference between historical
Unregulated monthly mean streamflowcalculated with
Month mean streamflow calculat- regulated streamflows and esti-
regression equations
ed from streamgaging data 1
mated unregulated streamflows
Prediction
(ft3/s) (m3/s) (ft3/s) (m3/s) (ft3/s) (m3/s)
error(percent)4
January 234 6.63 2
180 5.10 -18.0 to 21.9 54 1.53
February 250 7.08 2
128 3.62 -11.4 to 12.9 122 3.46
March 259 7.33 3
242 6.85 -22.4 to 28.8 18 0.51
April 241 6.83 3
653 18.5 -16.7 to 20.0 -412 -11.7
May 264 7.48 3
521 14.8 -16.8 to 20.2 -258 -7.31
June 260 7.36 3
212 6.00 -15.2 to 17.9 48 1.36
July 237 6.71 2
102 2.89 -14.4 to 16.8 135 3.82
August 222 6.29 2
63.5 1.80 -19.1 to 23.7 159 4.50
September 318 9.01 2
59.2 1.68 -18.5 to 22.7 259 7.33
October 228 6.46 2
184 5.21 -19.6 to 24.4 44 1.25
November 114 3.23 2
313 8.86 -12.9 to 14.8 -199 -5.64
December 198 5.61 2
286 8.10 -16.6 to 20.0 -88 -2.49
Annual 235 6.66 2
261 7.39 -9.9 to 10.9 -26 -0.74
1
Environment Canada (2017).
2
Dudley (2015).
3
Dudley (2004).
4
(PRESS/n)1/2, prediction error sum of squares, in percent, where n is the number of streamgages used in the regression equation derivation(Dudley 2004,
2015).4 Estimation of Unregulated Monthly, Annual, and Peak Streamflows and Lake Levels, Maine-New Brunswick Border
Table 2. Historical monthly mean lake levels at Grand Lake at Forest City, Maine, Environment Canada monitoring station 01AR009
from 1969 to 2016, and monthly mean lake levels associated with unregulated flows calculated by using a hydraulic model.
[ft, foot; m, meter]
Difference in historical regulated
Modeled Unregulated Modeled unregulated
Historical regulated monthly mean lake levels and mod-
Month monthly mean lake level monthly mean lake level
monthly mean lake level1 eled unregulated monthly mean lake
(all gates open) (two gates open)
levels with all gates open
(ft) (m) (ft) (m) (ft) (m) (ft) (m)
January 432.1 131.7 428.5 130.6 428.5 130.6 3.6 1.1
February 431.9 131.6 428.2 130.5 428.2 130.5 3.8 1.2
March 431.8 131.6 428.8 130.7 428.8 130.7 3.0 0.91
April 432.9 131.9 431.1 131.4 432.5 131.8 1.8 0.55
May 434.0 132.3 430.4 131.2 431.6 131.6 3.5 1.1
June 433.9 132.3 428.6 130.6 428.6 130.6 5.2 1.6
July 433.5 132.1 428.0 130.5 428.0 130.5 5.4 1.6
August 432.9 131.9 427.8 130.4 427.8 130.4 5.2 1.6
September 432.1 131.7 427.7 130.4 427.7 130.4 4.4 1.3
October 431.3 131.5 428.5 130.6 428.5 130.6 2.8 0.85
November 431.5 131.5 429.1 130.8 429.1 130.8 2.4 0.73
December 432.0 131.7 429.0 130.8 429.0 130.8 3.1 0.94
Annual 432.5 131.8 428.9 130.7 428.9 130.7 3.7 1.1
1
Environment Canada (2017).
August, September, October, and annual flows), distance from Table 3. Drainage basin characteristics of East Grand
the coast (February, March, and May flows), mean basin slope Lake in Maine, United States, and New Brunswick, Canada,
(February flows), mean annual precipitation (April flows), and as determined through the U.S. Geological Survey web
the percent of hydrologic group A (well drained soils; Soil application StreamStats.
Survey Staff, Natural Resources Conservation Service, 2017)
(December and January flows). Variables needed to estimate [StreamStats is available at https://water.usgs.gov/osw/streamstats/. mi2,
square mile; km2, square kilometer; ft, foot; m, meter; km, kilometer]
peak flows for selected recurrence intervals and their accuracy
include drainage area and percent wetlands (the areal percent- Basin characteristic Value
age of all types of wetlands including lakes, ponds, reservoirs,
Drainage area1 133 mi2 (344 km2)
and rivers) in the basin (Hodgkins, 1999). Characteristics of
East Grand Lake Basin upstream of the station on Forest City Mean basin elevation 518.9 ft (158.2 m)
Stream are presented in table 3. Maximum basin elevation 1,202 ft (366.4 m)
The Dudley (2015) equations were used to estimate Fraction of sand and gravel aquifers 0.003 (unitless)
unregulated mean monthly and annual streamflows at Forest Percentage of area with hydrologic
City Stream for the months July through February (table 1). soil type A (well drained soils)2 0.23 percent
For March, April, May, and June, however, equations devel- Shortest distance from coastline to
oped by Dudley (2004) rather than the 2015 equations were basin centroid 101 miles (162 km)
used because the 2004 equations did not require the dependent Mean basin slope 4.46 percent
variable “percent open water in the basin” for estimation of
Percentage of wetlands 19.3 percent
mean monthly streamflow. Percent open water in the basin
for this site is well outside the range of the percent open
1
Drainage area determined with a geographic information system (GIS)
using USGS StreamStats (https://water.usgs.gov/osw/streamstats/) and
water at sites used to develop the 2015 equations; hence, the delineated from a point at latitude 45.66467, longitude -67.7341. Does not
2015 equations are not necessarily appropriate for estimating supersede the drainage area of 357 km2 published by Environment Canada.
streamflow at this site for those months because errors would 2
U.S. Department of Agriculture Natural Resources Conservation Service
be unknown. Calculations for 2- to 100-year peak flows were SSURGO database (Soil Survey Staff, Natural Resources Conservation
made using regression equations developed by Hodgkins Service, 2017).Data Collection And Analysis 5
(1999) (table 4). The calculated basin characteristics, peak were surveyed by using differential leveling and acoustic
flows, and most monthly estimates of streamflow were from Doppler current profiler (ADCP) measurements in October
the USGS web application StreamStats (U.S. Geological 2017 (Lombard, 2018). A Topcon DL–500 digital autolevel
Survey, 2017; https://streamstats.usgs.gov/ss/). The excep- with a Sokkia BGS50G3 fiberglass digital level rod was used
tion to this is that the March through June mean monthly in accordance with USGS policy outlined in Kenney (2010)
streamflows were calculated manually with basin character- to collect water-surface elevations before the ADCP transects
istic values determined in StreamStats and by the Dudley were run. The autolevel also was used to collect elevations on
(2004) equations. the upstream and downstream faces of the dam and water-sur-
The unregulated mean annual streamflow at Forest City face elevations at the beginnings and ends of the field surveys.
Tape-downs were obtained from these points to determine
Stream estimated using the regression equation in Dudley
the elevations of the three dam gates and the fish ladder. The
beginning point for the level loop was a brass monument (tab-
Table 4 Unregulated flood flows for Forest City Stream at let) labeled “International Boundary Commission, Reference,
Forest City, Maine, calculated with regression equations. Mon. 56, 1919, 1999” established as USGS control point FC_
IBC56 in 2013 (Lombard, 2013). Monument FC_IBC56 is just
[ft3/s, cubic foot per second; m3/s, cubic meter per second]
north of the road to the dam and 164 ft (50 m) southwest of
Annual peak- Prediction error
the dam and has an elevation of 438.05 ft (133.516 m) above
Estimated unregulated the North American Vertical Datum of 1988. It is also an EC
flow recurrence for unregulated
flood flows1 control point for the 01AR009 Grand Lake gage; however, it
interval flood flows2
(ft3/s) (m3/s) (percent)
is in Maine.
Depth data upstream and downstream from the Forest
2-year peak flow 1,650 46.7 -29.7 to 42.2
City Dam were collected with a Teledyne RD Instruments
5-year peak flow 2,300 65.1 -30.3 to 43.5 (TRDI) 1,200-kilohertz (600-kilohertz vertical beam) River-
10-year peak flow 2,760 78.2 -31.1 to 45.2 Pro ADCP. The data were collected and processed with TRDI
25-year peak flow 3,330 94.3 -32.5 to 48.3 WinRiver II software (version 2.18) in accordance with USGS
50-year peak flow 3,760 106 -33.8 to 51.0 policy in Mueller and others (2013). Location information for
100-year peak flow 4,210 119 -34.8 to 53.5
the ADCP was collected with a Hemisphere A101 differential
global positioning system. Single transects were observed
1
Hodgkins (1999).
starting at the upstream face of the Forest City Dam and mov-
2
(PRESS/n)1/2 , prediction error sum of squares, in percent, where n is the ing lakeward in alternating directions, with one person on
number of streamgages used in the regression equation derivation (Hodgkins,
1999). either bank of the lake pulling the tethered ADCP from one
bank to the other.
ADCP depths were converted to bottom elevations by
(2015) is 261 ft3/s (7.39 m3/s). This shows good agreement using the surveyed water-surface elevations described above.
with the mean annual flow calculated at the Forest City Stream During the bathymetric data collection water-surface eleva-
station of 235 ft3/s (6.66 m3/s) (Environment Canada, 2017) tions averaged 430.5 ft (131.2 m) upstream from the dam
(table 1). Although the streamflows are currently (2017) and 428.4 ft (130.6 m) downstream from the dam (Lombard,
regulated, the amount of water that passes annually should 2018). Latitudes, longitudes, and bathymetric elevations were
be similar to natural mean annual flow. The agreement lends converted to stations and elevations for the HEC–RAS hydrau-
additional confidence to the monthly estimates. Unregulated lic model by using U.S. Army Corps of Engineers HEC–Geo-
monthly mean streamflows calculated by using the regression RAS software (U.S. Army Corps of Engineers, 2009).
equations range from 59.2 ft3/s (1.68 m3/s) in September to
653 ft3/s (18.5 m3/s) in April (fig. 2, table 1). Estimated unreg-
ulated flood flows range from a 2-year peak flow of 1,650 ft3/s Modeled Unregulated East Grand Lake Levels
(46.7 m3/s) to a 100-year peak flow of 4,210 ft3/s (119 m3/s)
A HEC–RAS version 5.0.3 hydraulic model was used to
(table 4) (Hodgkins, 1999). Prediction errors for regression
compute water-surface profiles through the dam (U.S. Army
equation estimates are calculated as the prediction error sum
Corps of Engineers, 2016) from the unregulated monthly and
of squares (PRESS statistic) in percent (tables 1 and 4). The
annual streamflow and peak flow estimates and bathymet-
PRESS statistic is a validation-type statistic analogous to the
ric data described above. HEC–RAS is a one-dimensional
average standard error of prediction (Hodgkins, 1999).
step-backwater model with steady-state or unsteady-state
options for flow computation. Hydraulic analyses require the
Field Surveys estimation of energy losses that result from frictional resis-
tance exerted by a channel on flow. Energy losses are quanti-
Dam geometry and the surrounding topography and fied by the Manning’s roughness coefficient (n-value). The
bathymetry at the Forest City Dam outlet of East Grand Lake channel n-values were estimated at 0.04 and the overbanks6 Estimation of Unregulated Monthly, Annual, and Peak Streamflows and Lake Levels, Maine-New Brunswick Border
n-values at between 0.08 and 0.1. All unregulated monthly Forest City Dam with all three gates open, range from 427.7 ft
and annual streamflows and peak flows calculated by using (130.4 m) in September to 431.1 ft (131.4 m) in April. When
regression equations were routed through the hydraulic model; the same flows are run through the dam with two gates open
the steady-state computation option was used for two gate and one gate closed, lake levels range from 427.7 ft (130.4 m)
scenarios: (1) with all three gates open, and (2) with two of in September to 432.5 ft (131.8 m) in April (fig. 3, table 2).
the three gates open. The fish ladder was not included in the Modeled unregulated mean monthly lake levels are roughly
hydraulic model because it likely would have negligible effect the same with all gates open as with only two gates open in
on unregulated lake levels because of its elevation relative to all months of the year except April and May, when they differ
the bottom of the gates and its low conveyance. The data- by 1.4 ft (0.43 m) and 1.2 ft (0.37 m), respectively. Estimated
sets used in this study are available through a data release monthly unregulated lake levels with all gates open would be
(Lombard, 2018). from 1.8 to 5.4 feet (ft) (0.55 to 1.6 m) lower than they have
Modeled unregulated mean monthly lake levels resulting been historically in all months, with the biggest differences in
from estimated unregulated streamflows, when run through the summer and early fall (fig. 3, table 2).
700
EXPLANATION
Streamflow, in cubic feet per second
600 Historical streamflows
Unregulated streamflows
500
400
Figure 2. Historical regulated monthly
mean streamflows at Forest City, 300
Maine, Environment Canada streamflow
monitoring station 01AR011 from 1975 200
to 2015, and estimated unregulated
monthly mean streamflows calculated 100
by using regression equations
(Dudley, 2004; 2015).
0
September
November
December
February
January
October
August
March
June
April
May
July
Month
436
EXPLANATION
435
Historical lake levels
Two gates open
Lake stage, in feet NAVD 88
434
All gates open
433
432
431
430
Figure 3. Historical lake levels at
429 East Grand Lake at Forest City, Maine,
428
Environment Canada monitoring
station 01AR009 from 1969 to 2016, and
427 unregulated mean monthly lake levels
426 calculated by using a hydraulic model.
September
November
December
February
January
October
August
March
June
April
May
July
MonthReferences Cited 7
Lake levels resulting from peak flows run through the (132.3 m) (May), with an average annual value of 432.5 feet
outlet dam with all three gates open range from 435.3 ft (131.8 m). Monthly unregulated lake levels would be from
(132.7 m) for a peak flow with a 2-year recurrence interval 1.8 to 5.4 feet (ft) (0.55 to 1.6 meters [m]) lower than they
to 438.3 ft (133.6 m) for a peak flow with a 100-year recur- have been historically during all months, with the biggest dif-
rence interval (table 5). Lake levels resulting from peak flows ferences in summer and early fall.
run through the outlet dam with two gates open range from Estimated unregulated peak flows range from
437.2 ft (133.3 m) for a peak flow with a 2-year recurrence
1,650 ft3/s (46.7 m3/s) for a 2-year recurrence interval to
interval to 438.7 ft (133.7 m) for a peak flow with a 100-year
4,210 ft3/s (119 m3/s) for a 100-year recurrence interval.
recurrence interval (table 5). Differences in lake levels associ-
ated with peak flows run through the model with three gates Lake levels corresponding to unregulated peak flows with
open versus with two gates open range from 1.9 ft (0.58 m) all of the gates at the outlet dam open range from 435.3 ft
lower for 2-year peak flows to 0.4 ft (0.12 m) lower for (132.7 m) for a streamflow with a 2-year recurrence inter-
100-year peak flows. val and 438.3 ft (133.6 m) for a streamflow with a 100-year
recurrence interval.
Table 5. East Grand Lake levels associated with unregulated
flood flows calculated by using a hydraulic model, Maine,
United States, and New Brunswick, Canada. Acknowledgments
[ft, foot; m, meter] I would like to thank U.S. Geological Survey personnel
Jeff Kinsey, Tom Orcutt, and Jeremiah Pomerleau for col-
Annual peak-flow Modeled lake levels Modeled lake levels
recurrence interval (all three gates open) (two gates open)
lecting field data; Luke Sturtevant, Terrence Talbot, and Sean
Andrews for geographic information systems analyses; and
(ft) (m) (ft) (m)
Robert Dudley for his input throughout the project and review
2-year peak flow 435.3 132.7 437.2 133.3
of this report.
5-year peak flow 437.1 133.2 437.7 133.4
10-year peak flow 437.5 133.4 438.0 133.5
25-year peak flow
50-year peak flow
437.8
438.1
133.4
133.5
438.3
438.5
133.6
133.7
References Cited
100-year peak flow 438.3 133.6 438.7 133.7
Dudley, R.W., 2004, Regression equations for monthly and
annual mean and selected percentile streamflows for
Summary ungaged rivers in Maine: U.S. Geological Survey Scientific
Investigations Report 2004–5026, 22 p., accessed June 2016
The U.S. Geological Survey, in cooperation with the at https://pubs.er.usgs.gov/publication/sir20045026.
International Joint Commission, compiled historical data on
Dudley, R.W., 2015, Estimating monthly, annual, and
regulated streamflows and lake levels and estimated unregu-
lated streamflows and lake levels on Forest City Stream below low 7-day, 10-year streamflows for ungaged rivers in
Forest City Dam at Forest City, Maine, and East Grand Lake Maine: U.S. Geological Survey Scientific Investiga-
on the United States-Canada border between Maine and New tions Report 2015–5151, 35 p., accessed June 2016 at
Brunswick to study the effects on streamflows and lake levels http://dx.doi.org/10.3133/sir20155151.
if all three or if two dam gates are left open. Opening the Environment Canada, 2017, Historical hydrometric data:
gates at the Forest City Dam on the St. Croix River will likely
Environment Canada database, accessed September 2017 at
lead to a wider range of streamflows. Historical regulated
https://wateroffice.ec.gc.ca/.
mean monthly streamflows remained relatively flat through-
out the year, fluctuating between 114 cubic feet per second Hodgkins, G.A., 1999, Estimating the magnitude of peak
(ft3/s) (3.23 cubic meters per second [m3/s]) in November and flows for streams in Maine for selected recurrence
318 ft3/s (9.01 m3/s) in September. Mean monthly flows would intervals: U.S. Geological Survey Water-Resources
likely range between 59.2 and 653 ft3/s (1.68 and 18.5 m3/s) Investigations Report 99–4008, 45 p. [Also available at
if all three of the gates of the dam were opened and flow were https://pubs.er.usgs.gov/publication/wri994008.]
unregulated; lower flows would occur in the summer and
early fall, particularly August and September and the higher Kenney, T.A., 2010, Levels at gaging stations: U.S. Geologi-
flows would occur in April and May. Mean monthly lake cal Survey Techniques and Methods, book 3, chap. A19, 60
levels for the period 1969 to 2016 in East Grand lake ranged p. [Also available at https://pubs.er.usgs.gov/publication/
from 431.3 feet (ft) (131.5 meters [m]) (October) to 434.0 ft tm3A19.]8 Estimation of Unregulated Monthly, Annual, and Peak Streamflows and Lake Levels, Maine-New Brunswick Border
Lombard, P.J., 2013, Establishment of a vertical control Soil Survey Staff, Natural Resources Conservation Ser-
network along the St. Croix River in New Brunswick vice, 2017, Web soil survey: U.S. Department of
and Maine: U.S. Geological Survey Open-File Report Agriculture Natural Resources Conservation Ser-
2013–1236, 26 p. [Also available at https://doi.org/10.3133/ vice SSURGO database, accessed September 2017 at
ofr20131236.] https://websoilsurvey.nrcs.usda.gov/.
Lombard, P.J., 2018, Bathymetric data for St. Croix River U.S. Army Corps of Engineers, Hydrologic Engineering Cen-
at outlet to East Grand Lake and Forest City Dam sur- ter, 2009, HEC–GeoRAS, GIS Tools for Support of HEC–
vey, United States-Canadian border between Maine and RAS using ArcGIS, User’s Manual (ver. 4.2): U.S. Army
New Brunswick: U.S. Geological Survey data release, Corps of Engineers CPD–83, [variously paged].
https://doi.org/10.5066/F7PN94VN. U.S. Army Corps of Engineers, Hydrologic Engineering
Center, 2016, HEC–RAS River Analysis System, hydraulic
Mueller, D.S., Wagner, C.R., Rehmel, M.S., Oberg, K.A,
reference manual (ver. 5.0): U.S. Army Corps of Engineers
and Rainville, Francois, 2013, Measuring discharge with
CPD–69, [variously paged].
acoustic Doppler current profilers from a moving boat (ver.
2.0, December 2013): U.S. Geological Survey Techniques U.S. Geological Survey, 2017, Welcome to StreamStats: U.S.
and Methods, book 3, chap. A22, 95 p. [Also available Geological Survey StreamStats application, accessed Sep-
at https://dx.doi.org/10.3133/tm3A22.] tember 2017 at https://water.usgs.gov/osw/streamstats/.For more information about this report, contact: Director, New England Water Science Center U.S. Geological Survey 196 Whitten Road Augusta, ME 04330 dc_nweng@usgs.gov or visit our website at https://newengland.water.usgs.gov Publishing support provided by the Pembroke Publishing Service Center
Lombard—Estimation of Unregulated Monthly, Annual, and Peak Streamflows and Lake Levels, Maine-New Brunswick Border—SIR 2018–5044

                                                                                                                                    https://doi.org/10.3133/sir20185044
                                                                                                                                    ISSN 2328-0328 (online)
You can also read