Global Potential of Concentrating Solar Power
←
→
Page content transcription
If your browser does not render page correctly, please read the page content below
SolarPaces Conference Berlin, September 2009
Global Potential of Concentrating Solar Power
Franz Trieb, Christoph Schillings, Marlene O’Sullivan, Thomas Pregger, Carsten Hoyer-Klick
Dr. Franz Trieb, German Aerospace Center, Institute of Technical Thermodynamics, Pfaffenwaldring 38-40,
70569 Stuttgart, Germany, Phone: +49 711 6862 423, Fax: +49 711 6862 747, E-Mail: franz.trieb@dlr.de
Abstract
The paper presents an analysis of the technical potential of concentrating solar power (CSP) on a global scale
elaborated within the European project REACCESS. The analysis is based on the annual direct normal
irradiation data (DNI) provided by NASA Surface Meteorology and Solar Energy program (SSE) Version
6.0. The solar resource data has been uploaded to a geographic information system and processed together
with spatial data on land use, topography, hydrology, geomorphology, infrastructure, protected areas etc.
excluding sites that are not technically feasible for the construction of concentrating solar power plants. The
result yields a global map of DNI on land area that is potentially suited for the placement of CSP plants.
This map has been analyzed statistically using a simple CSP performance model that takes contemporary
parabolic trough technology as reference to determine the potential of solar electricity generation for different
classes of annual DNI intensity ranging from 2000 to 2800 kWh/m²/y. The paper describes the assessment
methodology and the technical and economic CSP model, and shows the results of this analysis for the
different world regions.
Keywords: concentrating solar power, solar energy resource assessment, direct normal irradiation, solar
radiation atlas, cost model, performance model
1. Introduction
The project “Risk of Energy Availability: Common Corridors for European Supply Security” (REACCESS)
under the European Commission Grant Agreement No.212011 evaluates technical, economical and
environmental characteristics of present and future energy corridors within and among Europe and the
supplying regions of the World, taking into account the different types of infrastructures and technologies
like railways, pipelines, cables, terminals, ships and other carriers, the flows and the distances involved for
oil, natural gas, coal, electricity, uranium, biomass and hydrogen [10]. The Department of Systems Analysis
and Technology Assessment of the German Aerospace Center (DLR) developed a simplified performance
and cost model representing CSP technology as an element of future European energy supply. It includes
external supply corridors like solar electricity imports by high voltage cables from CSP plants and provides a
comprehensive solar energy resource atlas on a global scale that will be described in the following.
2. Assessment of Solar Energy and Land Resources
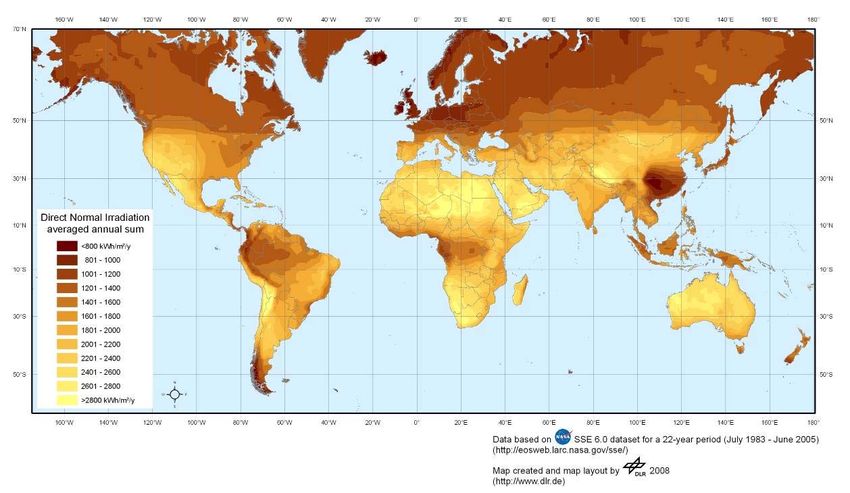
A world wide data set of direct normal irradiation is available from the NASA Surface Meteorology and
Solar Energy Program (SSE) Version 6.0. It is based on 22 years of data and has a spatial resolution of about
100 km, which is considered sufficient to assess the potential of CSP plants on a global scale (Figure 1). The
accuracy of the data is described on the SSE website [6].
Site exclusion criteria for CSP plants were applied world wide yielding a global exclusion map shown in
Figure 2. The methodology of site exclusion was described in [4]. Exclusion criteria comprise: slope > 2.1 %,
land cover like permanent or non-permanent water, forests, swamps, agricultural areas, shifting sands
including a security margin of 10 km, salt pans, glaciers, settlements, airports, oil or gas fields, mines,
quarries, desalination plants, protected areas and restricted areas. Spatial resolution of the data was 1 km².
Both maps were combined to yield a global map of annual direct normal irradiance for potential CSP sites
-1-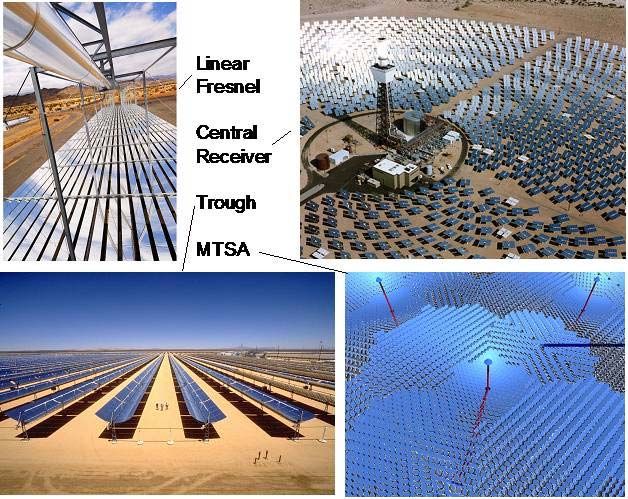
SolarPaces Conference Berlin, September 2009

(Figure 3). This map was subdivided according to the world regions defined within the REACESS project,
and a statistical analysis of the distribution of DNI intensity classes with values higher than 2000 kWh/m²/y
was made for each region, yielding the land area available for CSP classified by DNI intensities (Table 1).

         Fig. 1. World wide annual direct normal irradiation in kWh/m²/y from NASA SSE 6.0
                           http://eosweb.larc.nasa.gov/sse/ (picture by DLR)

  Fig. 2. World wide exclusion of sites for CSP plant construction. Dark areas indicate suitable sites
                              from the point of view of land suitability

                                                    -2-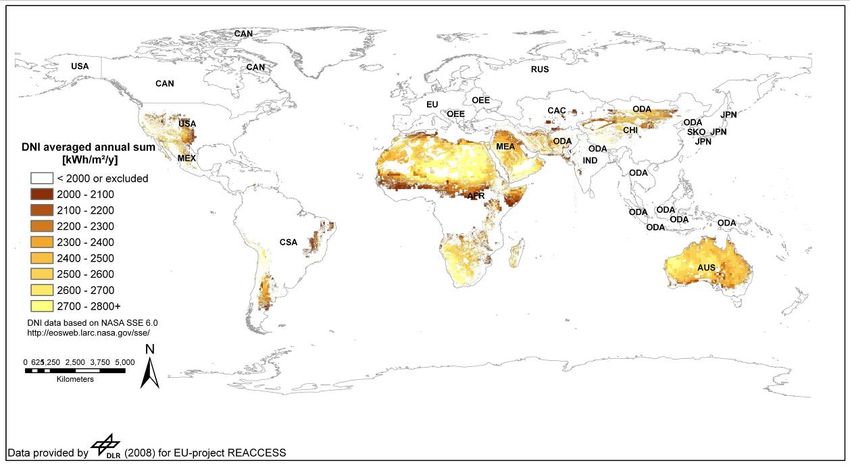
SolarPaces Conference Berlin, September 2009

    Fig. 3. Resulting map of the annual sum of direct normal irradiation for potential global CSP sites
            as identified within the EU-project REACCESS. For the definition of world regions
                 (abbreviations) and quantification of site potentials please refer to Table 1

                                                Central                               Central
                                                   Asia,                               South
DNI Class              Africa   Australia      Caucase       Canada         China    America       India    Japan
kWh/m²/y                 km²          km²           km²         km²           km²         km²       km²       km²
2000-2099          1,082,050       70,164       151,109                    88,171     334,096    83,522
2100-2199          1,395,900      187,746         3,025                   184,605     207,927    11,510
2200-2299          1,351,050      355,188         3,594                   415,720     232,678     5,310
2300-2399          1,306,170      812,512         1,642                   263,104     191,767     7,169
2400-2499          1,862,850    1,315,560           569                    99,528      57,041     3,783
2500-2599          1,743,270    1,775,670                                  96,836      31,434        107
2600-2699          1,468,970    1,172,760                                  17,939      42,139        976
2700-2800+         2,746,100      393,850                                  24,435      93,865        120
Total [km²]       12,956,360    6,083,450      159,939             0    1,190,338   1,190,948   112,497         0

                                                 Other
                                            Developing     Other East
DNI Class        Middle East      Mexico          Asia        Europe      Russia South Korea     EU27+        USA
kWh/m²/y                 km²         km²           km²            km²       km²         km²         km²        km²
2000-2099             36,315      16,999        47,520             59                             9,163    149,166
2100-2199            125,682      34,123        52,262            129                             5,016    172,865
2200-2299            378,654      35,263       105,768             23                             6,381    210,128
2300-2399            557,299      53,765       284,963                                            1,498    151,870
2400-2499            633,994     139,455       172,043                                              800    212,467
2500-2599            298,755      60,972        37,855                                              591     69,364
2600-2699            265,541      12,628         2,084                                              257     19,144
2700-2800+           292,408      14,903         1,082                                              270
Total [km²]        2,588,648     368,108       703,577           211           0           0     23,975    985,005

        Table 1. Areas for CSP generation [km²] in the REACCESS world regions classified by DNI

The analysis shows that most world regions except Canada, Japan, Russia and South Korea have significant
potential areas for CSP at an annual solar irradiance higher than 2000 kWh/m²/y. Africa, Australia and the
Middle East have the largest potential areas, followed by China and Central & South America.

                                                           -3-
SolarPaces Conference Berlin, September 2009
3. CSP Performance Model
Today, CSP plants without thermal energy storage at sites with annual DNI higher than 2000 kWh/m²/y
would have capacity factors of around 20-25 %, equivalent to about 2000 full load operating hours per year,
with the perspective to expand their time of solar operation to base load using thermal energy storage and
larger collector fields. In order to describe the capability of CSP for providing base, intermediate or peaking
power, we have developed a simple model of the achievable annual full load operating hours in solar
operation mode as function of plant configuration.
The configuration of a CSP plant is best described by the so called Solar Multiple (SM). For example a steam
cycle power station with SM1 has one solar field just large enough to provide nominal turbine capacity under
nominal irradiation conditions, e.g. at 800 W/m² on the collector aperture area. A CSP plant with a solar
multiple SM2 would have a solar field twice as large and a thermal energy storage system large enough to
store the energy produced by the second solar field during the day (Figure 4). Thus, one solar field will
directly drive the turbine, while the other solar field will serve to fill the storage for night time operation.
Storage capacity and collector field size can be increased to SM3 and SM4. Increasing solar fields further
does not make sense, as during high irradiation periods they would increasingly produce unused surplus
energy [2], [12].
SM1 SM2 SM3 S M4
Solar Field Solar Field Solar Field Solar F ield
1 2 3 4
Storage Storage Storage
1 2 3
Electricity
P ower Block
Fig. 4. Definition of CSP plant configuration with different Solar Multiple (SM)
In our model, a Solar Multiple of one (SM1) defines a collector field with an aperture area of 6000 m² per
installed MW of power capacity. Each storage unit has a capacity of 6 full load operating hours. This model
considers as reference current parabolic trough technology with molten salt storage, steam cycle power block
and dry cooling tower with an annual net solar electric efficiency of about 12%.
Annual full load hours are shown in Table 2 and Figure 5 for varying configuration, latitude and annual solar
irradiation. As an example, a CSP plant with a Solar Multiple 4 would have 4 x 6000 = 24000 m²/MW solar
field aperture area plus 3 x 6 = 18 hours of storage capacity. Such a plant would achieve about 5900 full load
operating hours at 2000 kWh/m²/y of annual solar irradiation in Southern Spain (Latitude 35°) and 8000 full
load hours at a site in Southern Egypt (Latitude 25°) with 2800 kWh/m²/y annual solar irradiation.
The following simplified function was derived from this analysis. It describes the performance of different
CSP plant configurations under different irradiation conditions. It gives the achievable annual full load
operating hours (Flh) of a CSP plant as function of the solar multiple (SM) and annual DNI:
Flh = (2.5717 ⋅ DNI − 694) ⋅ (−0.0371 ⋅ SM ² + 0.4171 ⋅ SM − 0.0744)
-4-SolarPaces Conference Berlin, September 2009
Dependence on latitude has been neglected here. Figure 6 shows the results of this simplified model.
Comparison with Table 2 and Figure 5 shows a good approximation for sites between 25° and 35° latitude
and typical differences of ± 10% for 0° latitude (underestimation) and for 40° latitude (overestimation),
respectively. The simplified model does not consider possible differences of climate or latitude between sites
with similar annual DNI, or performance differences between different CSP technologies and configurations
[5]. However, it can be useful to give a general performance estimate of CSP technology as required by the
REACCESS project, in order to characterize this technology as an element of modelling the energy sectors of
different world regions, and to estimate the performance of possible future solar electricity import corridors
from North Africa to Europe.
SM4
9000 SM3
8000
SM2
Full Load Hours [h/ y]
7000
SM1 8000-9000
6000
7000-8000
5000
6000-7000
4000
5000-6000
3000 4000-5000
2000 3000-4000
1000 2000-3000
0 1000-2000
DN
L at. 0 °
D N I 28
La t. 1 0 °
L a t. 2 0 °
0-1000
L at. 30 °
La t. 40 °
D N I 260 00
Lat. 0 °
L at. 10 °
L at. 20 °
L at. 3 0 °
DN I 2 4 0
La t. 4 0 °
La t. 0 °
La t. 10 °
0
L at. 2 0 °
D N I 22 0
L a t. 3 0 °
La t. 40 °
L at. 0 °
0
L at. 10 °
D N I 2 00 0
L at. 20 °
L at. 3 0 °
L at. 40 °
I1 0
80
La titude [°] 0
Fig. 5. Model results (annual full load hours) for varying SM, DNI and Latitude
9000
8000
Annual Full Load Hours [h/y]
7000
SM4
6000
SM3
5000 SM2
4000 SM1
ANDASOL 1
3000
Nevada Solar 1
2000
1000
0
2000 2200 2400 2600 2800
Direct Normal Irradiation [kWh/m²/y]
Fig. 6. Simplified model of annual solar full load hours of a CSP plant (h/y) as function of annual
direct normal irradiation and solar multiple (SM) compared to reported data from recent
projects ANDASOL 1 [7] and Nevada Solar 1 [1]
-5-SolarPaces Conference Berlin, September 2009
SM1 DNI 1800 DNI 2000 DNI 2200 DNI 2400 DNI 2600 DNI 2800
Lat. 0 ° 1613 1869 2128 2362 2594 2835
Lat. 10 ° 1607 1859 2130 2344 2581 2808
Lat. 20 ° 1559 1801 2082 2269 2502 2725
Lat. 30 ° 1460 1689 1977 2128 2350 2580
Lat. 40 ° 1310 1524 1815 1920 2127 2366
SM2 DNI 1800 DNI 2000 DNI 2200 DNI 2400 DNI 2600 DNI 2800
Lat. 0 ° 3425 3855 4221 4645 4931 5285
Lat. 10 ° 3401 3817 4187 4612 4909 5222
Lat. 20 ° 3310 3719 4098 4495 4810 5096
Lat. 30 ° 3147 3539 3943 4283 4605 4887
Lat. 40 ° 2911 3285 3719 3984 4301 4604
SM3 DNI 1800 DNI 2000 DNI 2200 DNI 2400 DNI 2600 DNI 2800
Lat. 0 ° 4869 5414 5810 6405 6713 7147
Lat. 10 ° 4829 5358 5752 6365 6690 7074
Lat. 20 ° 4711 5223 5630 6229 6583 6929
Lat. 30 ° 4499 4995 5434 5970 6352 6676
Lat. 40 ° 4189 4674 5163 5601 5987 6322
SM4 DNI 1800 DNI 2000 DNI 2200 DNI 2400 DNI 2600 DNI 2800
Lat. 0 ° 5987 6520 6796 7563 7859 8243
Lat. 10 ° 5918 6430 6711 7514 7831 8160
Lat. 20 ° 5761 6260 6563 7380 7724 8009
Lat. 30 ° 5506 5999 6340 7110 7497 7738
Lat. 40 ° 5155 5650 6045 6717 7115 7348
Table 2. Annual full load hours (h/y) of CSP plants for different Solar Multiple (SM), different annual
direct normal irradiation (DNI) and different latitudes (Lat.) from hourly time series modeling
4. CSP Cost Model
The cost of concentrating solar power plants was modeled as function of time individually for the different
components of such plants. For each component, a separate learning curve and progress ratio for future cost
development was assumed (Table 5). The learning curve of each component – investment cost (c) as function
of time (x) – was calculated from the total installed capacity (P) and from the progress ratio (PR) according
to the following equation, were (P0) was the installed capacity at the starting year (2005) and Px was the
installed capacity in the year x, and c0 and cx stand for the respective specific investment at that time [3], [8]:
log PR
⎛P ⎞ log 2
c x = c0 ⋅ ⎜⎜ x ⎟⎟
⎝ P0 ⎠
A progress ratio of 90% means that the specific investment is reduced by 10% each time the world wide
installed capacity doubles. The model was based on a scenario of world wide CSP expansion considered as
realistic. It starts with 354 MW solar power capacity installed in 2005 and expands to 5,000 MW by 2015,
150,000 MW by 2030 and 500,000 MW by 2050 (see also [11], [15]. According to this expansion and the
learning rates assumed here, the specific investment cost of CSP plants would develop as shown in Figure 7
for different plant configurations with varying solar multiple and solar operating hours (SM1 - SM4). For
REACCESS, a solar multiple of SM4 has been taken as reference for performance and cost modeling. The
CSP cost model considers current oil-cooled parabolic trough technology with molten salt storage and steam
cycle power block with dry cooling tower as reference.
Taking into account the annual full load operating hours from Figure 6 and the related investment learning
curve for a solar multiple of SM4 from Figure 7, it is possible to calculate the total electricity cost as function
of solar irradiation and time (Figure 8 and Table 7). The model assumes constant (real) monetary value of
-6-SolarPaces Conference Berlin, September 2009
€2005, a real discount rate of 6%, economic plant lifetime of 25 years, an annual operation and maintenance
cost rate of 2% of the investment, an annual insurance rate of 0.5% of the investment, as well as the learning
rates and achievable annual full load hours as described before.
In Figure 8 the cost of CSP has been compared to the cost of electricity produced by fossil fuels as calculated
by [9]. The energy-economic model and the parameters used by Nitsch were the same as used in our model
above. The comparison shows that CSP can become fully competitive between 2020 and 2030, and can later
contribute significantly to stabilize global electricity costs. As the capacity needed to achieve this cost
reduction is rather high, the expansion of CSP (like other renewables) can be considered a preventive
measure against electricity cost escalation and climate change.
12000
10000
Specific Investment [€/kW] .
SM4
8000
SM3
SM2
6000
SM1
ANDASOL 1
4000
Nevada Solar 1
2000
0
2000 2010 2020 2030 2040 2050 2060
Year
Fig. 7. Learning curves for the investment of CSP plants as function of the Solar Multiple and time
including example data from ANDASOL 1 [7] and Nevada Solar 1 [1]
100%
90%
Electri city C ost [% of Maximum]
80%
2000
70%
2200
60% 2400
50% 2600
2800
40%
Fossi l Power *
30%
20%
10%
2000 2010 2020 2030 2040 2050 2060
Year
Fig. 8. Electricity cost in % of the maximum starting value in 2005 as function of time and direct
normal irradiation (DNI in kWh/m²/y) for CSP reference plants with a solar multiple SM4 compared
to the cost of power generation from fossil fuels (including carbon costs) according to [9]*
-7-SolarPaces Conference Berlin, September 2009
5. Global CSP Potential
The following definitions were used to calculate the solar-to-electricity efficiency of concentrating solar
power stations with respect to the total land area required:
Annual Net Power Generation
Solar Electric Efficiency =
Annual Direct Irradiance on Aperture
Aperture Area of Reflectors
Land Use Factor =
Total Land Area Required
Land Use Efficiency = Solar Electric Efficiency x Land Use Factor
In our model, we have taken a typical parabolic trough steam cycle power station with thermal energy storage
as reference for assessing the solar-to-electricity conversion efficiency. With respect to the aperture area, a
parabolic trough system with wet cooling tower would have an average annual efficiency of 15%. Assuming
the preferred employment of dry-cooling towers in desert areas and increased parasitic losses for storage and
larger collector fields, the overall efficiency is reduced in our model to about 12%. That means that 12% of
the solar irradiation on the reflector aperture area of a parabolic trough collector can be transformed to net
electricity delivered to the grid. With respect to the total required land surface, a parabolic trough collector
field typically covers about 37% of the land area (Figure 9, Table 3). The overall land use efficiency
therefore results to 4.5% (12% times 37%) which describes the yield of a typical parabolic trough power
station with respect to the solar energy irradiated per year on the total land surface required by the plant.
In order to calculate the technical CSP electricity potential world wide, land areas available for CSP plant
erection from Table 1 were multiplied with a land use efficiency of 4.5% derived above. This simple
approach yields a good estimate of the technical potential of CSP represented by the well proven parabolic
trough technology (Table 4). The analysis yields a total global CSP potential of 2,945,926 TWh/y. By
comparing this number to the present world electricity consumption of less than 18,000 TWh/y it becomes
apparent that the available technical CSP potential could theoretically cover this demand manifold. The
location of this potential is concentrated mainly in the desert regions of the world as can be seen in Figure 3.
Collector & Power Cycle Solar-Electric Land Use Factor Land Use
Technology Aperture Related Efficiency Efficiency
Parabolic Trough 11 - 16% 25 - 40% 3.5 - 5.6%
Steam Cycle
Central Receiver 12 - 16% 20 – 25% 2.5 – 4.0%
Steam Cycle
Linear Fresnel 8 - 12% 60 - 80% 4.8 - 9.6%
Steam Cycle
Central Receiver 20 - 25% 20 - 25% 4.0 – 6.3%
Combined Cycle*
Multi-Tower Solar Array 15 - 25% 60 - 80% 9.0 – 20.0%
Steam or Combined Cycle*
* future concepts
Table 3. Solar-electric efficiency, land use factor and land use efficiency of different CSP technologies.
A parabolic trough system with 12% annual solar-electric efficiency, 37% land use factor and 4.5%
land use efficiency was taken as reference.
-8-SolarPaces Conference Berlin, September 2009
Fig. 9. Land use of different concentrating solar collector concepts. Multi-Tower Solar Array MTSA
shows an artist view of a potential future central receiver concept with very high land use efficiency
Central Central
Asia, South
DNI Class Africa Australia Caucase Canada China America India Japan
kWh/m²/y TWh/y TWh/y TWh/y TWh/y TWh/y TWh/y TWh/y TWh/y
2000-2099 102,254 6,631 14,280 0 8,332 31,572 7,893 0
2100-2199 138,194 18,587 300 0 18,276 20,585 1,140 0
2200-2299 139,834 36,762 372 0 43,027 24,082 550 0
2300-2399 141,066 87,751 177 0 28,415 20,711 774 0
2400-2499 209,571 148,001 64 0 11,197 6,417 426 0
2500-2599 203,963 207,753 0 0 11,330 3,678 13 0
2600-2699 178,480 142,490 0 0 2,180 5,120 119 0
2700-2800+ 346,009 49,625 0 0 3,079 11,827 15 0
Total [TWh/y] 1,459,370 697,600 15,193 0 125,835 123,992 10,928 0
Other
Developing Other East
DNI Class Middle East Mexico Asia Europe Russia South Korea EU27+ USA
kWh/m²/y TWh/y TWh/y TWh/y TWh/y TWh/y TWh/y TWh/y TWh/y
2000-2099 3,432 1,606 4,491 6 0 0 866 14,096
2100-2199 12,443 3,378 5,174 13 0 0 497 17,114
2200-2299 39,191 3,650 10,947 2 0 0 660 21,748
2300-2399 60,188 5,807 30,776 0 0 0 162 16,402
2400-2499 71,324 15,689 19,355 0 0 0 90 23,903
2500-2599 34,954 7,134 4,429 0 0 0 69 8,116
2600-2699 32,263 1,534 253 0 0 0 31 2,326
2700-2800+ 36,843 1,878 136 0 0 0 34 0
Total [TWh/y] 290,639 40,675 75,561 21 0 0 2,409 103,704
Table 4. Technical CSP potential in TWh/y in the REACCESS world regions classified by DNI
A comparison of Table 4 with Table 2 allows for an estimate of the annual full load hours and of the
electricity cost valid for the amount of electricity that could be generated in each region and within each class
of direct normal irradiation intensity. On the basis of this information, the project REACCESS will evaluate
the feasibility, cost and performance of CSP plants in the Middle East and North Africa and assess electricity
imports to Europe based on the approach described in [13], [14]. The results of this analysis will be published
elsewhere. This approach can also be applied to other regions of the world with similar conditions and
resources.
-9-SolarPaces Conference Berlin, September 2009
6. Conclusions
The global technical potential of concentrating solar power amounts to almost 3,000,000 TWh/y, a number
considerably larger than the present world electricity consumption of 18,000 TWh/y. The low resolution DNI
data and the simplified modeling of CSP performance used here is acceptable for the assessment of global
potentials and for a first estimate of CSP performance under varying conditions, but is not considered
sufficiently accurate for project development. Immense solar energy resources are concentrated in the deserts
of the earth. Under desert conditions, CSP plants with large solar fields and thermal energy storage are in
principle capable of producing base load electricity at full capacity for up to 8000 hours per year. While the
cost of such systems is still high today, such plants can become a competitive option of electricity supply in
the medium term, if an optimistic/realistic expansion of this technology – which can already be perceived
today – takes place. The distribution of potential areas for CSP world wide has been mapped with high
spatial resolution. It confirms the possibility of applying the concept of solar electricity transfer from deserts
to be applicable to many regions of the world. Solar electricity imports from deserts and semi-deserts to large
centers of demand can help to reduce greenhouse gas emissions and to stabilize electricity costs all over the
world, as they can deliver both base load electricity and balancing power.
Year PR 2005 2015 2030 2050 Unit
World CSP Capacity 354 5000 150000 500000 MW
Solar Field 90% 360 241 144 120 €/m²
Power Block 98% 1200 1111 1006 971 €/kW
Storage 92% 60 44 29 25 €/kW h
Table 5. Assumed expansion of CSP capacity, start values c0 (2005), progress ratio PR and future costs
of CSP plant components in €2005 taking current parabolic trough technology, molten salt storage and
steam cycle power block with dry cooling tower as reference
Year 2005 2015 2030 2050
SM1 3360 2559 1869 1690
SM2 5880 4269 2907 2560
SM3 8400 5978 3944 3429
SM4 10920 7688 4982 4299
Table 6. Total specific investment of CSP plants in €2005/kW as function of the Solar Multiple SM and
time, taking into account economies of scale and world wide expansion as by Table 5. SM4 was taken
as reference. Future development may include other technologies competing with parabolic troughs.
DNI [kWh/m²/y] 2005 2015 2030 2050
2000 100% 70% 46% 39%
2200 92% 65% 42% 36%
2400 85% 60% 39% 33%
2600 79% 56% 36% 31%
2800 74% 52% 34% 29%
Fossil Power * 21% 37% 55% 79%
Table 7. Electricity cost learning curves in % of the maximum starting value in 2005 as function of
direct normal irradiation (DNI in kWh/m²/y) for CSP reference plants with a solar multiple SM4,
compared to the cost of power generation by fossil fuels (including carbon costs) according to [9]*
- 10 -SolarPaces Conference Berlin, September 2009
Literature
[1] Cohen, G.E., Solar Steam at Nevada Solar One, SolarPaces Conference, Las Vegas, USA, 2008
[2] Eck, M., Rueda, F., Kronshage, S., Schillings, C., Trieb, F., Zarza, E., Solar Thermal Power Plants for
the Spanish Electricity Market, Int. J. Energy Technology and Policy, Vol.5, No.3 (2007), 261-270
[3] ECOSTAR 2005: Pitz-Paal, R., Dersch, J., Milow, B., European Concentrated Solar Thermal Road
Mapping, ECOSTAR, SES6-CT-2003-502578, European Commission, 6th Framework Programme,
German Aerospace Center, Cologne 2005 ftp://ftp.dlr.de/ecostar/ECOSTAR_Roadmap2005.pdf
[4] MED-CSP 2005: Trieb, F., Schillings, C., Kronshage, S., Viebahn, P., May, N., Paul, C., Klann, U.,
Kabariti, M., Bennouna, A., Nokraschy, H., Hassan, S., Georgy Yussef, L., Hasni, T., Bassam, N.,
Satoguina, H., Concentrating Solar Power for the Mediterranean Region (MED-CSP), Internet
Publication of Final Report, German Aerospace Center (DLR), Study for the German Ministry of
Environment, Nature Conversation and Nuclear Safety, Stuttgart 2005, www.dlr.de/tt/med-csp
[5] Müller-Steinhagen, H., Trieb, F., Concentrating Solar Power for Sustainable Electricity Generation- Part
1: Technology Review, ingenia, Royal Academy of Engineering, No. 18, (2004), 43-50
[6] NASA 2008: Surface meteorology and Solar Energy, A renewable energy resource web site (release
6.0) sponsored by NASA's Earth Science Enterprise Program http://eosweb.larc.nasa.gov/sse/
[7] Nebrera, J. A., Solar Thermal Power Generation - A Spanish Success Story, Feria Internacional de
Energia y Medio Ambiente (genera08), Madrid, February 2008
[8] Neij, L., Experience Curves: A Tool for Energy Policy Assessment, Lund University, European
Commission, Lund 2003, http://www.iset.uni-kassel.de/extool/Extool_final_report.pdf
[9] Nitsch, J., Lead Study 2008: Further development of the 'Strategy to increase the use of renewable
energies' within the context of the current climate protection goals of Germany and Europe; Study
commissioned by the German Federal Ministry for the Environment, Nature Conservation and Nuclear
Safety (BMU), Berlin 2008 http://www.bmu.de/english/renewable_energy/downloads/doc/42726.php
[10] REACCESS 2008: Risk of Energy Availability: Common Corridors for Europe Supply Security,
European Commission Grant Agreement No.212011, http://reaccess.epu.ntua.gr/
[11] Richter, C., Teske, S., Nebrera, J.A., Concentrating Solar Power – Global Outlook 2009, Greenpeace,
SolarPaces and ESTELA 2009
[12] Tamme, R., Steinmann, W.D., Laing, D., 2004: High temperature thermal energy storage technologies
for parabolic trough. J. Solar Energy Eng., 126 (2) (2004) 794–800
[13] TRANS-CSP 2006: Trieb, F., Schillings, C., Kronshage, S., Viebahn, P., May, N., Paul, C., Klann, U.,
Kabariti, M., Bennouna, A., Nokraschy, H., Hassan, S., Georgy Yussef, L., Hasni, T., Bassam, N.,
Satoguina, H., Trans-Mediterranean Interconnection for Concentrating Solar Power (TRANS-CSP),
Internet Publication of Final Report, German Aerospace Center (DLR), Study for the German Ministry
of Environment, Nature Conversation and Nuclear Safety, Stuttgart 2006, www.dlr.de/tt/trans-csp
[14] Trieb, F., Müller-Steinhagen, H., Europe-Middle East-North Africa Cooperation for Sustainable
Electricity and Water, Sustainability Science Vol.2, No.2 (2007), 205-219
[15] Viebahn Peter; Kronshage, Stefan; Trieb Franz; Lechon Yolanda (2008): Final Report on Technical
Data, Costs, and Life Cycle Inventories of Solar Thermal Power Plants. Deliverable 12.2 – RS I a of EU
IP-NEEDS. www.needs-project.org
Acknowledgement: We thank Paul Stackhouse from NASA Langley Research Center for
providing the NASA SSE 6.0 dataset.
- 11 -You can also read