Forecasting and Planning Update - July 6, 2020 Webinar - Independent Electricity ...
←
→
Page content transcription
If your browser does not render page correctly, please read the page content below
Forecasting and Planning Update

July 6, 2020
Webinar

Agenda
9:00     Forecasting and Planning Update
         • Update: Market operations and pandemic response
         • Value of Interties During COVID-19
         • Demand impacts of COVID-19
         • Revised 5-year demand outlook

10:30    Break

11:00    The Brattle Group: COVID-19 Impacts on North
         American Electricity Markets
2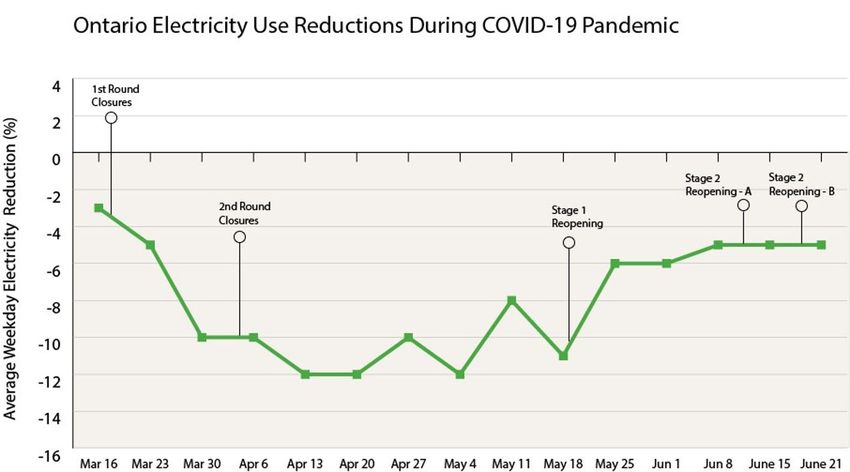
Today’s Webinar Presenters

Terry Young, Vice President of Policy, Engagement and Innovation
Chuck Farmer, Senior Director, Power System Planning
Tam Wagner, Senior Manager, Operational Effectiveness
Nicola Presutti, Senior Manager, Market Forecasts & Integration
Tom Chapman, Senior Manager, Market Development & Strategy
Kausar Ashraf, Senior Manager, Demand & Conservation Planning
Jordan Penic, Senior Manager, Engagement and Indigenous Relations

3
MARKET OPERATIONS UPDATE

4
Pandemic Response and Recovery

• As the province evolves to Phase 2 of reopening Ontario, the electricity
sector is also evolving to ensure that we continue to provide the
essential service required to allow businesses to successfully reopen
• While essential electricity sector staff have continued to work
throughout this pandemic, plans to return other staff to the workplace
have been put in place
    - The health and safety of employees remain the top priority
• Return-to-office plans include:

5
Pandemic Response and Recovery (Continued)

    - A phased approach that staggers the return of staff to the office to
     ensure physical distancing can be maintained while others continue
     to work from home
    - Enhanced protocols including cleaning, personal protective
     equipment, limited business travel, etc.
    - Regular communications and training to increase awareness and to
     set and manage expectations for the ‘new normal’
    - A strategy that is flexible to allow incorporating lessons learned and
     changing circumstances
6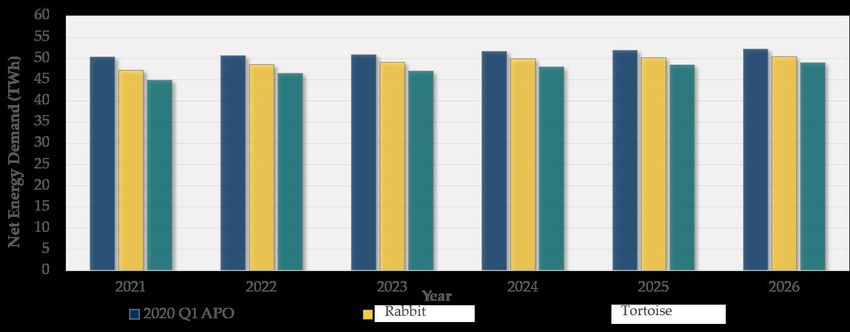
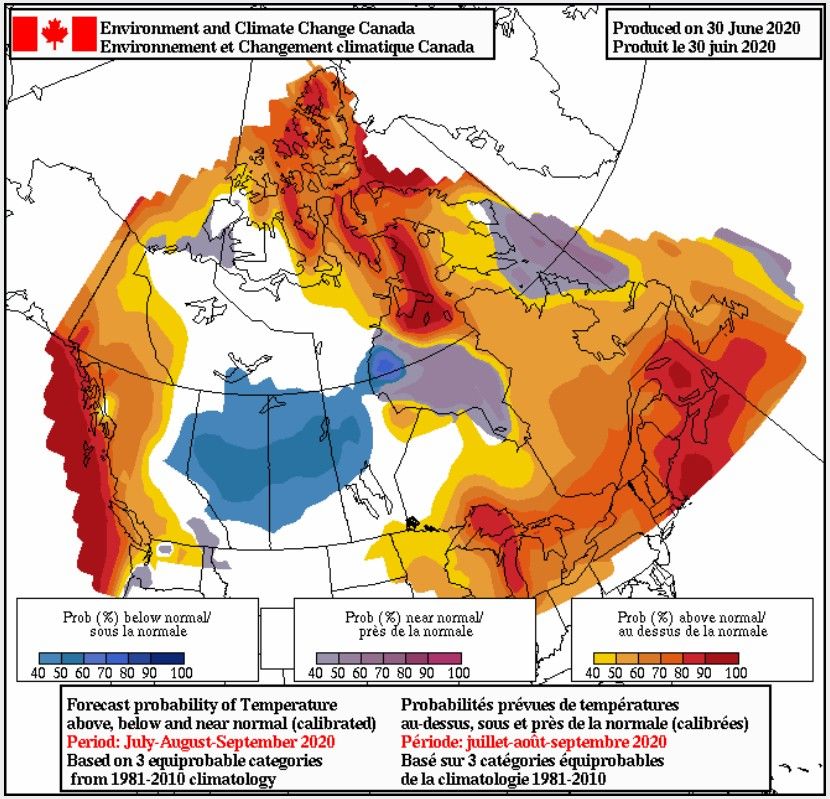
Summer Outlook - Weather

       Environment Canada predicts that summer 2020 will have above normal temperatures.

7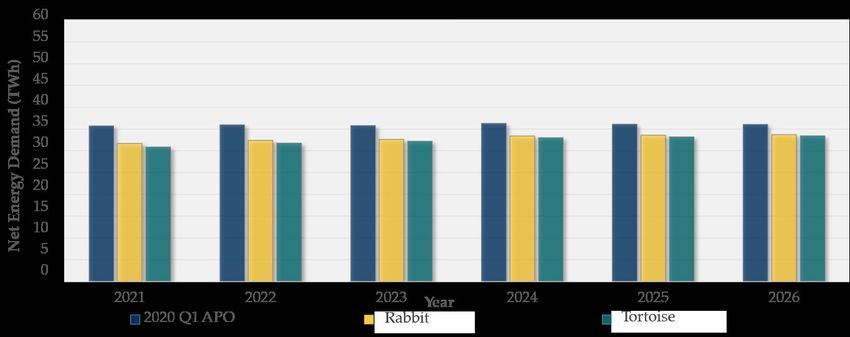
Summer Preparations

• Implement readiness procedures with Market Participants by:
    - Testing generators for Unit Readiness
    - Coordinating outage plans with the transmitters and neighbouring
     areas
    - Collaborating with gas pipeline operators on gas availability.
• Continue to monitor for extreme conditions and issue alerts as
appropriate

8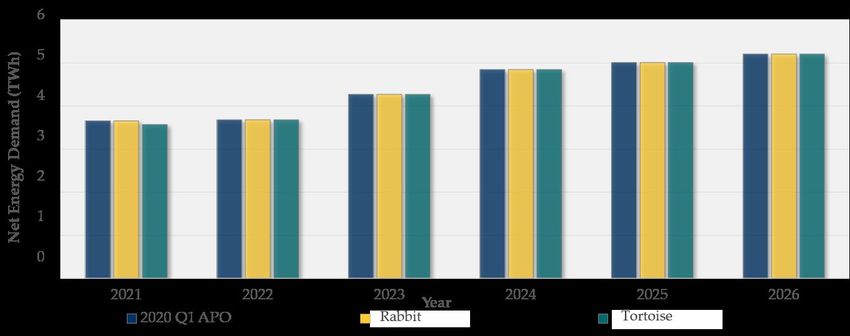
Summer Preparations (Continued)

    - Forest fires have already been present in Northeastern Ontario
     • Pose a threat to transmission elements
     • Is an early indicator of potential dry conditions for the northern
       hydroelectric fleet
• Continue to monitor risks to grid operations as a result of COVID-19,
including potential increased absenteeism across the sector.

9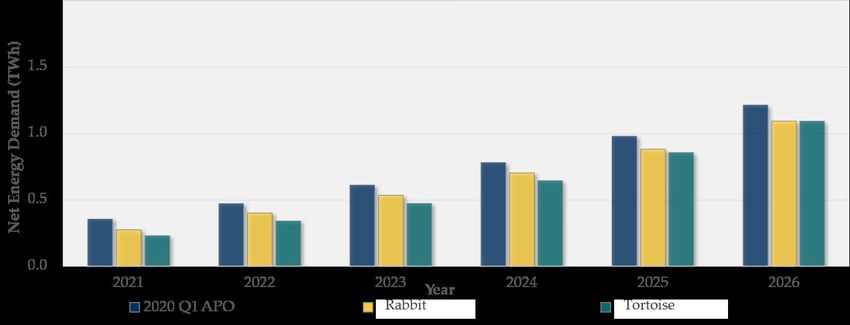
Summer Preparations (Continued)

• Potential risks in summer 2020 and summer 2021 are expected to be
mitigated by outage rescheduling. The IESO continues to monitor the
situation and will provide updated assessments when more information
becomes available.
• Ontario’s electricity system is well-positioned for the next 18 months
and expected to be adequate under both the normal weather and
extreme weather scenarios.

10
2020Q2 Reliability Outlook – Summer 2020 Reserve Above
Requirement (RAR) Outlook

http://www.ieso.ca/en/Sector-Participants/Planning-and-Forecasting/Reliability-Outlook

                                                                                         9
Questions
VALUE OF INTERTIES DURING COVID-19

13
Operational Value during COVID

• From an operational perspective, the interties are some of Ontario’s
 largest and most flexible assists, and are able to effectively compliment
 the operation of other resources
• Trading over the ties helped ensure supply and demand remained in
 balance providing operational benefits
• In recent months exports have provided valuable markets for Ontario’s
 baseload hydroelectric and nuclear fleet
     - Avoided the need to spill water at hydroelectric plants

14
Operational Value during COVID (Continued)
- Avoided the need to maneuver or shut down nuclear plants
- Avoided curtailments of renewable resources
15Economic Value during COVID
• Throughout 2019, benefits to Ontario consumers from intertie trade
exceeded $360 million
- These benefits to Ontario consumers have continued since the start of
the COVID 19 pandemic, with March 01 to May 31, 2020 incremental
benefits estimated at $75-107 million
16Economic Value during COVID (Continued)
Incremental Revenue Contributions to Fixed Avoided System Costs
Generation System Costs
• Traders often pay a • Exports help pay for • Trade can avoid the need
premium (called intertie
congestion rents) to
export power and the
+ system costs that would
otherwise have to be paid
for by Ontario consumers
+ to maneuver and curtail of
nuclear, hydro and
renewable generators
majority of that premium e.g. the cost of maintaining reducing Global
is returned to Ontario intertie assets as well as Adjustment costs for
consumers wholesale system costs Ontario consumers
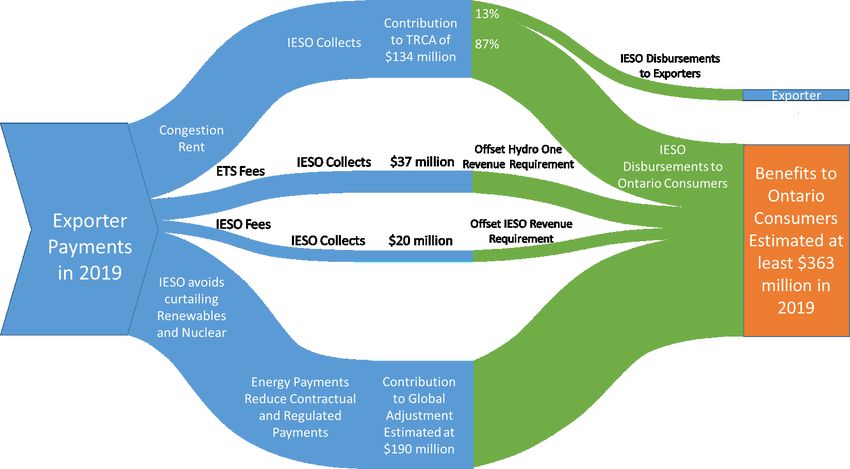
17Economic Benefits of Competitive Exports – 2019
Notes:
• All values to scale
• TRCA is the Transmission Rights Clearing Account
• ETS is the Export Transmission Service Charge
• Estimates do not include exporter contributions to all uplift costs which would further increase benefits to consumers, likely similar in size to
the ETS fee
14Snapshot of Economic Benefits: March to May 2020 During these difficult times, exports have significantly helped reduced costs for Ontario consumers From March to May 2020, the total benefits from exports is estimated at $90 million
Questions
UPDATE: DEMAND OBSERVATIONS AND
INSIGHTS

                            17
Timeline of Closures & Reopening in Ontario
The Government of Ontario had announced that their province would
take a staged approach to reopening the economy. The timeline for
reopening by location has been the following:
Please see table on next slide
18Timeline of Closures & Reopening in Ontario (Continued)
Event Date Notes
1st Round of Closures March 17 State of emergency declared in Ontario
2nd Round of Closures April 4 Additional closures, resulting in further reductions in electricity
demand
Stage 1 Reopening May 19 All construction, as well as certain health and medical services,
seasonal and recreational activities, and household and animal
services can now resume operations. M inim al im pact to
electricity dem and
Stage 2 Reopening – A June 12 Stage 2 reopening for all regions in Ontario except for the GTA,
Hamilton, Niagara, and Windsor-Essex, June 12-18
Stage 2 Reopening – B June 19 Stage 2 reopening for all regions in Ontario except for Toronto,
Peel, and Windsor-Essex June 19-23
Stage 2 Reopening – C* June 24 Stage 2 reopening for all regions in Ontario except for Windsor-
Essex, June 24 – July 1st
• * Note: Stage 2 reopening C has just recently begun. More observations are required before the results and impacts can be determined.
18COVID-19 Impacts on Demand - Closures
The stay in place policies in conjunction with the closure of non-essential
businesses have had the following system wide impacts on grid demand:
• Overall, energy, minimum and peak demands were significantly
reduced
• Closures due to COVID resulted in on average 10% reduction in
energy consumption and 9% reduction in peak demand, before Stage
2 reopening commenced on June 12.
24COVID-19 Impacts on Demand – Closures (Continued)
Avg. Daily Energy Avg. Daily Energy Avg. Daily Peak Avg. Daily Peak
Reductions compared Reductions compared to Reductions compared to Reductions compared to
to pre-COVID pre-COVID pre-COVID pre-COVID
Weekday Weekend Weekday Weekend
Overall System
7-14% 6-10% 8-14% 5-10%
Impacts
1st Round
3 -11% 2-8% 3-13% 4-7%
of Closures
2nd Round
7-14% 6-10% 8-14% 5-10%
of Closures
25COVID-19 Impacts on Demand - Reopening Stage One reopening had minimal impacts on the electricity system. However, the system started to evolve once Stage 2 began. The following impacts, reflect system impacts as of June 22nd The change in demand reductions are as follows: • Overall, we expect energy, minimum demands and peak demands to gradually increase over the coming weeks 26
COVID-19 Impacts on Demand – Reopening (Continued)
                       Avg. Daily Energy     Avg. Daily Energy       Avg. Daily Peak          Avg. Daily Peak
                     Reductions compared   Reductions compared   Reductions compared to   Reductions compared to
                         to pre-COVID          to pre-COVID            pre-COVID                pre-COVID

                           Weekday               Weekend                Weekday                 Weekend

      2nd Stage of
                            4-7%                  5-6%                   1-6%                     2-5%
     Reopening A
      2nd Stage of
                            4-5%                  2-6%                   4-5%                     1-7%
     Reopening B

27
COVID-19 Impacts on Ontario Electricity Demand 28
Demand Impacts Summary
• Closures due to COVID resulted in on average 10% reduction in energy
 consumption and 9% reduction in peak demand
• ICI curtailment activity had been reduced due to COVID-19 before the
 hiatus was announced
• Since June 12, the following impacts have been observed compared to
 demand before Stage 2 reopening:
Residential segment:
     - Energy consumption is lower by 4% on average

29
Demand Impacts Summary (Continued)
- Even with slight decreases, because residential demand is very
sensitive to hot and humid weather, it is believed to be the cause of
seeing system peaks similar to pre-COVID during heat waves
• Commercial segment: Demand has recovered by 4-5%
• Distribution connected commercial and industrial: Demand has
recovered by 8-12 %
• Transmission connected wholesale customers: Demand has
recovered by 5-6% (excluding ICI activity)
30Heat Wave Impacts by Customer Segment Demand
• During heat-waves, the overall energy used in the residential sector
increased by 9% compared to pre-COVID levels
- This led to similar system energy and peak compared to pre-COVID
levels.
• Example of heatwave days were: May 25-27, June 9-10, June 17-22
• The changes are shown in the table on the next slide, where red
indicates demand decreases, and green indicates demand increases
31Heat Wave Impacts by Customer Segment Demand
(Continued)
Avg. Daily Energy Change compared to Avg. Daily Peak Change compared to
Customer Segment similar days pre-COVID similar days pre-COVID
System 1-7% (-) 0-6% (-)
Residential 3-17% (+) 3-19% (+)
Small Commercial 8-13% (-) 9-16% (-)
Dx Connected
Industrial/Commercial 8-14% (-) 3-12% (-)
Tx Connected
Industrial/Commercial 8-17% (-) 6-17% (-)
32REOPENING DEMAND IMPACTS BY SEGMENT 33
Residential Demand Impacts - Reopening
• On average, energy consumption reduced by 2% since reopening,
 though there is high variability in numbers due to hot weather
• Impacts vary depending on weather trends and during heatwaves since
 Stage 2 reopening, energy consumption is increased by 7% compared
 to pre-COVID levels
• Looking forward: returning to pre-COVID residential demand will be
 gradual, as many people continue to work from home throughout the
 summer

34
Residential Demand Impacts – Reopening (Continued)
     Stage              Avg. Daily Energy      Avg. Daily Energy       Avg. Daily Peak      Avg. Daily Peak
                     Increases compared to   Increases compared to   Increases compared   Increases compared
                           pre-COVID               pre-COVID            to pre-COVID         to pre-COVID

                            Weekday                 Weekend                Weekday              Weekend

     2nd Stage of
                             1-14%                    1-6%                 1-15%                9-11%
     Reopening A
      2nd Stage of
                              1-5%                   1-10%                  1-5%                2-11%
     Reopening B

35
Small Commercial (
Small Commercial (
Distribution Connected Industrial/Commercial Customers
     Demand Impacts - Reopening
• Energy consumption has recovered by 10% and Peak consumption by
 12% on average since Stage 2 reopening
• Recovering more quickly than small commercial
• Majority of commercial load is weather sensitive, therefore impacts will
 range depending on weather

38
Distribution Connected Industrial/Commercial Customers
Demand Impacts – Reopening (Continued)
Avg. Daily Energy Avg. Daily Energy Avg. Daily Peak Avg. Daily Peak
Stage Reductions compared to Reductions compared to Reductions compared to Reductions compared to
pre-COVID pre-COVID pre-COVID pre-COVID
Weekday Weekend Weekday Weekend
2nd Stage of
9-15% 4-7% 7-15% 1-5%
Reopening A
2nd Stage of
10-15% 6-15% 7-8% 3-4%
Reopening B
39Transmission Connected Wholesale Customer Demand Impacts
- Reopening
• Energy consumption is up by 5% since reopening on average on non-
ICI days
• This load is typically not very weather sensitive
• The automotive industry was the first sector which saw increases, and
began trending upwards around May 11
• Steel began to return on May 25, following Stage 1 reopening
• Looking forward, a gradual increase is expected in all sectors, up to
pre-COVID levels
40Transmission Connected Wholesale Customer Demand Impacts
– Reopening (Continued)
Avg. Daily Energy Avg. Daily Energy Avg. Daily Peak Avg. Daily Peak
Stage Reductions compared Reductions compared Reductions compared to Reductions compared to
to pre-COVID to pre-COVID pre-COVID pre-COVID
Weekday Weekend Weekday Weekend
2nd Stage of
3-15% 11-12% 2-12% 6-7%
Reopening A
2nd Stage of
9-13% 9-12% 17-18% 10-11%
Reopening B
41Questions
UPDATED DEMAND FORECAST AND
SCENARIOS
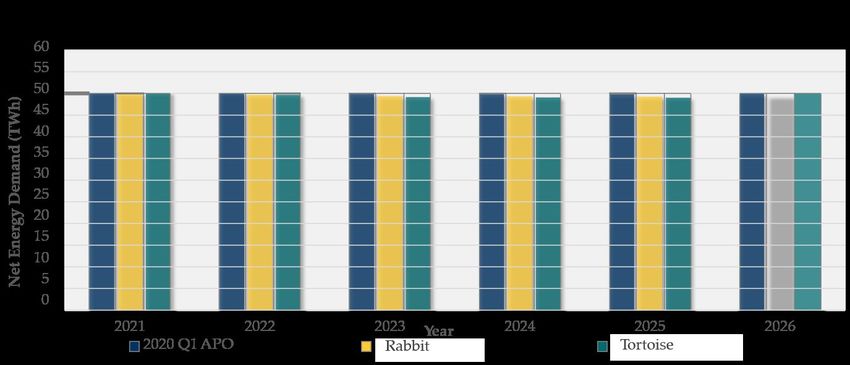
30Summary: Updated Demand Forecast
• The IESO released its first Annual Planning Outlook in January (2020
APO)
• Given level of uncertainty, the updated demand forecast will not include
a reference forecast, but will present scenarios for the 2021 – 2026
period
• Two scenarios will be assessed representing the range of likely COVID-
19 impacts and resulting economic conditions. Under both scenarios,
electricity demand is expected to be lower than forecasted in the
2020 APO
31Summary: Updated Demand Forecast (Continued)
1. Rabbit: shallow recession, fast recovery, electricity demand lower
by about 5% in 2021 recovering to about 4% in 2026*
2. Tortoise: deep recession, slow recovery, electricity demand lower
by about 7% in 2021 recovering to about 5% in 2026*
• For the purposes of the updated demand forecast scenarios, ICI
impacts have not been included in the demand forecasts and will be
treated instead as a supply side resource (similar to Demand Response)
* variances relative to 2020 APO Reference Case demand forecast
31Demand Forecast Scenario Definitions
• In both scenarios, the 2020 APO Reference Case demand forecast was
used as baseline
1. Rabbit scenario:
• Economic recovery initiated in 2020 Q3 continues through 2021 as
COVID-19 measures are phased out
• Electricity demand recovers to 2019 levels by 2022 Q1, (electricity
demand in 2022 is approximately 4% lower vs. 2020 APO)
2. Tortoise scenario:
46Demand Forecast Scenario Definitions (Continued)
• Prolonged COVID-19 impacts persist through 2020 and through 2021
Q1, leading to economic damage and significant prolonged unused
capacity in the economy, particularly in the commercial sector
• A global recession takes hold on the scale of the 2007/8 Financial Crisis
• Economy restructures over time as global conditions and new
domestic conditions take hold
• Electricity demand recovers slowly at 1%, reaching 2019 levels by
2025 Q4, (electricity demand in 2025 is approximately 6% lower vs.
2020 APO)
47Demand Forecast Scenario Assumptions
Rabbit – shallow recession, fast recovery
2021 Q1 COVID-19 measures phased-out
2021 Q2 - Q4 Acceleration of economic recovery
2022 Q1 Economic recovery realized
Electricity demand remains lower than 2020 APO (~4%)
2022 - 2026 Rates of electricity demand growth consistent with 2020 APO
Tortoise – deep recession, slow recovery
2021 Q1 COVID-19 State-of-Emergency persists,
including full social-distancing measures in place
2021 Q2 - Q4 COVID-19 measures slowly phased-out
2022 - 2024 Slow economic recovery
2025 Q4 Economic recovery realized
Electricity demand remains lower than 2020 APO (~6%)
2026 Rate of electricity demand growth consistent with 2020 APO
48Updated Demand Forecast Summary
Note: The 2020 APO aassumed 1.600 MW peak reduction due to ICI. The
updated demand forecast does not assume peak demand reduction due to ICI.
34Updated Demand Forecast Summary (Continued)
Note: The 2020 APO aassumed 1.600 MW peak reduction due to ICI. The
updated demand forecast does not assume peak demand reduction due to ICI.
34Residential Sector Summary
• It is assessed that maximum social distancing measures, and thus
maximum residential sector occupancy, are currently in place,
indicating the observed increase in residential demand attributable to
COVID-19 of 5% is the maximum level
• Net residential sector energy demand effectively flat compared to 2020
Q1 APO
51Residential Sector Summary (Continued)
52Commercial Sector Summary
• Electricity demand in overall commercial sector is seeing dramatically decrease
due to COVID-19
1. It is estimated that only a few sub-sectors’ demand shows slight increases
ranging from 1-5%: food retail and hospitals
2. Nursing homes and warehouse show steady trend
3. Most other commercial buildings include offices, non-food retails, recreation
centers, educational facilities, and restaurants shows a decrease 25-50% in
full lock down period, rather than 100%. Despite closures, the residual
electricity demand for “care and maintenance” mode remains considerable
accounting for minimum building ventilation and auxiliary system operations
53Commercial Sector Summary (Continued)
54Industrial Sector Summary
• Industrial sector and sub-sector electricity demand Pandemic impacts
were inferred from observed IESO’s wholesale customer load data by
NAICS Codes, and internal industry news update
• Demand for fabricated metals, auto, non-metallic minerals and primary
metals dropped more than 20% during full locked-down period. Other
subsector demand dropped less than 20% due to short-term
operational impact because of social distancing
55Industrial Sector Summary (Continued)
56Agricultural Sector Summary
• There have been concerns of decrease in available labour force to
plant, maintain and harvest crops due to reliance on foreign labour
workers. The federal and provincial government has been quick to act
and support this sub-sector through policy direction and financial
support
• In the Rabbit scenario, we assume no changes to the agricultural
sector demand growth. The Tortoise scenario assumes slight delays in
the pace of the increased load which leads to a minor difference in
demand in 2021. But this delay is expected to recover by 2022
57Agricultural Sector Summary (Continued)
58Electric Vehicle Electricity Demand
• Electric vehicle electricity demand is a result of:
1. Electric vehicle sales, influenced by economic outlooks and
represents additions to the provincial electric vehicle population, as
well as
2. Electric vehicle distance traveled, which is influenced by policies
such as social distancing measures, work-from-home policies, both
which are expected to be withdrawn on a phased approach, as
well as and temporary or permanent closures of businesses
59Electric Vehicle Electricity Demand (Continued)
60Electricity Conservation Programs
• The latest Conservation Program savings forecast includes updates to:
1. 2015-2020 CFF Programs projects completed in year 2018 (true-up)
2. CFF WD project savings, which included CFF projects initiated prior
to the discontinuation of CFF on March 21, 2019, but not yet
completed, and
3. Interim Framework on Energy Efficiency Programs for 2019-2020
• The main impact is of these updates is that Interim Framework savings
are expected to materialize over a longer multi-year period rather
originally forecasted
61Electricity Conservation Programs (Continued)
62Updated Demand Forecast Summary
63Updated Demand Forecast Summary (Continued)
64Questions
65Summary
• Ontario’s electricity system is well-positioned for the summer, with
adequate supply to meet demand and to manage the expected
increased peak demand due to ICI hiatus
• Electricity demand has been ramping up with warmer temperatures
and staged economic reopening
• Peak demands compare to prior years due to the combination of
increased residential air conditioning load as working from home
continues and commercial buildings gradually increase occupancy
• July 22 webinar will include updated revised capacity and
• energy adequacy assessment results
66Question?
What information from the IESO would you like to see in future
Forecasting and Planning Updates?
Please submit your response using the ‘Ask a Question’ feature or
contact IESO Customer Relations
67APPENDIX – CLOSURE IMPACTS BY SECTOR 68
Residential Demand Impacts – Closures

• Increased consumption during mid-day
• Delayed morning peak and using on average 13% more electricity
 during morning peak vs. pre-COVID-19 levels
• Daily minimums have increased 5% on average
• Impacts vary depending on weather trends
• Looking forward: returning to pre-COVID residential demand will be gradual

69
Residential Demand Impacts - Closures (Continued)
     Stage           Avg. Daily Energy    Avg. Daily Energy       Avg. Daily Peak         Avg. Daily Peak
                    Increases compared   Increases compared   Increases compared to   Increases compared to
                       to pre-COVID         to pre-COVID            pre-COVID               pre-COVID

                          Weekday              Weekend                Weekday               Weekend

     1st Round of
                            1-8%                 1-8%                  1-7%                  1-6%
     Closures
     2nd Round of
                           1-14%                 1-7%                  1-9%                  1-9%
     Closures

70
Small Commercial (
Small Commercial (
Distribution Connected Industrial/Commercial
     Customers Demand Impacts - Closures
• Contribution to morning peak has been reduced by 15%
• Greatest reductions occurred during the week following Easter
• Looking forward: Similar to small commercial, the duration of the lock
down measures will have enduring impacts on their ability to return to
pre-COVID-19 levels
• Majority of commercial load is weather sensitive, therefore impacts will
 range depending on weather forecasts

73
Distribution Connected Industrial/Commercial
Customers Demand Impacts – Closures (Continued)
Avg. Daily Energy Avg. Daily Energy Avg. Daily Peak Avg. Daily Peak
Stage Reductions Reductions Reductions Reductions
Weekday Weekend Weekday Weekend
1st Round of
9-18% 9-13% 9-21% 10-16%
Closures
2nd Round of
12-20% 9-15% 11-21% 4-15%
Closures
74Transmission Connected Wholesale Customer Demand
Impacts - Closures
• The automotive sector has been hit the hardest at the beginning of
COVID in March
• Minimal impacts to the majority of the industrial load
• Looking forward: supply chain demand and transportation networks will
have a high impact on the ability of these loads to return to pre-
COVID-19 levels
• This load is typically not very weather sensitive
75Transmission Connected Wholesale Customer Demand
Impacts – Closures (Continued)
Stage Avg. Daily Energy Avg. Daily Energy Avg. Daily Peak Avg. Daily Peak
Reductions Reductions Reductions Reductions
Weekday Weekend Weekday Weekend
1st Round of
1-12% 1-6% 1-14% 1-9%
Closures
2nd Round of
10-25% 8-25% 11-22% 10-23%
Closures
76APPENDIX – DEMAND FORECAST PROJECTIONS 77
Demand Forecast Projections
Sector
              Rabbit                      Tortoise                      2020 APO – Reference Case
              (2021-2026)                 (2021-2026)                   (2020 - 2026)

                                          Social distancing measures
                                          persist in 2021 and reduced
              Demand decreases slightly   economic activity in later    Demand flat at
Residential   from 50 TWh in 2021                                       approximately
                                          years lead to demand
              to 49.5 TWh in 2026         decreases from 50.5 TWh in    50 TWh for 2020 – 2026
                                          2021 to 49.3 TWh in 2026
              Demand evolves              Demand evolves                Demand grows
              from 47.2 TWh in 2021       from 44.8 TWh in 2021         from 49.7 TWh in 2020
Commercial
              to 50.4 TWh in 2026         to 48.9 TWh in 2026           to 52.2 TWh in 2026,
                                                                        average of 0.8% / year
              Demand evolves              Demand evolves                Demand grows
              from 31.7 TWh in 2021       from 30.9 TWh in 2021         from 35.6 TWh in 2020
Industrial
              to 33.8 TWh in 2026         to 33.5 TWh in 2026           to 36.1 TWh in 2026,
                                                                        average of 0.2% / year

78
Demand Forecast Projections (Continued)
Sector Rabbit Tortoise 2020 APO – Reference Case
(2021-2026) (2021-2026) (2020 - 2026)
Agriculture No change versus Delayed load connections in 2021 Demand grows
2020 APO only due to infrastructure from 3.6 TWh in 2020
construction delays as a result of to 5.2 TWh in 2026,
social distancing measures average of 6.2% /
year
Electric Decreased EV production, sales and Decreased EV production, sales and Demand grows from 0.3 TWh in
Vehicles utilization according to economic utilization according to economic 2020 to 1.2 TWh in 2026, average
activity. activity. of 30% / year
Demand lags 2020 APO by about 0.1 Demand lags Rabbit by about 0.07
TWh per year TWh per year until 2025
Conservation Based on updates to 2018 CFF, Based on updates to 2018 CFF, Based on early March 2019 CFF
Program 2019 – 2020 CFF WD and actual 2019 – 2020 CFF WD and actual WD & IF assumptions, 2.2 TWh
Framework IESO CDM Plan approved in IESO CDM Plan approved in annual savings implemented by
June 2019 which includes June 2019 which includes 2021
assumptions of 2.7 TWh annual assumptions of 2.7 TWh annual
savings implemented by 2022 savings implemented by 2022
79Thank You ieso.ca @IESO_Tweets 1.888.448.7777 facebook.com/OntarioIESO customer.relations@ieso.ca linkedin.com/company/IESO engagement@ieso.ca
You can also read