SOCIAL IMPACT OF CLEAN ENERGY - SESSION 3 OCTOBER 1, 2020 - Women in Clean Energy Conference - University of Dayton
←
→
Page content transcription
If your browser does not render page correctly, please read the page content below
SESSION 3   • OCTOBER 1, 2020

SOCIAL IMPACT OF
  CLEAN ENERGY
 Women in Clean Energy Conference
SESSION 3   • OCTOBER 1, 2020

   CLEAN ENERGY
IMPLEMENTATION AND
   DEVELOPMENT
  Women in Clean Energy Conference
                                     NATASHA WRIGHT
                                        Assistant Professor of
                                         Mech. Engineering
                                       University of Minnesota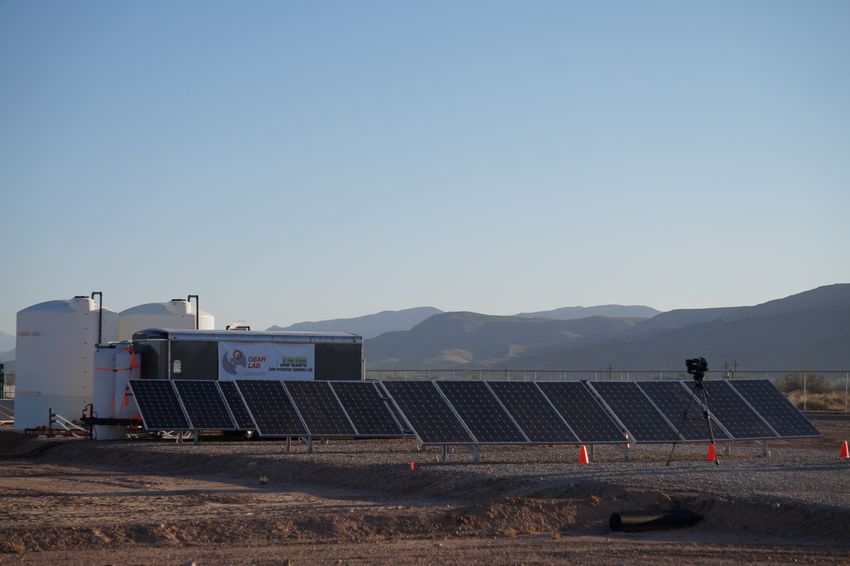
Desalination in Global Development:
Exploring the Water-Energy Nexus
Prof. Natasha C. Wright

                                            GEAR
University of Minnesota                     LAB
Department of Mechanical Engineering              3
                                         MIT GLOBAL ENGINEERING
                                       AND RESEARCH LABORATORY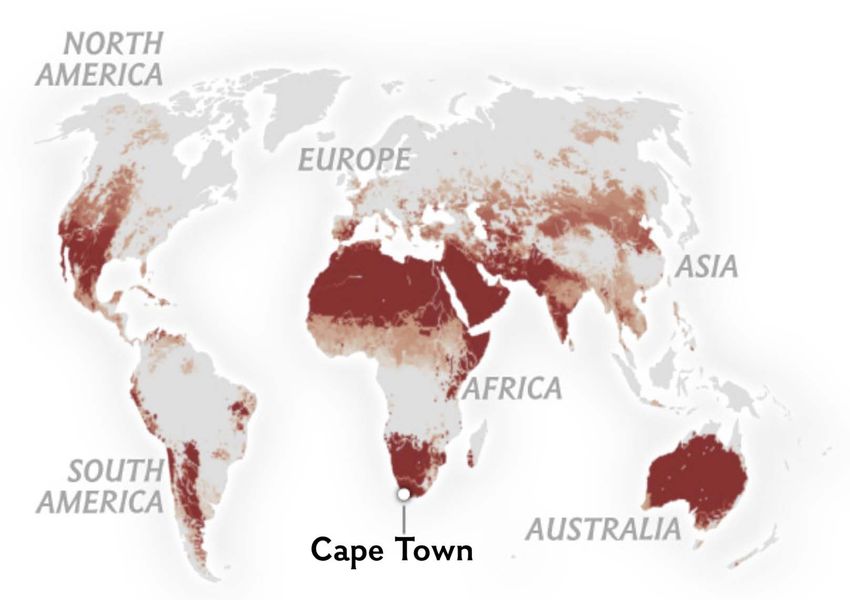
The Water-Energy Nexus
                                                                               Water is used to create
                                                                               energy, and energy is
                                                                               used to extract, treat,
                                                                                transport, heat/cool,
                                                                               and dispose of water.

                                                                             Why is desalination so energy
                                                                                      intensive?

                                                                              How can we use less energy?

                                                                              How can we move off-grid?

                                                                                Why is this of particular
                                                                                 relevance in LMICs?

                                                                                                             4
Metzger et al. Water-Energy Nexus: Business Risks and Rewards, Jan 2016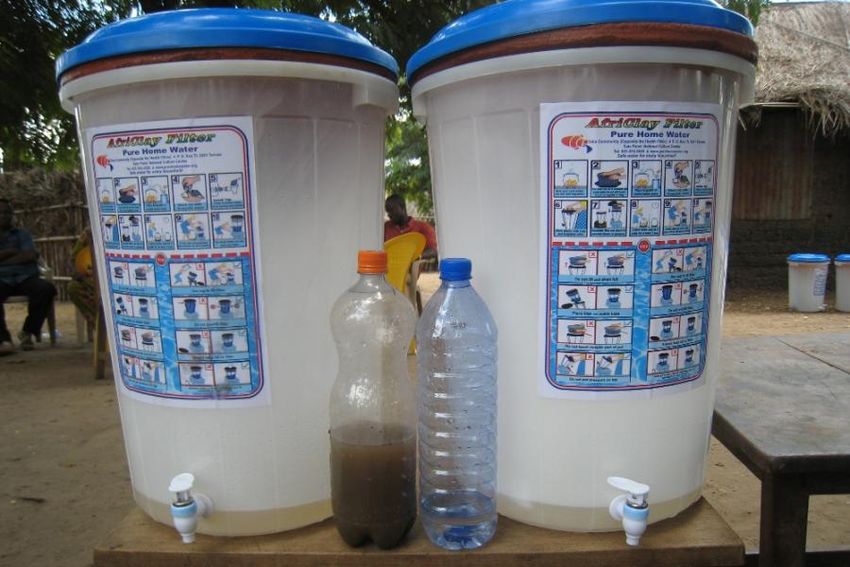
Around the World:

         40% of total global desalination capacity is treating brackish,
         inland, or wastewater sources;

         Equating to a production capacity of 40.7 million m3 / day.

                                  “Day Zero” – when tap water will have to be shut off
DesalData Analysis (2017).
Images by: SOREN WALLJASPER, National Geographic. Data from: MESFIN M. MEKONNEN, ARJEN Y. HOEKSTRA, Sustainability, 2016
January 2013 6
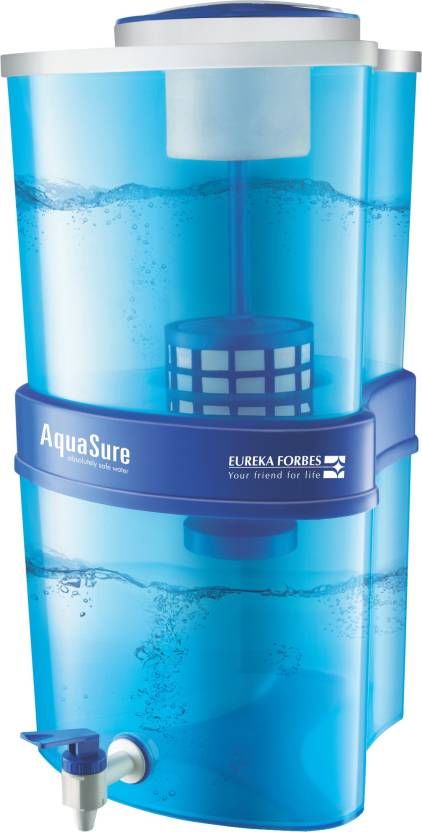
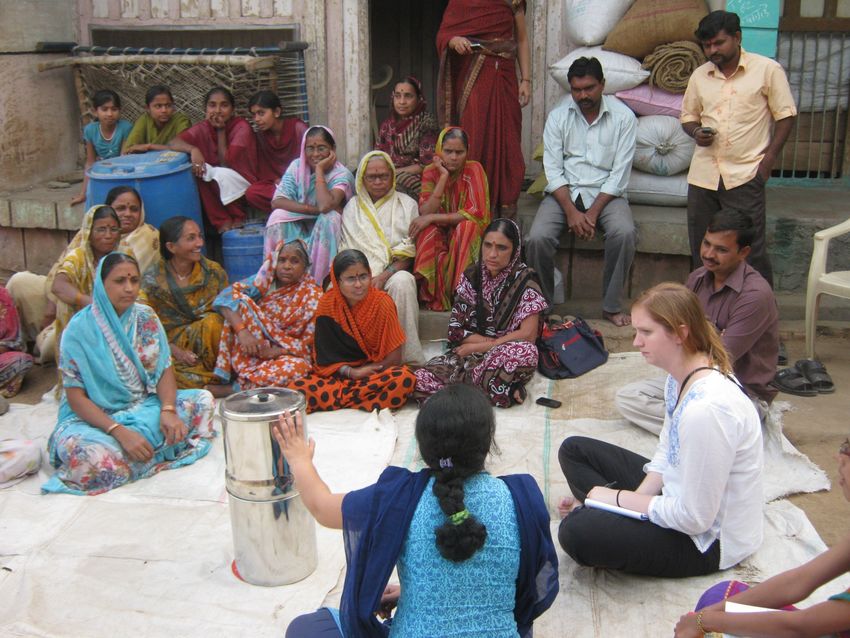
Our water…
                      “makes it hard to digest”
       “tastes bad”
                         “ruins our cookware”
        “tastes salty”

even “the plastic ones” still have the same “salty taste”

                                                                                       http://www.rei.com/product/860034/lifestraw-water-filter
                                                                                                 http://pottersforpeace.org/?attachment_id=143
                                                                                       https://www.crowdrise.com/o/en/team/pure-home-water
                                                                                                                                7
                                                                   http://www.tataswach.com/know_tata_swach/smart_choice_of_safety.html8
                               https://www.flipkart.com/eureka-forbes-aquasure-xtra-tuff-15-l-gravity-based-water-purifier/p/itmdzh2fzkmzasdw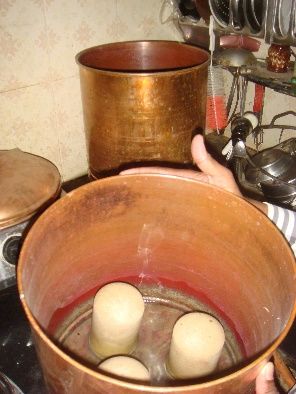
Percent Distribution of Rural Households by Method of Treatment
                                                                                   Other
                                                                                                                    Add alum powder, bleach, or chlorine
                                                                                               Boil

                                                                                                              Strain
                                                                                                             Through
                                                                                                              Cloth

                                                                                                                                           Water Filter/Purifier
                                                         No Treatment
                                                                              71.3%

                                                                                                                                                                         8
nternational Institute for Population Sciences (IIPS) and Macro International. National Family Health Survey (NFHS-4), 2015-2016: India: Volume I. Mumbai: IIPS, 2018.
Over 60% of land area underlain with groundwater with salt
      contents above the recommended level (500 mg/L)

                                                                                                                                                                          Groundwater
                                                                                                                                                Piped
                                                                                                                                           into dwelling or               Piped or Public Tap
                                                                                                                                              public tap
                                                                                                                                                                          Bottled Water

                                                                                                                                                33.7%                     Tanker Truck

                                                                                                                                                                          Surface water
                                                                                                                 Groundwater
                                                                                                                tube well, borehole, dug well
                                                        < 480 mg/L                                                                                                        Protected Spring or Rainwater
                                                                                                                           60.5%
                                                        480 - 960 mg/L                                                                                                    Unprotect Spring
                                                        960- 1920 mg/L
                                                                                                                                                                          Community RO Plant
                                                         > 1920 mg/L

Central Ground Water Board Ministry of Water Resources (2010). Ground Water Quality in Shallow Aquifers of India.                                                                            9
International Institute for Population Sciences (IIPS) and Macro International. National Family Health Survey (NFHS-4), 2015-2016: India: Volume I. Mumbai: IIPS, 2018.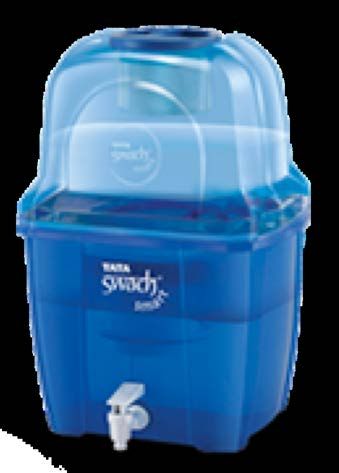
Ø Over 2000 on-grid Reverse Osmosis plants installed
Ø High pressure + low efficiency pumps + no affordable small-volume pressure
  (energy) recovery devices = lots of energy!                                10
Intermittent on-grid
         Groundwater Salinity
                                                                                    High Water Stress                           electricity, but high solar
        between 500-2000 mg/L
                                                                                                                                         resource

                                                < 480 mg/L
                                                480 - 960 mg/L
                                                960- 1920 mg/L
                                                > 1920 mg/L

             Seawater: 35,000 mg/L

Central Ground Water Board Ministry of Water Resources (2010). Ground Water Quality in Shallow Aquifers of India.
Maplecroft’s 2012 Water Stress Index                                                                                                                 11
Anthony Lopez and Billy Roberts. India solar resource - direct normal irradiance. National Renewable Energy Laboratory, 2013.
Electrodialysis Process
Voltage across Anion (AEM) and Cation (CEM) membranes drives ion flow.
Feed Water
C
+ A
- + C
- A - + C
E
- E E E E
M anion M M
+
cation
M M
Cathode Anode
- +
Diluate Concentrate Diluate Concentrate
AEM = Anion Exchange Membrane
CEM = Cation Exchange Membrane “Product” “Waste / Brine” 12GE Water Iontech
13Electrodialysis Modeling
Mass transfer by advection, diffusion, and migration Diluate Concentrate
C A C
Change in E E E
concentration Migration, due to M M M
with time electric field Migration
⎛ ⎞
dC out ⎛ 1 ⎜ ⎞ Nϕ I NAD(
a
C AEM
conc
− C )
AEM
dil
NADc (
C CEM
conc
− C CEM
dil ) ⎟
dt
dil
= ⎜⎜
⎝ NVcell ⎠⎜⎝
( in
⎟⎟ Qdil Cdil )out
− Cdil −
zF
+
la
+
lc ⎟ Diffusion
⎠
Advection, due to pumping Advection
Diffusion, due to
concentration gradient
! = #$
% = #! One Cell Pair
14Lower the voltage across successive stages to apply the optimal
voltage at any given time.
+
+
+
- - -
15Instead of flat stacks, use spirals stacks.
16Field Pilots in New Mexico, India, and Gaza
Insights on operation, maintenance, and performance
International head-to-head competition.
Evaluated on:
• Water quality 3600 mg/L to 170 mg/L
• Production rate 8250 L/day
• Recovery 84%
• Maintenance and operation
Alamogordo, NM
First Place
USAID Desal Prize
17Field Pilots in New Mexico, India, and Gaza
Insights on operation, maintenance, and performance
Jalgaon, India Chelluru, India
Complex valving and PLC, would manual
operation be feasible?
1819
Membrane treatment results in a brine stream heavily concentrated
with salts.

                                  Membrane
                High Pressure
                                   Module
                    Pump                       Clean Water

        Input Water
                                         Brine Reject

                                                                20
Chloride
Brine management would account, on average, for 63% of capital cost
      and 91% of O&M.

                                 Capital Cost                                                                         Annual O&M

          15.2 Million                                                                                 0.6 Million

                                                                           Brine Management

                                                                           Primary Treatment

                                  24.3 Million                                                                         5.2 Million

                                                                                                                                     22
                                                                                                                                     22
Minnesota Pollution Control Agency. Analyzing Alternatives for Sulfate Treatment in Municipal Wastewater. May 2018.
With current technology,
brine management
takes at least 20 times
more energy per unit
volume treated than the
primary (RO) treatment.
=$$$ + 23
23We could use evaporation ponds instead…
Evaporation Ponds at the Dead Sea
24We could use evaporation ponds instead, but… …we would need a lot of free area!!! 25
We could use evaporation ponds instead, but…

                                               26

…A LOT of football fields of pond area…
…we would need 100
football fields of pond area!!
27How can we treat waste water,
using less?
28WIND SPEED.
TEMPERATURE AND HUMIDITY.
29(1) Increase evaporation area
(2) Increase wind speed by
(3) Provide control of
introducing a fan during times of
incoming brine temperature
low wind or high humidity 30Sponsors
31Sometimes school is the worst, And your brand new desalination stack crashes into a brick wall…32
SESSION 3   • OCTOBER 1, 2020

   CLEAN ENERGY
IMPLEMENTATION AND
   DEVELOPMENT
  Women in Clean Energy Conference
                                     KRYSTAL LAYMON
                                         Supervisory Emergency
                                         Management Specialist
                                     Federal Emergency Management
                                             Agency (FEMA)
Social Impact of Clean Energy OCTOBER 1,2020
Clean Energy Professions

    Public                 Academia

     Private               Non-Profit
My Journey
Public Service
Socioeconomics:
Energy source and cost matter

•The national average energy burden for low-income
 households is 8.6%, three times higher than for
 non-low-income households which is estimated at
 3%.

•In some areas, depending on location and income,
 energy burden can be as high as 30%.

•Of all U.S. households, 44%, or about 50 million,
 are defined as low-income.

                                                     Sourece: LEAD Tool:
Persistent Barriers Limiting Solar Access
Technological Barriers
•Lack suitable roof space
•Rent home
•Live in multifamily buildings
Financial Barriers
•High up-front expense
•Lack of competitive interest rates
•Few options for those with a low credit score and/or
income below traditionally acceptable underwriting criteria
•Inability of tax-exempt businesses and certain low-income
populations to use the Investment Tax Credit
Source: US DOEStates are Expanding Low- and Moderate-
Income Access
15 states and Washington, D.C.
have a policy or program
supporting low-and-moderate
community solar capacity.
DC
Carve-out
Incentives/Grants
Multifamily housing
To be determined
Voluntary Program
Source: NRELValue of Increasing Affordability and Access to Clean Energy Decrease Energy Burden ◦ The national average energy burden for low-income households is 8.6%, three times higher than for non-low-income households which is estimated at 3%. In some areas, depending on location and income, energy burden can be as high as 30%. Reach hard to serve market ◦ It’s estimated that 59% of low-income households are renters—not owners—of their homes. This predominance of renters further compounds the issue into a split incentive. Increase Benefits ◦ Solar PV adoption by moderate-income households has increased since 2010, representing 48% of adoptions. Low-income households, however, represented just 15%
Socioeconomics:
Energy reliability and resiliency matters
•Low-income and minority
 communities are
 disproportionately impacted
 by disaster-related damage to
 critical infrastructure.
•Disadvantaged communities
 with fewer resources may not
 have the means to mitigate or
 adapt to natural disasters, and
 they disproportionately rely on
 public services, including
 community shelters, during
 disasters.

   Source: US DOE QER
   Source: NCEI 2020
Seattle                                                          Sault Ste. Tribe of
                                                                                  Chippewa Indians
               Portland
                                                                                                        Montpelier

                                                         Minneapolis                                      Boston
     Blue Lake Rancheria
     Tribal Government
                                                                 Dubuque
                                                                             Oberlin
     Sonoma County                    Salt Lake City                                    Metropolitan
        San Francisco                                                                   Washington
                                                       Mid-America                      COG
                                                       Regional
                                                       Council             Knoxville

                                                                                                            Southeast
                                                                                                            Florida
                                                                                                            Regional
10 - Cities
4 - Counties/Regional Collaborative                                                                         Climate
2 - Tribal Governments                                                                                      Compact

                                                                                                                        45
Blue Lake Rancheria’s Microgrid
Source: Blue Lake RancheriaResults and Accomplishments
Identifying resilient solutions
Solar+Storage
• Solar technology, paired with storage, allows the power system to be resilient against natural disasters. It
   provides back-up power and can support critical services during grid outages.

Microgrids
• Solar plus storage also allows for microgrid “islanding” that enables independent grid operations to provide
  power and reduce stress across the energy system. Using solar power to charge on-site energy storage offers
  facilities and homes the ability to continue to have power if the electric grid goes down.

Community Solar
• Community solar can serve multiple off-takers including households, businesses, non-profit and municipal
  sites.
Lastly….Career Advice!
“Unless you intentionally
Thank You!   include, you will
             unintentionally exclude”
SESSION 3 • OCTOBER 1, 2020
CLEAN ENERGY
IMPLEMENTATION AND
DEVELOPMENT
Women in Clean Energy Conference
MARIE MCCONNELL
Outreach and Organizing Manager
Drive Electric OhioMarie McConnell
Outreach & Organizing Manager
Clean Fuels OhioOhio’s only Department of Energy Clean Cities Coalition Fuel & Technology Neutral Fleet Services and Consulting Refueling Infrastructure Policymaker Education
Local, State,
                                & Federal
                               Policymaker
                                Education
                                                          Electric
      EV Dealer &
                                                       Utility, Co-op,
      Manufacturer
                                                        & Regulator
      Engagement
                                                       Engagement

    Fleet                                                    Infrastructure
Electrification                                              Development

                  Grassroots                    Ensuring
                  Consumer                     Equity and
                  Education                      Access
“When you were younger, you cared about the
whole world, and at some point, somebody
said you had to pick an issue, you had to boil
your love down to an issue…
’Can't love the whole world -- you've got to
work on trees or you've got to work on
immigration. You've got to shrink it down and
be about one issue.’
And really, they fundamentally told you, "Are
you going to hug a tree? Or are you going to
“The Economic hug a child? Pick. Are you going to hug a
tree? Or are you going to hug a child? Pick."
Injustice of Plastic” Well, when you start working on issues like
- Van Jones plastic, you realize the whole thing is
connected. And luckily, most of us are blessed
to have two arms -- we can hug both.92% OF TRANSPORTATION IS POWERED BY OIL
TOTAL U.S. GREENHOUSE
   GAS EMISSIONS BY
ECONOMIC SECTOR (2018)

via U.S.E.P.A.
WHY ELECTRIC VEHICLES?
PUBLIC & ENVIRONEMTNAL
HEALTH
• No burning imported oil
• Zero tailpipe emissions &
  better air quality
• Low-carbon, local energy
  sources
PUBLIC & ENVIRONEMTNAL
HEALTH
• No burning imported oil
• Zero tailpipe emissions &
  better air quality
• Low-carbon, local energy
  sources

    In the US. 75% of people
    now live in places where
     driving on electricity is
     cleaner than a 50 MPG
           gasoline car
CONVENIENT & COST EFFECTIVE • Reduced fuel, maintenance, & overall cost of ownership • Affordable options & tax incentives • Proactive vs reactive refueling
SETTING THE STAGE FOR
SMART TRANSPORTATION
& CLEAN ENERGY
• More compatible with
  autonomous/AI
  technologies
• Vehicle to Vehicle
• Vehicle to Infrastructure
• Vehicle to Grid
WHY ELECTRIC CARS?
T H A N K YO U !
                     Upcoming Sessions:

Keynote Speaker: Susan Brennan – Oct. 3, 11am-12pm ET
Navigating Post-Grad and Finding Your Vocation – Oct 3, 12-1pm ET

                 Women in Clean Energy Conference
You can also read