Global Offshore Wind Market Report 2018 - David S. Ottesen, Director Wind - NORWEP
←
→
Page content transcription
If your browser does not render page correctly, please read the page content below
Global Offshore Wind Market Report
               2018

        David S. Ottesen, Director Wind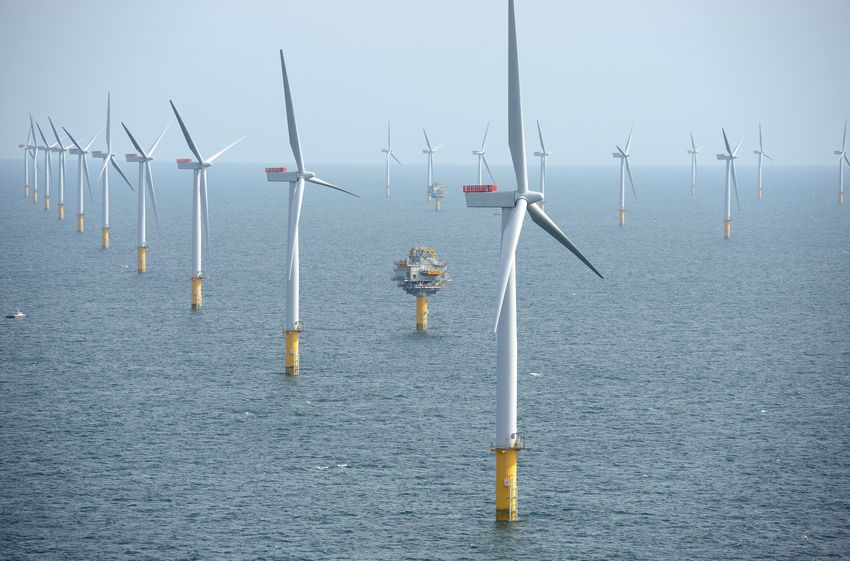
We are not giving up on oil & gas
…

              but ..

….utilising our expertise from
offshore and shipping to add
 value in the offshore wind
           industry!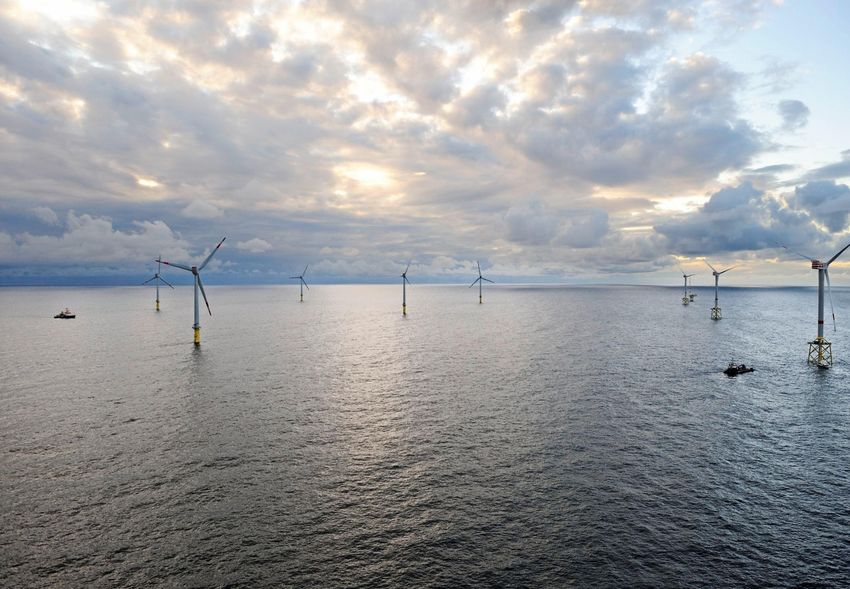
150 of ca. 250 Norwegian
Energy Partners´ partners are
interested in offshore wind
Agenda
•   Global offshore wind: a summary
•   Market forecasts
•   Expenditure and levelised cost of energy
•   Europe
•   Historical contracting and supply chain
       • UK
       • Germany
•   Asia
       • Market forecasts
       • Expenditure and levelised cost of energy
•   North America
       • Market forecasts
       • Expenditure and levelised cost of energy
•   Emerging markets
•   Priority Projects
•   Floating Wind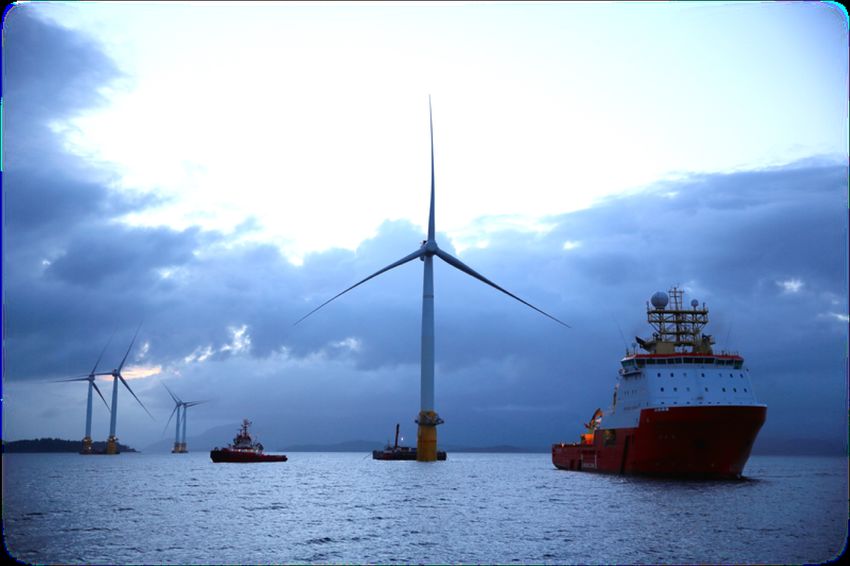
The market
Global forecast
Global Forecast to 2022
10 50
Installed capacity:
Cumulative installed capacity
Annual installed capacity (GW)
Source: BVG Associates
8 15.0% 40
Global
6 30 Installed capacity by end of 2022: 46.4GW
(GW)
Major markets: China, Germany and the UK
4 20
2 10 Europe
Installed capacity by end of 2022: 33.9GW
0 0 Major markets: Germany and the UK
'18 '19 '20 '21 '22
Europe Asia Asia
North America Cumulative Installed capacity by end of 2022: 11.3GW
Major markets: China, Japan and Taiwan
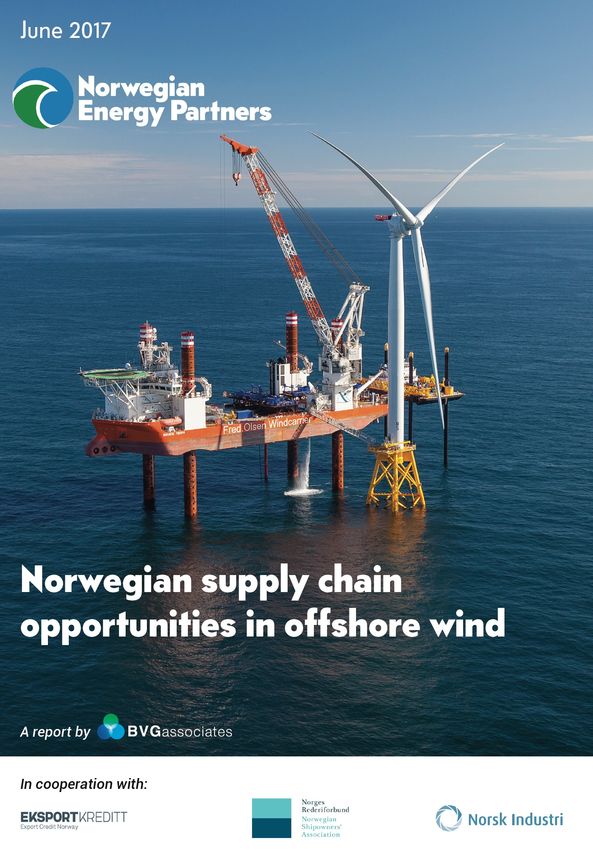
• Globally there will be almost 16GW installed capacity at
the end of 2017 North America
Installed capacity by end of 2022: 1.2GW
• Offshore wind has grown to be a multi-national Major markets: The US (east coast)
industry over a fifteen-year period.
• Nearly all offshore wind development has occurred in
Europe, with deployment starting in Asia in recent
years.
© BVG Associates 2017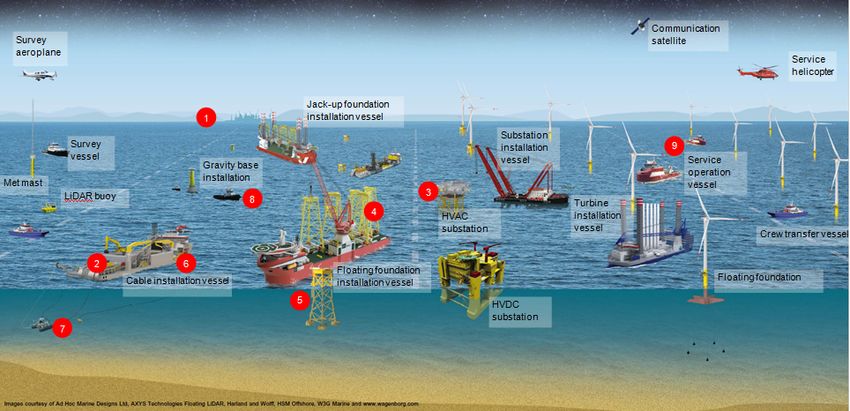
Technology, Supply Chain and Expenditure

Global Forecast to 2022

                          30,000
                                   Source: BVG Associates                                           • The rated power of turbines has increased over a 15-
                          25,000                                                                      year period, from 2MW to 8MW.
 Expenditure (€million)
                          20,000
                                                                                                    • Monopile foundations will continue to be widely used.
                          15,000                                                                      Jacket and gravity base foundations will be used in
                                                                                                      rocky soil conditions or deeper waters.
                          10,000

                           5,000                                                                    • In 2017, the first large-scale floating foundation
                                                                                                      project was installed in the UK.
                              0
                                     '18        '19         '20   '21          '22
                                                                                                    • 66kV array cables were first installed on a project in
                          Project development           Turbine
                                                                                                      2017 meaning capacity of a string can be increased
                          Foundation                    Array cable
                                                                                                      and electrical losses can be reduced.
                          Transmission                  Turbine installation
                          Foundation installation       Array cable installation                    • Higher voltage transmission will be used for larger
                          Transmission installation     OMS                                           projects further from shore, or where 'clusters' feed
                                                                                                      into central HVDC transmission systems.

             • Global annual expenditure for offshore wind in 2022 will be                          • Move towards 'third generation' jack-up installation
               approximately €25,7 billion                                                            vessels to perform lifts in higher wind speeds.

             • Expenditure between 2018 and 2022 will be about €108,3                               • SOVs and drones will become more widely used for
               billion                                                                                larger projects located further from shore.

                                                                                     © BVG Associates 2017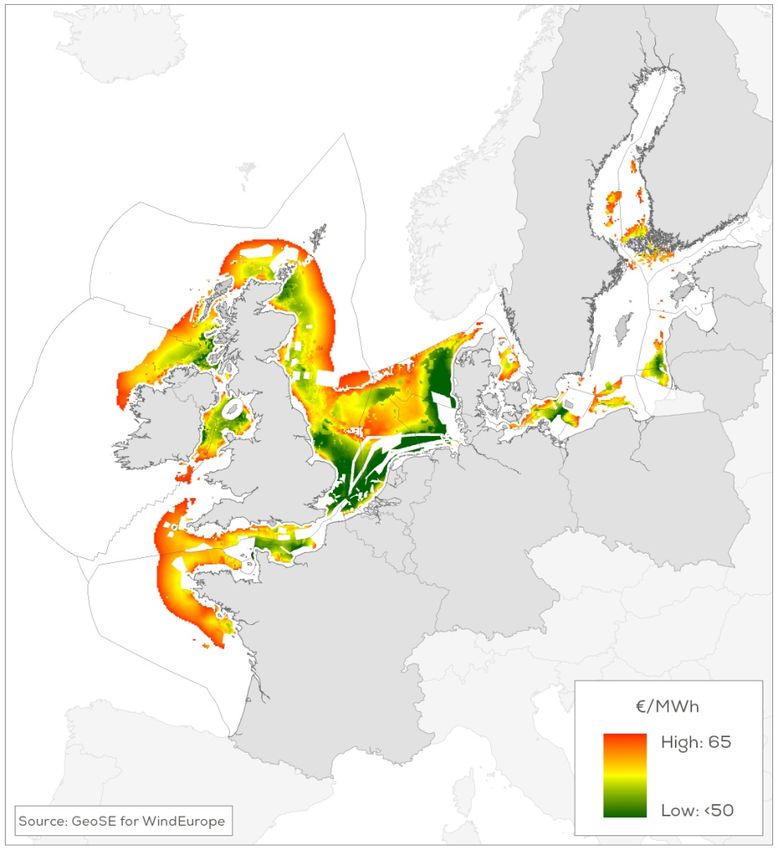
The Supply Chain
The Cost
Levelised Cost of Energy (LCOE)

XX Box header

                   180
                                                                                             Source: BVG Associates
                   160

                   140
    LCOE (€/MWh)

                   120

                   100

                   80

                   60

                   40

                   20

                    0
                         2015 2016 2017 2018 2019 2020 2021 2022 2023 2024 2025 2026 2027 2028 2029 2030

                          Offshore wind       NNG (UK)                EA1 (UK)             Horns Rev 3 (DK)
                          Borssele 1&2 (NL)   Vesterhav (DK)          Kriegers Flak (DK)   Borssele 3&4 (NL)
                          Triton Knoll (UK)   Hornsea 2 (UK)          Moray Firth (UK)

                                                      © BVG Associates 2017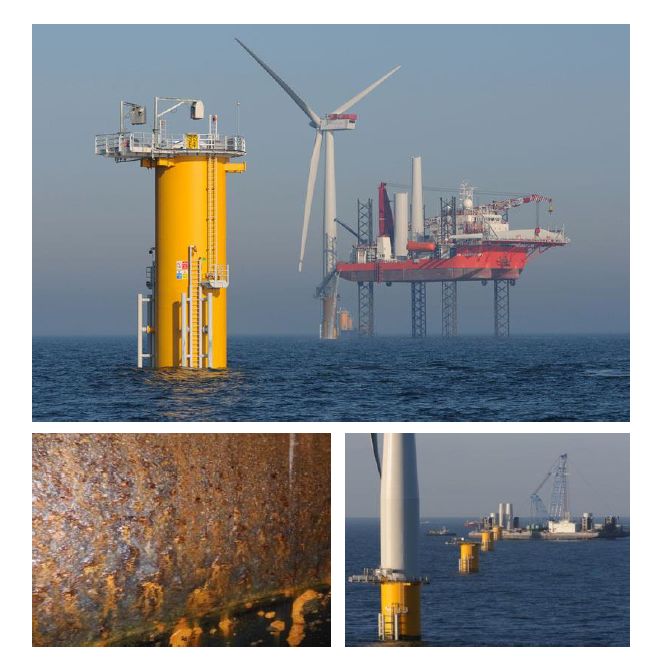
LCOE Continued
Where cost reduction has come from

                                     © BVG Associates 2017
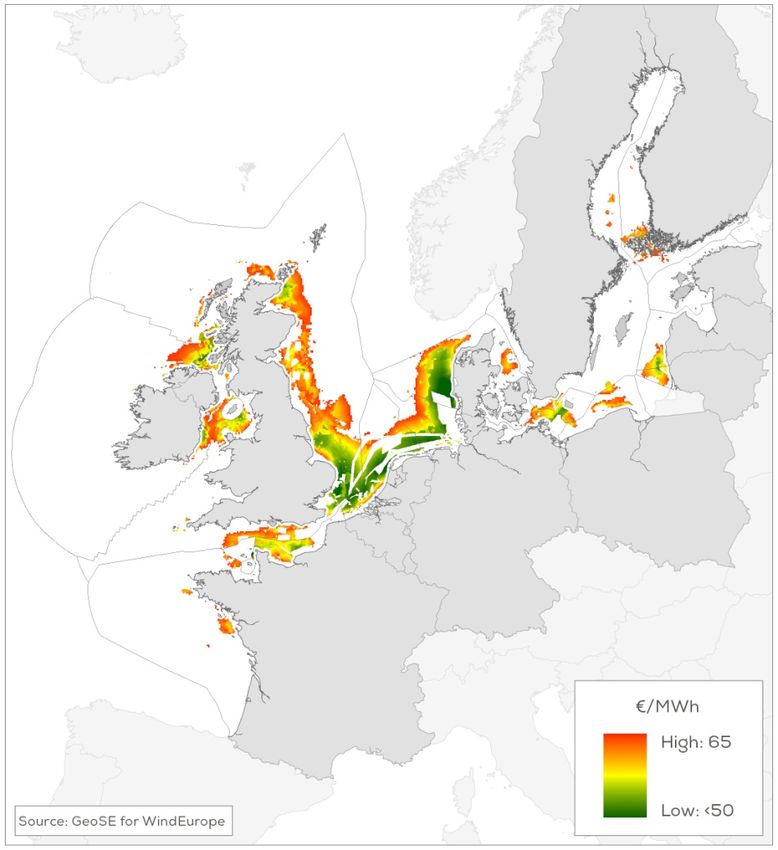
Economically attractive potential
Baseline and upside potential up to €65/MWh.

      Baseline: 2,600TWh/year (600GW)                           Upside 6,000TWh/year (1,350GW)

                                        © BVG Associates 2017
The European Market
Europe leads globally
European Forecast to 2022
5,000 50
Cumulative installed capacity
Annual installed capacity (MW)
Source: BVG Associates 4.7%
4,000 40
3,000 30
(GW)
2,000 20
1,000 10
0 0
'18 '19 '20 '21 '22
BE DK FR
DE NL UK
Other Europe Cumulative
• Europe will have almost 16GW installed capacity at
the end of 2017
• In comparison, rest of world had just under 2GW
installed at end 2017
• By end of 2022, anticipated to reach about 33.9GW
• Main markets after 2020: UK, Germany, Netherlands
and France
© BVG Associates 2017European trends
Expenditure and levelised cost of energy
• Key driver in cost of energy reductions is
competition through auction schemes.
• Increasing the size of the turbine means that there
are fewer associated components to install and
maintain, which decreases cost. Focus on LCOE is
driving the use of larger turbines (8MW to 10MW).
• European sites are relatively benign: the North Sea
is fairly shallow, wind speeds are high, super-storms
are very rare. Small waves rather than the swell
waves.
• Developers with large pipelines of operational
projects are able to implement learning from early
projects to reduce costs on later projects.
• With the use of large turbines, CAPEX potentially
increases, but operational expenditure (OPEX)
decreases
• No wind farms outside Germany will use HVDC grid
connections before 2022.
© BVG Associates 2017Procurement strategies
Multi contracting vs EPCI
Multi contracting
• Developer typically awards main contracts.
• Some packages can be split or combined depending on a developer’s needs, preferences or
capabilities.
• Multi-contracting is often preferred by large utilities, particularly if the project is funded from their
balance sheet.
© BVG Associates 2017Procurement strategies
Multi contracting vs EPCI
EPCI
• EPCI contracting usually involves three main
packages. The turbine package is typically kept
separate. The other two packages vary in scope
according to the strengths of the bidders.
• Contract values can exceed £1 billion, which is a
major risk for all but the largest and most experienced
contractors.
• The interfaces between the non-turbine packages are
not difficult for the developer to manage.
• Independent developers and less experienced
utilities prefer this approach.
© BVG Associates 2017The UK market
UK focus – the largest European market
2,000 20
Cumulative installed capacity
5.7%
Annual installed capacity (MW)
Source: BVG Associates
1,500 15
(GW)
1,000 10
500 5
0 0
'18 '19 '20 '21 '22
Year of first turbine installation
Annual Cumulative
• At the end of 2017, the UK will have around 7.0GW
of installed capacity.
• This is likely to reach 13.6GW by the end of 2022
• CAGR between 2018 and 2022 of 5.7%.
• Between 2019 and 2022, the annual installed
capacity is likely to be between 400MW and
1,700MW.
© BVG Associates 2017UK background
Regulations Capex & Opex
• The Crown Estate has leased sites for offshore wind • Expenditure across all supply chain activities in
sites in UK territorial waters and in the UK exclusive 2022 will be about €6,600 million.
economic zone. In Scotland, management was
passed to Crown Estate Scotland in April 2017. • Expenditure between 2018 and 2022 will be about
€30,000 million.
• Offshore wind projects in England and Wales are
defined as nationally significant infrastructure • Around 60% of expenditure between 2018 and 2022
projects and are examined by the Planning will be spent on DEVEX and CAPEX. Around 40%
Inspectorate. In Scotland, Marine Scotland will be spent on OPEX.
examines applications.
• The support mechanism for new projects that have Main players
not reached FID is through CfDs. CfDs last 15 years • Orsted (formerly DONG)
and are awarded through allocation rounds • Statoil
• Vattenfall
• Offshore Transmission Owners (OFTOs) are • Scottish Power Renewables
granted licences to own and operate offshore • SSE
transmission assets • INNOGY
• Siemens Gamesa
• Developers typically take up an option to build the • MHI Vestas
transmission assets and sell on within 18 months of • Seajacks
wind farm commissioning. • MPI Offshore
© BVG Associates 2017The German market
Germany focus
Annual installed capacity (MW)
1,800 12.0
Cumulative installed capacity
Source: BVG Associates
1,200 8.0
(GW)
-21.6%
600 4.0
0 0.0
'18 '19 '20 '21 '22
Year of first turbine installation
Annual Cumulative
• At the end of 2017, Germany will have around
5.4GW of installed capacity.
• This is likely to reach 9.4GW by the end of 2022.
• Between 2019 and 2022, the annual installed
capacity is likely to be between 200W and 1,200MW.
• Around 75% of capacity will be located in the North
Sea. Remaining 25% will be located in the Baltic
Sea.
© BVG Associates 2017Germany background
Regulations Capex & Opex
• The German market regulation changed with the • Expenditure across all supply chain activities in
introduction of the WindSeeG (Offshore Wind Act) 2022 will be about €3,500 million.
which became law on 1 January 2017.
• Expenditure between 2018 and 2022 will be about
• The WindSeeG introduces a centralised planning €18,000 million.
approach, which involves an Area Development
Plan and a new CfD support mechanism. • Around 60% of expenditure between 2018 and 2022
will be spent on DEVEX and CAPEX. Around 40%
• A transitional mechanism provides support to will be spent on OPEX.
projects anticipated to be commissioned between
2021 and 2025.
Main players
• Offshore grid connections are constructed, owned • Orsted (formerly DONG Energy)
and operated by transmission system operators • WPD
(TSOs) TenneT (North Sea) and 50Hertz • EnBW
Transmission (Baltic). • Northland Power
• E.ON
• Under WindSeeG, this process is incorporated into • HypoVereinsbank
the Area Development Plan which outlines the • Global Infrastructure
location and construction schedule of future • ABB
transmission assets, currently out to 2025. • Engie Fabricom
© BVG Associates 2017The Asian Market
Asian Forecast
Asian Forecast to 2022
3,000 12
Cumulative installed capacity
Annual installed capacity (MW)
Source: BVG Associates and
Renewable Energy Solutions 34.4%
2,000 8
(GW)
1,000 4
0 0
'18 '19 '20 '21 '22
CN JP TW
Other Asia Cumulative
• Asia had almost 1.7 GW installed capacity at the end
of 2016
• By end of 2022, anticipated to reach about 11.3GW
• Main markets after 2020: China, Japan and Taiwan
© BVG Associates 2017Asian trends
Expenditure and levelised cost of energy Historical contracting
• In Asia, governments are committing to decarbonise • In general, multicontracting is preferred by
their energy systems. At this early stage of market developers, to gain experience, developers tend to
growth, LCOE reduction is less of a focus than it is contract a greater number of individual contracts
in Europe.
• A significant degree of government involvement in
• The region is faced with difficult weather conditions projects is coupled with support from major local
(typhoons and sea bed earthquakes in parts of conglomerates
China and Taiwan), river delta sea bed sediments
(China), and deep water (Japan and South Korea • The contracting approach for Asian operating
market is still emerging
• China, Japan and South Korea have track-records
with wind turbine production and corresponding Main players
supply chain.
• China Three Gorges Corp.
• The balance of plant and logistics supply chains are • China Longyuan (China Guodian Group)
generally less developed than in Europe • CGN Group
• SPIC
• In general, the projects are smaller than in Europe, • China Huaneng Group
reducing the economies of scale. • CNOOC
• Goldwind
• Legislation and governmental support mechanisms • Dongfang Electric Corporation
for offshore wind are less stable • Jiangsu Hangtong Ship Heavy Industry
• Ming Yang
• ZPMC
© BVG Associates 2017The North American Market
North America
North America Forecast to 2022
1,000 157.5% 2
Cumulative installed capacity
Annual installed capacity (MW) Source: BVG Associates and
Renewable Resources International
750 1.5
(GW)
500 1
250 0.5 Report: Northeast could add 8 GW of installed offshore wind capacity by 2030
The Northeastern US could add up to 8 gigawatts of installed offshore wind capacity by 2030,
0 0 according to reports from Massachusetts, Rhode Island and New York. "Offshore wind is gaining
'18 '19 '20 '21 '22 momentum as a significant new source of renewable energy in markets across the Northeast,
and these reports demonstrate that this regional resource will create thousands of new American
US Other North America Cumulative energy jobs in the process," said Alicia Barton, president and CEO of the New York State Energy
Research Development Authority.
• North America has 30MW installed capacity at the end of
2017
• By end of 2022, anticipated to reach about 1,2 GW,
almost exclusively in the US
• Main markets after 2020: US (east coast)
© BVG Associates 2017North American trends
Expenditure and levelised cost of energy Historical contracting
• Early interest is in the US north east in the states of • Experienced European are likely to multicontract
New York, Maryland and Massachusetts with mature, global suppliers, which may collaborate
with North American to localise, transfer knowledge
• The supply chain is inexperienced and for and minimise costs.
installation, the US Jones Act means that either a
local vessel and crew must be used, or the vessel • EPCI contracting is likely to be preferred by less
operations are very restricted experienced US developers, including Deepwater
• There are also uncertainties in planned financial Wind and US Wind .
support levels and in building requirements
Main players
• In the US, early projects are generally positioned
further from shore than early projects built in • Orsted (formerly DONG Energy)
Europe, • Dominion Energy
• Massachusetts Clean Energy Centre
• Projects in development have lower total capacities • Deepwater Wind
than projects in Europe. • Statoil
• Avangrid Renewables
• Many projects built along the west coast of the US • US Wind
and Canada after 2025 will be in deep waters that • Bluewater Shipping
will require floating structures. • GE
© BVG Associates 2017Emerging markets
Rest of Europe
Estonia
Estonia has a target within its National Renewable Energy Action Plan to install up to 500MW of offshore wind
capacity by 2018, although as of yet it has no offshore wind installed capacity so reaching this target is unlikely.
Finland
There are three demonstration projects operating in Finland, with a total capacity of 32MW. In 2017, the 42MW
Tahkoluoto offshore wind farm was commissioned. The wind farm uses technology designed specifically for icy
weather conditions.
Ireland
In 2014, the Irish government published its Offshore Renewable Energy Development Plan setting targets for
offshore wind development for 2030. Following the plan, Ireland would install a minimum of 800MW of capacity,
with medium and high scenarios of 2.3GW and 4.5GW also envisioned by 2030. In June 2016, Ireland signed a
letter of intent alongside other EU nations to facilitate cost-effective deployment of offshore renewable energy,
although no binding commitments were made.
Norway
To date, Norway has 2MW of offshore wind capacity installed at the Hywind floating demonstrator project.
In 2016, the Power for Change. Energy policy by 2030 white paper written by the Standing Committee on Energy
and the Environment called for the Norwegian Government to provide a subsidy scheme for offshore wind
demonstration projects and other marine renewable energy technologies by the end of 2017.
© BVG Associates 2017Emerging markets
Rest of the world
Australia
Before 2015, the Government did not support development of an offshore wind industry. The current
Australian Government is more favourable towards an offshore wind industry and in 2015, Australia's Clean
Energy Innovation Fund was established to provide AUD $1 billion to support offshore technologies
(including offshore wind) from demonstration to commercial-scale deployment
Canada
Currently, Canada has no installed offshore wind capacity. In 2016 the government of Ontario, where the
majority of Canadian projects are planned to be located, announced it is to keep a moratorium on offshore
wind projects until potential environmental impacts are fully understood
India
In 2015, the Indian Ministry of New and Renewable Energy (MNRE) announced a National Offshore Wind
Energy Policy, allowing areas within India's exclusive economic zone (EEZ) for offshore wind farm
development.
Vietnam
Vietnam has almost 100MW of capacity installed in the Bac Lieu offshore wind farm, installed in phases
between 2013 and 2015. A further 100MW is currently under construction at the first phase of the Khai
Long project, with the potential for an additional 200MW to be development at the site
© BVG Associates 2017Floating Wind
© BVG Associates 2015Why floating?
Wind speed Water depth
© BVG Associates 2015Why floating
Project Project
development and development and
management management
2% 2%
Operations and
maintenance
Turbine
38%
26%
Turbine
33% Operations and
maintenance
38%
Installation and
commissioning
24%
Balance of plant
26%
Balance of plant
24%
Installation and
commissioning
9%
Fixed Floating (but cost of energy +20%)
© BVG Associates 2015Floating is already large market à Close to 400 MW
of Demos and 7 GW of Large Scale Projects
Current MW Current Floating Wind Farms (Announced) under Development
Installed: 20MW Demo Projects Large Scale
12 MW > 2 GW in
US
Hawaii and CA
France, 100-150 MW France, 3.5 GW with
Europe UK, 80 MW commercial tenders
Portugal, 25 MW starting to be prepared
TBD (Target 8GW by 2030,
Japan Up to 100 MW
with mostly floating)
Taiwan/Korea Up to 30 MW 1.5 GW
Source: Principle Power>300 MW of Demos and approx. 7 GW of Large Projects in Dev worldwide
5
Source: Principle PowerFloating Wind“first mover advantage”
30% Norwegian content in Hywind Scotland
- Engineering of substructure, tower and
associated systems
- Procurement services
- Substructure transport
- Assembly preparation of turbines,
substructure and generators
- Towage, anchoring and operations
- Static and dynamic cables and
accessories
- Security, verification and guarantee
compliancePriority Projects
© BVG Associates 2017Norwegian Offshore Wind Industry
45 12%
NOK/bn
40 • Norwegian Market share from 5% today to
35
10% in 2030 10%
• International revenue tripling the next ten
30
years. 8%
25 • Revenue close to 50 billion NOK in 2030
6%
20
15 4%
10
2%
5
0 0%
2015 2016 2017 2018 2019 2020 2021 2022 2023 2024 2025 2026 2027 2028 2029 2030
Total/ 10/largest/Norwegian/co´s Other Market/ ShareThe strength of the Norwegian supply industry Large complex projects Marine operations Offshore environment and material selection Offshore operation and maintenance Technology and risk assessment HSE&Q culture Experienced resources available
Offshore Wind Market information provided by
Norwegian Energy Partners

 • Priority Projects – March
 • Global Market Review – August
 • Industry Report – included
   industry overview and opportunity
   mapping– August
International Offshore Wind activities 2018
•    Scottish Renewable Offshore Wind Conference – Glasgow 29 - 31 January
•    Offshore Wind Summit 8th. March in Oslo
•    Danmark cooperation meeting – 1st. Quarter.
•    Taiwan/China Late March early April
•    FOWT – Marseille – 25-26 April
•    International Partnering Forum Princeton New Jersey – 3 – 6 April
•    Global Offshore Wind – Manchester – 19-20 June
•    Wind Energy Hamburg – 25-28 September
•    China Offshore Wind Summit 2018 - August
•    AWEA Offshore Wind – Washington 16-17 Oct
•    Offshore Energy – October - Amsterdam
Tremendous opportunities
   Limited only by our ability to exploit them!

David S. Ottesen – Director Wind
david@norwep.com
You can also read