Results presentation Results at 31 December 2020 - 18 February 2021 - Air France KLM

Page created by Mathew Goodwin
 
CONTINUE READING
Results presentation Results at 31 December 2020 - 18 February 2021 - Air France KLM
Results presentation
Results at 31 December 2020
18 February 2021
Results presentation Results at 31 December 2020 - 18 February 2021 - Air France KLM
FY 2020 highlights

             Benjamin Smith
             Chief Executive Officer
             Air France-KLM

2
Results presentation Results at 31 December 2020 - 18 February 2021 - Air France KLM
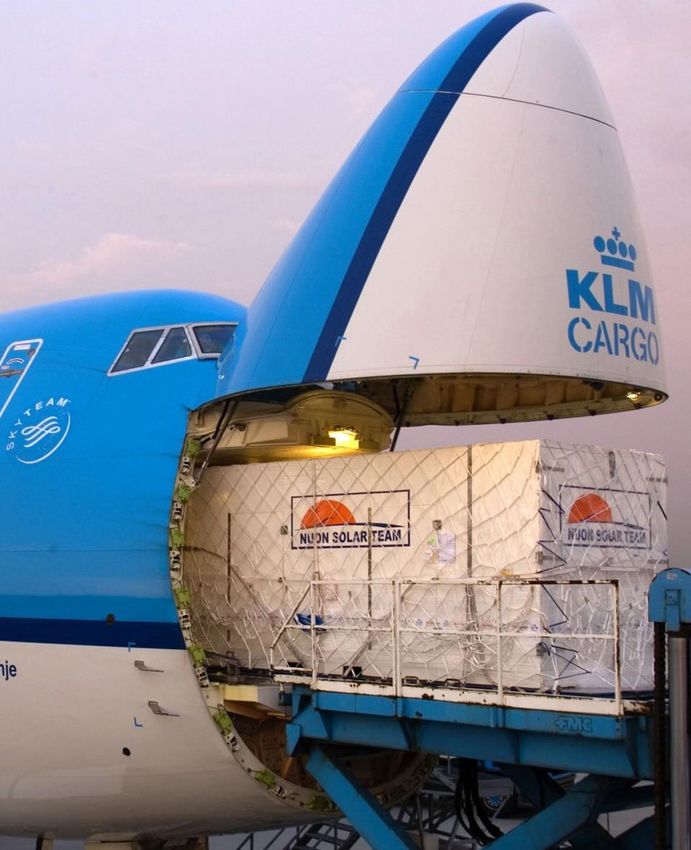
Full year 2020 highlights

         Swift operational response to an             Significant cost and productivity     Acceleration of transformation plan to
             unprecedented situation                     initiatives to adapt to crisis      build a successful post-crisis model
     Agile flight operations reorganization       Strict cost control supported by FTE   Ongoing implementation of Air France
      and opportunistic move on Cargo offer         reductions, wage support measures       and KLM restructuring plans
      to address industry under-capacity            and reduction of external expenses
                                                                                           Negotiations with the trade unions
     Implementation of high safety standards      Capex reduction and proactive           have resulted in several key
      for customers and employees: 4 stars by       working capital management,             agreements
      Skytrax                                       contributing to cash preservation
                                                                                           More than 200 projects internally
     Reactive support to national efforts with    State aid schemes contributing to       focused on operational efficiency and
      repatriation of citizens and shipping of      release cash constraints                simplification
      masks and medical equipment
                                                                                           A step up in our sustainability
                                                                                            commitments
3
Results presentation Results at 31 December 2020 - 18 February 2021 - Air France KLM
Despite strong cuts, Air France and KLM capacities remain
       above that of our competitors and industry...
          Global Industry and Airlines ASK capacity, 7-day moving average                                    Worldwide Capacity split
          (Base 100 = same level as 2019, %)                                                                 (departing ASKs)
                                                                                                                               February 2019

                                                            Competitor #1                                                                                  Europe*
                                   Air France         KLM                   Competitor #2   Industry                                               23%

                                                                                                              Other 44%
    80%                                                                                                                             765bn
                                                                                                                                                       12%
                                                                                                                                                               China

                                                                                                                                           21%
    60%
                                                                                                                                              US

                                                                                                                               February 2021
    40%
                                                                                                                                                      Europe*
                                                                                                                                               15%

                                                                                                              Other
    20%                                                                                                                 40%
                                                                                                                                    320bn                19% China

      0
    1 Oct 2020                           1 Nov 2020         1 Dec 2020        1 Jan 2021        1 Feb 2021                                26%
                                                                                                                                            US
                                                                                                             Source:
4                                                                                                            * Including Greenland, Israel, Kyrgyzstan, Kazakhstan, Tajikistan,
           Source: OAG (February 10th 2021)                                                                    Turkmenistan and Asian parts of Russia and Turkey
Results presentation Results at 31 December 2020 - 18 February 2021 - Air France KLM
... thanks to a balanced network, less reliant on North America,
    which borders have been closed for almost a year

    Long Haul ASK split per region
    (2019, %)                                                                                                     European
                                                                                                                  BA et LH fortement
                                                                                                                  competitors   highly
                                                                                                                  exposés  aux  trafics
                                                                                                                  exposed to North
                                                                                                                  Amérique and
                                                                                                                  American   Nord et
                       5%                                  6%                                                     asiatique (LH)
                                                                                                                  Asian traffic
                                                                                               11%
            12%                                     13%                                                                                        11%
                                                                         27%              6%
                              31%
                                                                                     8%                                              14%
     15%                                                                                       Competitor #1   48%
                                                                                     0%                                                        Competitor #2   46%
                                               18%
                                                                                                                                    5%

             17%                                                                          27%                                             6%
                            20%                      7%             29%
                                                                                                                                                17%

                                    North America         Asia Pacific         COI   South America             Africa             Middle East

5
    Source : Skyline
Results presentation Results at 31 December 2020 - 18 February 2021 - Air France KLM
We are accelerating on our major
AIR FRANCE-KLM INVESTOR DAY – NOVEMBER 2019

                                              transformation initiatives

                                               Reduce unit cost                                                Increase unit revenue
                                                More flexible social contracts          Air France Transavia
                                                                                                                Clarified Brand Strategy                 Air France

                                                Simplified fleet                        Air France   KLM        Optimized Interior Configurations &      Air France

                                                Next Generation Aircraft                Air France   KLM        Harmonized Products
                                                                                                                Optimized Network & Aircraft Gauge       Air France
                                                More Efficient Domestic Network         Air France
                                                                                                                Refocused Market Positioning             Air France
                                                Increased Aircraft Utilization          Air France
                                                                                                                Revised Orly Strategy                    Air France Transavia

                                                Operational Transformation              Air France
                                                                                                                Personalization & Ancillary Revenue       Group

                                                Simplified Organization & Processes     Air France
                                                                                                                Transavia Growth                         Transavia

                                                Leveraging Additional Group Synergies    Group
                                                                                                                Flying Blue & Increased Ancillary Rev.    Group

                                                                                                                E&M and Cargo                             Group

   6                                           Finalized               In Progress
Results presentation Results at 31 December 2020 - 18 February 2021 - Air France KLM
Full year 2020: Covid-19 crisis
    having an unprecedented impact
    on Air France-KLM

    • Passenger activity severely impacted, -54% capacity
                                                               Passengers carried     Group revenues
                                                                     -67%                       -59%

    • Strong cargo performance, +77% unit revenue
                                                                 104m                  €27bn
                                                                           34m
                                                                                                 €11bn

    • EBITDA loss at -€1.7bn, mitigated thanks to state        FY 2019      FY 2020   FY 2019       FY 2020

      supports on wages and cost control measures
                                                                Operating result       Net debt
    • €9.8bn cash at hand, -€2.6bn compared to Q3:                   - €5.7bn
                                                                                         + €4.9bn

      incl. -€2.1bn of adj. operating FCF in Q4                  €1.1bn
                                                                                                 11.0bn
                                                                          €-4.5bn     6.1bn

    • The Group continues to work on quasi-equity and equity   FY 2019      FY 2020
                                                                                      31 Dec 31 Dec
                                                                                       2019   2020
      solutions in order to strengthen the balance sheet and
      expects progress in the following weeks
7
Results presentation Results at 31 December 2020 - 18 February 2021 - Air France KLM
Results at 31 December 2020

             Frédéric Gagey
             Chief Financial Officer
             Air France-KLM

8
Results presentation Results at 31 December 2020 - 18 February 2021 - Air France KLM
Q4: Revenue down -€4.3bn and
     EBITDA down -€1.3bn

                                              Q4 2020   Q4 2019   Change           Change
                                                                             at constant currency

    Revenues (€ m)                             2,363     6,617    -4,254m          -4,114m
    Fuel expenses (€ m)                        506       1,393    -887m             -803m
    EBITDA (€ m)                               -407      865      -1,272m          -1,260m
    Operating result (€ m)                    -1,134      94      -1,228m          -1,215m
    Operating margin                          -48.0%     1.4%     -49.4 pt         -49.6 pt
    Net income - Group part (€ m)             -1,000     155      -1,155m

    Adjusted operating free cash flow (€ m)   -2,115     -505     -1,610m

9
Results presentation Results at 31 December 2020 - 18 February 2021 - Air France KLM
Q4: Wage cost down -49% and Christmas
     traffic supporting EBITDA, while Q4 capacity
     at Q3 levels
       Revenue index versus 2019                          Capacity in ASK

                    index 33 index 36                           38m ask 37m ask
         index 17
                                                       9m ask

        Q2 2020 Q3 2020 Q4 2020                      Q2 2020 Q3 2020 Q4 2020

        EBITDA loss improved from Q2            (1) EBITDA loss in Q4 reduced versus
                                                    guidance, mainly due to exceptional
                                                    NOW mechanism (Dutch State
                                                    support on wages to KLM) in the range
                                                    of €150m, not attributed to the period
                                          (1)
                      -€442m     -€407m             specifically

        -€780m

        Q2 2020      Q3 2020     Q4 2020
10
Q4: Traffic impacted by travel restrictions, with stronger
     demand on French domestic, the Caribbean & Indian Ocean
     during Christmas
                                                     Total                                            RASK ex cur.
                                                                                1

       Q4 2020                                               -53.3%
                                                                      -77.9%
                                                                                    -54.3%
                                                                                                      Premium
                                                                                                      -67.5%
                                                                                                                          Economy
                                                                                                                          -49.7%
                                                       ASK              RPK            RASK ex cur.

       French domestic                               Medium-haul hubs                                 Total short & medium-haul
                                                                                                                          1

                                                                        1

                                  -33.4%                                                                                           -39.4%
                                                                                    -41.1%                   -63.3%     -73.6%
               -62.5%    -68.0%                         -63.5%        -74.5%
         ASK              RPK         RASK ex cur.     ASK              RPK            RASK ex cur.     ASK                RPK          RASK ex cur.

       North America                                 Caribbean & Indian Ocean                         Asia
                                                                                                                           1
                            1
                                                                                1

            -52.0%                                           -39.3%                 -37.0%
                                  -73.4%                              -58.6%                             -61.4%                    -65.9%
                        -85.1%                                                                                        -89.4%
         ASK              RPK         RASK ex cur.     ASK              RPK            RASK ex cur.     ASK                RPK          RASK ex cur.

       Latin America                                 Africa & Middle East                             Total long-haul
                           1
                                                                                                                               1
                                                                            1

               -51.7%                                        -40.2%                 -41.4%                   -51.0%                -57.3%
                                  -61.1%                              -65.0%                                            -78.9%
                         -79.5%

         ASK              RPK         RASK ex cur.     ASK              RPK            RASK ex cur.     ASK                RPK          RASK ex cur.

11
Q4: Covid-19 severely impacting all
        businesses, Cargo continues to benefit from
        high demand and low capacity

                                                        Capacity (1)         Unit Revenue (2)              Revenues   Change   Operating   Change    Operating   Change
                                                                               Constant Curr.                (€ m)              result                margin
                                                                                                                                 (€ m)

                                                           -53.3%                -54.1%                     1,126     -78.3%

        Network                                                                                                                  -881      -917m       -44%      -45 pt
                                                                     (3)
                                                           -24.3%               +116.1%                      860      +53.9%

        Transavia                                          -67.9%                -26.1%                       85      -74.8%      -93       -66m      -109%      -101 pt

        Maintenance                                                                                          286      -44.5%     -177      -267m       -29%      -37 pt

        Group                                              -54.5%                -27.1%                     2,363     -64.3%    -1,134     -1,228m     -48%      -49 pt

     (1). Capacity is defined as           (2). Unit revenues = revenue        (3) Capacity of passenger
     Available Seat Kilometers (ASK),      per ASK, Cargo unit revenues =      aircraft used for cargo
     except for Network Cargo capacity     Cargo revenue per ATK, Group        only, is based on
     which is Available Ton Kilometers     unit revenue = (Network traffic     theoretical payload
     (ATK). Group capacity is defined as   revenues + Transavia traffic        without passengers
     Passenger ASK (Network                revenues) / (Network
     Passenger ASK + Transavia ASK)        Passenger ASK + Transavia
                                           ASK).
12
Q4: Continued good cost control on both airline,
      supported by staff reductions, states support and
      cash preservation measures
                                                       (1)                                             Cost variability increasing from 66% in Q2 to 85% in Q4
                           Group FTE evolution
                                                                                                                      with state support schemes
                                       -10%
                                                                                                                                    Q4 2020
                           85,600
                                              76,900
                                                                                               Capacity                -54%
                                                                                                                                                     Variable part of
                                                                                                                        -49%                         operating costs:
                                                                                               Labor cost
                                                                                                                            -46%                          85%
                                                                                               Total operating costs
                        December            December
                          2019                2020

                                                                                             Q4 Labor cost reduction: restructuring not fully materialized yet

                 -16% FTE in 2020                                                                State support and
                                                  0.9k FTE reduction in 2021                     exonerations
                 5.1k FTE reduction                                                                                                      20%

                 -7% FTE in 2020                                                                 Restructuring
                                                             4.9k FTE reduction in 2021-22
                 3.6k FTE reduction                                                                                                15%
                                                                                                                                               65%
                                                End 2021                  End 2022               Others mainly related to
                      End 2020
                                                                                                 decrease in activity and
                                                                                                 wages
13   (1) Average number of FTE in December including hired staff
Full year: Group financial metrics severely
     impacted by Covid-19, a decrease of €5.8bn
     in EBITDA mitigated by cost control
                                                FY 2020       FY 2019      Change           Change
                                                                                      at constant currency

     Revenues (€ bn)                             11,088        27,189      -16,100m        -15,995m
     Fuel expenses (€ bn)                         2,392         5,511      -3,119m          -3,079m
     EBITDA (€ m)                                -1,689         4,128      -5,816m          -5,814m
     Operating result (€ m)                      -4,548         1,141      -5,689m          -5,685m
     Operating margin                            -41.0%         4.2%       -45.2 pt         -45.2 pt
     Net income - Group part (€ m)               -7,078         290        -7,368m

     Adjusted operating free cash flow (€ m)     -5,661         -385       -5,276m

                                               31 Dec 2020   31 Dec 2019   Change

     Net debt (€ m)                              11,049         6,147      +4,902m

14
Full Year: Net income mostly impacted by restructuring
     cost, fleet impairment and fuel over-hedge

     FY 2020 Net income evolution
                                                                                           Restructuring cost -€822m incl.:
                                                                                           • Provision for Air France Group -€584m
                                                                                           • Provision for KLM Group -€206m
         -4 548
                                                                                           Fleet impairment -€672m incl.:
                                                                                 -7 078    • Acceleration of the Airbus 380 phase out -€553m
                                                                                           • Acceleration of the Boeing 747 phase out -€19m
                         -822
                                       -672                                                Fuel over-hedging -€595m
                                                  -595
                                                                  -441
                                                                                           Others -€441m incl.:
                                                                                           • Cost of financial debt -€477m
       Operating Restructuring    Fleet        Fuel over-        Others       Net income
                          (1)
        result       cost      impairment        hedge(1)

      (1) Cash-out during 2020                Covid-19 exceptional accounting items
          Restructuring cost: -€405m
15        Fuel over-hedge: -€589m
Full year: All businesses heavily impacted
           by Covid-19, with strong performance of
           Cargo
                                                        Capacity (1)         Unit Revenue (2)         Revenues      Change   Operating   Change    Operating   Change
          • FY 2020                                                            Constant Curr.           (€ m)                 result                margin
                                                                                                                               (€ m)

                                                           -53.9%                -32.4%                    6,638    -68.6%

     Network                                                                                                                  -3,722     -4,470m    -40.4%     -43.6 pt
                                                                     (3)
                                                           -30.7%                +76.8%                    2,568    +19.3%

     Transavia                                             -59.5%                -17.4%                     606     -65.2%     -299      -430m      -49.3%     -56.8 pt

     Maintenance                                                                                           1,248    -41.6%     -543      -803m      -19.0%     -24.6 pt

     Group                                                 -54.4%                -15.8%                    11,088   -59.2%    -4,548     -5,689m    -41.0%     -45.2 pt

     (1). Capacity is defined as           (2). Unit revenues = revenue        (3) Capacity of passenger
     Available Seat Kilometers (ASK),      per ASK, Cargo unit revenues =      aircraft used for cargo
     except for Network Cargo capacity     Cargo revenue per ATK, Group        only, is based on
     which is Available Ton Kilometers     unit revenue = (Network traffic     theoretical payload
     (ATK). Group capacity is defined as   revenues + Transavia traffic        without passengers
     Passenger ASK (Network                revenues) / (Network
     Passenger ASK + Transavia ASK)        Passenger ASK + Transavia
                                           ASK).
16
Full Year Passenger activity: Ensure health safety on board
     and adapt network to cope with border restrictions

                    Air France and KLM balanced network, an asset for the Group
                                                      -27%
                                                                                                 -46%
                           -21%                    26% 27%                      -42%
           -18%                                                                               22%           Capacity   -54%
                                                                                                                       -19%
                                          -17%                      -33%       17%                  17%
                              15%
              12%       12%                                                          13%
         8%                             6% 7%                     9% 9%

        Caribbean &     Africa &        French    Medium haul Latin America     Asia        North America   Traffic    -69%
       Indian-Ocean    Middle East     Domestic      hubs

                      Share in % of Passenger        Share in % of Passenger         Unit revenue change
                      revenue in 2019                revenue in 2020                                        Unit
                                                                                                            revenue    -32%
      Highlights:
      • Air France and KLM achieving 4 stars in “Skytrax Covid-19 Airline Safety Rating”, one of
        highest score
                                                                                                            Revenue    -69%
      • Ramping-up capacity during Summer and Christmas periods with resilient performance
        on low border restrictions routes (French Domestic and Caribbean & Indian-Ocean)
      • Most of the commercial flights incremental cash positive thanks to cargo activity
17
Full year Cargo: Strong steering unit revenue in a context
     of industry under-capacity

                                                                                                         Capacity   -31%
                                                                                                                    -19%

                                                                                                         Traffic    -19%

                                                                                                         Unit
                                                                                                         revenue    +77%

        Air France-KLM managed to increase cargo capacity to meet demand
                                                                 +11%
                                           +60%                                          Bellies incl.   Revenue    +19%
                                                                                         mini cargo
                                                    1 973m ATK            2 198m ATK
                                   1 043m ATK
                                                                                         Full
                                                                           614m ATK
                                                                                         Freighter
                                    537m ATK         557m ATK

18                               Q2 Cargo capa.   Q3 Cargo capa.        Q4 Cargo capa.
Full year Transavia: Well positioned for the
     recovery with a first step on the French
     domestic market

            • Strict cash preservation measures in place       Capacity   -60%
                                                                          -19%
            • Several CLA agreements reached in both
              Transavia NL and FR about labor conditions and
              restructuring measures                           Traffic    -68%
            • French Domestic operations started in Q4 2020

                                                               Unit
                                                               revenue    -17%

              A major opportunity for competitiveness gain     Revenue    -65%

19
Full year Maintenance: Activity severely
     impacted by the decrease of airline’s
     activities

            External revenues -42% and Operating result at -€543m
            Covid-19 generated ~€320m exceptional items:
            €120m of doubtful receivable, €110m provision on asset
            value and €90m regarding contracts review

            Highlights:
            • Order book stood at $9.1bn, -$2.4bn below last year
            • Carefully managing agreements with clients on payment terms
            • Well positioned on new generation aircraft maintenance and
              solid opportunities for the future

20
Full Year: Covid-19 impacting Air France
        and KLM
                                                                              (1)                          (1)
        FY 2020           Capacity   Revenues Change     Operating   Change         Operating   Change           Net debt Change
                           change      (€ m)    YoY       result       YoY           margin       YoY            (€ m)    31 Dec 2019

                                                           (€ m)
                          -58.7%        6,415   -61.3%    -3,389     -3,669          -52.8%     -54.5 pt            7,332    +3,392

                          -48.8%        5,120   -53.8%    -1,154     -2,007          -22.5%     -30.2 pt            3,536    +1,011

                          -54.4%       11,088   -59.2%    -4,548     -5,689          -41.0%     -45.2 pt          11,049     +4,902

     Variation of operating income between Air France and KLM partly explained by:
     • Initial size of airline
     • Higher presence of KLM on Cargo activity (Amsterdam logistical hub close to
       Rotterdam harbour)
     • Different state support schemes impact

21
Full year: Capex reduction ~50% and working capital
     management contributing to cash preservation. Refunds to
     customers from March at €2.3bn
              Only essential capex maintained,                                                                Positive change in 2020 working capital thanks to tax &
                 fleet capex fully financed                                                                   social charges deferrals and negotiations with suppliers
                                                                                                                                         +€666m

              €3,6bn

                                                                                                                              +€135m              +€165m
                                                                                                                    +€84m
                                   -€1,7bn
                                                                (1)                                              9M 2019    FY 2019    9M 2020 FY 2020
                                                        €1.9bn
                                                                       Fleet Capex
                                                       €0,8bn         (Full under financing arrangements)
                                                                                                                Q4: Working capital outflow incl €0.8bn refunds
                                                                                 (2)                                  -€63m
                                                       €0,8bn Fleet related
                                                                                                                                -€106m
                                                       €0,3bn Ground and IT
                                                                                                            €666m
           Initial Capex      Capex reduction        Capex 2020
          guidance 2020                                                                                                                    -€402m
                                                                                                                                 €497m
                                                                                                                                                     +€70m   €165m

                                                                                                            9M 2020    Trade     Trade    Advanced Others    FY 2020
      (1) Decrease of €200m capex versus Q3 guidance because of aircraft deferrals to 2021                                                           (3)
                                                                                                              WC    receivables payables ticket sales          WC
      (2) Aircraft modifications, spare parts and capitalized maintenance
22    (3) Variation of the net unflown ticket stock including refunds
Full year: Working capital and Capex well optimized,
        Net debt increase by €4.9bn
     FY2020 Free cash flow evolution                                                                   Net debt
     In € m                                                                                            In € m

                                                                                                                                                               +336              -155             11,049
                                                                                                                                             +5,661

                                                                                                         6,147
           -2,991          +165                                                                                             -940

                                                                                                      Net debt at 31   Payment of lease Adj.operating free New lease debt   Currency & other   Net debt at 31
                                          -1,895         -4,721                                         Dec 2019            debt            cash flow                                            Dec 2020

                                                                          -940           -5,661

         Cash flow   Change in             Net          Operating      Payment of   Adjusted
       before change   WCR             investments      Free Cash      lease debt operating free
          in WCR                                           Flow                     cash flow(1)

23
     (1) Adjusted operating free cash flow = Operating free cash flow after repayment of lease debt
Outlook
     Results at 31 December 2020

24
Network passenger capacity outlook: New travel restrictions
     impacting both Europe and International traffic in Q1
                                                                                                     Network Passenger capacity and booking
                                                                                                      Snapshot of the 15th February 2021 and 2019

                                                                                                                French Domestic

     Network Passenger capacity in ASK versus 2019
                                                                                                     40%               35%                35%
                                                                                               70%               69%
                                  (1)
                              40%                                                                    60%                           35%
                                                                                                                       54%                15%
                                                                                               2019 2021        2019 2021         2019 2021
                       Air France-KLM                                                            January         February          March
                           Q1 2021

                                                                                   Long Haul                                                  Medium Haul
     •   Very short term oriented bookings
     •   Progressive ramp up of capacity and
                                                                             56%
         traffic towards Summer                                                             42%               44%                       38%                              32%
                                                                       91%            90%                                       85%                 85% 27%
                                                                                                        72%
     •   Expected recovery in Q2 and Q3 thanks to                                                                                                                  60%
         vaccine deployment                                                  51%            33%              23%                        68%
                                                                                                                                                       46%              18%
                                                                       2019 2021     2019 2021          2019 2021               2019 2021        2019 2021        2019 2021
                                                                        January      February           March                  January          February          March

     (1) Expected capacity, subject to the evolution of the Covid-19                                   2021 Capacity in ASK versus 2019         Forward booking load factor 2021
     situation.
25                                                                                                     2019 Capacity in ASK base 100%           Forward booking load factor 2019
Network Cargo outlook: under capacity continues to offer
     strong steering options for Q1 2021, future performance
     pending passenger industry recovery
                                                                                 16bn Covid-19 vaccine doses needed worldwide

                                                                                        9bn doses           7bn doses

                                                                                          60k tons of air freight:
                                                                                          12% of 2019 pharma air trade industry
                                                                                          5x 2019 vaccine air trade
     •   Passenger fleet well-equipped for cargo (B777, B787, A350)
     •   Ready to transport the vaccines world wide and has already
         delivered them to several destinations successfully. The volumes will
26       gradually increase during H1 2021.
Labor cost: Restructuring programs at Air France and KLM
     will progressively compensate the decrease of state aid
     schemes
                                             Partial activity and NOW mechanisms impact decreasing in 2021
                    Labor cost reduction     Now mechanism until Q2 2021, higher activity and long-term partial activity
                                                              scheme less beneficial at Air France
                   Q4 2020 versus Q4 2019
                                                                        €1.6bn
                                                                                       -50%
                         20%
                                                                                              €0.8bn

                   15%
                                      65%                                2020                 2021

                         2021 versus 2019                             2021 labor cost > 2020 labor cost

                          15%                                                   -35%
                                                                     €8.1bn
                                       40%
                                                                                   €5.3bn

                      45%
                                                                      2019          2020             2021
27
Ongoing restructuring programs at the right speed,
       strategic plans remain valid and accelerated
         Labour cost

         Fleet, suppliers            - €750m                             -€1.2bn
        and procurement         Structural benefits by end 2021   Structural benefits by end of 2022
                                          versus 2019                     -€800m end 2021
                                                                              versus 2019
                                       -6k FTE                           -8.5k FTE
                                          by end 2021                       by end 2022,
          Fuel efficiency
                                      -5.1K FTE end 2020                 -3.6k FTE end 2020

     Other operating cost              Reduction of labor
                                      benefits (up to-20%)                  Long term partial
                                     NOW mechanism until                 activity in place for the
                                        end of Q2 2021                       next two years

28
A sufficient liquidity of almost €10bn
     cash at hand, further liquidity
     requirements foreseen in 2021
                                   (1)
     €9.82bn cash at hand                       Liquidity requirements:
         end of December
                                                •    Q1 2021 EBITDA expected below Q4 2020
            €2.46bn
             loans                              •    Negative Q1 Working Capital impact
            undrawn                                  influenced by ongoing payments and low
                                                     bookings’ inflow. Remaining risk due to cash
                                                     refunds ~€1.4bn

                                                •    FY 2021 Capex spending at €2.0bn, which is
             €7.36bn                                 30% fleet (fully financed), 50% fleet related
              cash                                   and 20% IT/ground.
             position
                                                •    FY 2021 restructuring cash out €0.5bn

     (1) Air France drew all of the €7.0bn state aid package
         KLM drew €0.9bn out of the €3.4bn state aid package
29
Air France-KLM Group medium term
     operating margin objective unchanged
     but delayed

       Guidance elements

                           • Plan expects capacity of 2019 level back in 2024, based on
                             Covid-19 crisis development (number of aircraft -7% in
                             2022 compared to 2019)

                           • Unit cost down 8 to 10% when capacity back to 2019 level

                           • Adjusted Operating Free Cash Flow positive in 2023

                           • Operating margin mid-cycle at 7-8%

30
Road to recovery requires continued adaptation of the
     Group as well as an integrated approach between all stakeholders

        WHAT WE WILL CONTINUE TO EXECUTE ON                           WHAT CAN SPEED UP RECOVERY

          Further improve the agility and swift adaptation of     Implementing highest health standards during
          our flight operations in order to seize opportunities   Covid crisis remains short-term priority

          Accelerate our transformation plan to                   Harmonization of cross-country policy is
          build a successful post crisis model                    needed to restart traveling

          Pursue strict control of our costs and Capex to         Rapid roll-out of wide-scale vaccination is key
          preserve cash and financial flexibility                 to recovery

          Step up our sustainability commitments in line          Vaccine passport would support a return of
          with our ambitious environmental roadmap                trust in safe travel

31
Q&A
     Results at 31 December 2020
32
Appendix
33   Results at 31 December 2020
Currency impact
     on operating result
                                                                              FY 2021 guidance suspended due to uncertainty Covid-19
     Currency impact                                                          crisis
     on revenues and costs
                                             -4
     In € m

        71                   56         58
                  35
                                                                              Revenues and costs per currency
                                                          -67
                                                                              FY 2020
                                                  -92
                                                                -140   -127                REVENUES                                       COSTS

             Q1 2020              Q2 2020           Q3 2020      Q4 2020                              US dollar
                                                                                                      (and related                                 US dollar
                                                                                                      currencies)
                                                                                                25                                            30
                       Currency impact on revenues
                                                                                          55
                                                                                                 20                                  70
                       Currency impact on costs, including hedging                 Euro                                     Other
                                                                                                  Other                currencies
                                                                                                  currencies         (mainly euro)
        XX             Currency impact on operating result

34
Adjusted net income
      of the Group
     FY 2020
     In € m

                                    +1,452                -27                  -290
                                                                                                    -323
                                                                                                                       -6,266

               -7,078

          Net income - Group   Non current result   Derivatives impact   Unrealized foreign   Tax impact on gross Adjusted net income
                  part                                                    exchange result       adjustments net
                                                                                                     result

35
Pension details
     at 31 December 2020

     In € m
                                              31 Dec 2019                                                                               31 Dec 2020

                                                 -1,833                                                                                    -1,935

                              Net balance sheet situation by airline                                                     Net balance sheet situation by airline

                                                                            0
                                                                                                                     -1,695                                 -241
                          -1 833

          Air-France                                                                                KLM
          France end of service benefit plan (ICS): pursuant to French regulations and the          Defined benefit schemes for Ground Staff
          company agreement, every employee receives an end of service indemnity payment on
          retirement (no mandatory funding requirement). ICS represents the main part of the Air
          France position
          Air France pension plan (CRAF): related to ground staff affiliated to the CRAF until 31
          December 1992

36
Debt reimbursement
     profile at 31 December 2020
     Debt reimbursement profile(1)
     In € m

                                                                                                                                e
                                                                                                               500

                                                                                       4 000
                                                                                                                3 000                                     300
                                                                                                                                                                   100
                                                                                                                                               650
                         300                                                                                                                   750        1 850
                                                            350
                         1 000
                                                            550                         500                    500                             600
                         2021                               2022                       2023                    2024                           2025   2026 and beyond

                                                                   Other Long-term Debt : AF and KLM     French state-aid package
         Bonds issued by Air France-KLM
                                                                   Secured Debt, mainly “Asset-backed”   Air France drew all of the €7.0bn state
         June 2021:              January 2025                                                            aid package
         AFKL 3.875% (€300m)     AFKL 1.875% (€750m)
         October 2022:           December 2026:                                                          Dutch state-aid package
         AFKL 3.75% (€350m)      AFKL 4.35% $145m (€118m)                                                KLM drew €0.9bn out of the €3.4bn
         March 2024:                                                                                     state aid package
         AFKL 0,125% (€500m, Convertible « Océane »)

      (1) Excluding operating lease debt payments and KLM perpetual debt
37
You can also read