MARKET INFO SOUTH AFRICA - PHOTOVOLTAICS - Study www.export-erneuerbare.de
←
→
Page content transcription
If your browser does not render page correctly, please read the page content below
Study
MARKET INFO SOUTH AFRICA – PHOTOVOLTAICS
dena-Market Information System
www.export-erneuerbare.de or http://exportinitiative.dena.de
IMPRINT
Publisher
Deutsche Energie-Agentur GmbH (dena) - German Energy Agency
Renewable Energies
Chausseestraße 128 a
10115 Berlin
Phone: + 49 (0)30 72 61 65-600
Fax: + 49 (0)30 72 61 65-699
Email: info@dena.de
Internet: www.dena.de

Creation/Editing
Thomas Wenzel, Felix Schmid, Niklas Hanewinkel

October 2014

All rights reserved. Use of this document shall be subject to the consent of dena.
All content has been compiled with all possible care and to the best of the compiler’s knowledge.
dena does not guarantee the topicality, correctness and completeness of the information provided.
dena shall not be liable for any material or immaterial damage caused directly or indirectly by the
use or non-use of the information presented, so long as dena cannot be charged with any demonstrably
intentional or grossly negligent fault.

Official websites
Homepage: www.export-erneuerbare.de
Online shop: http://exportinitiative.dena.de

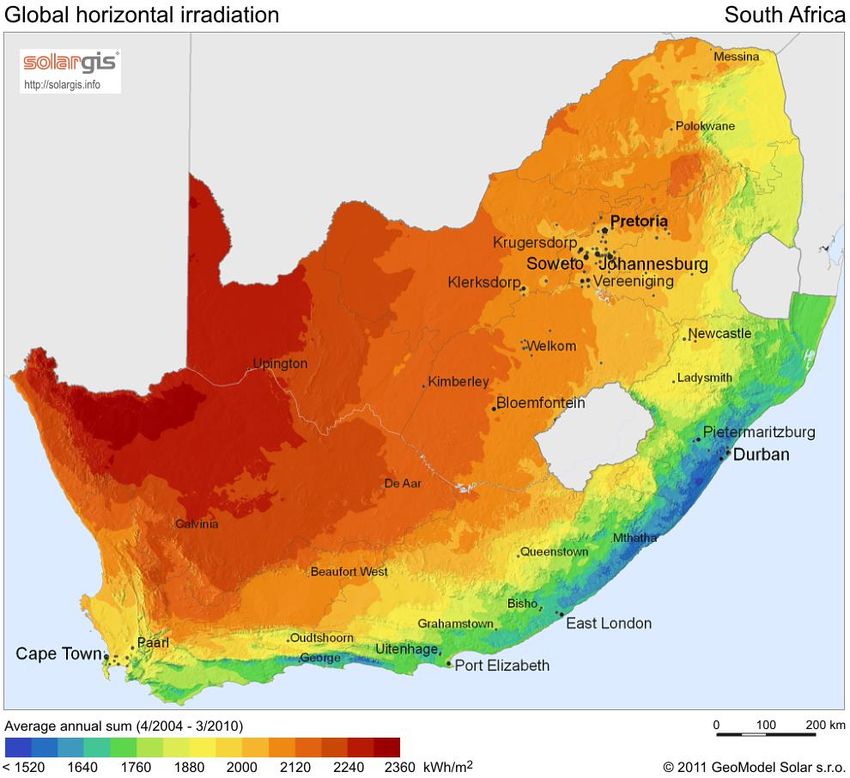
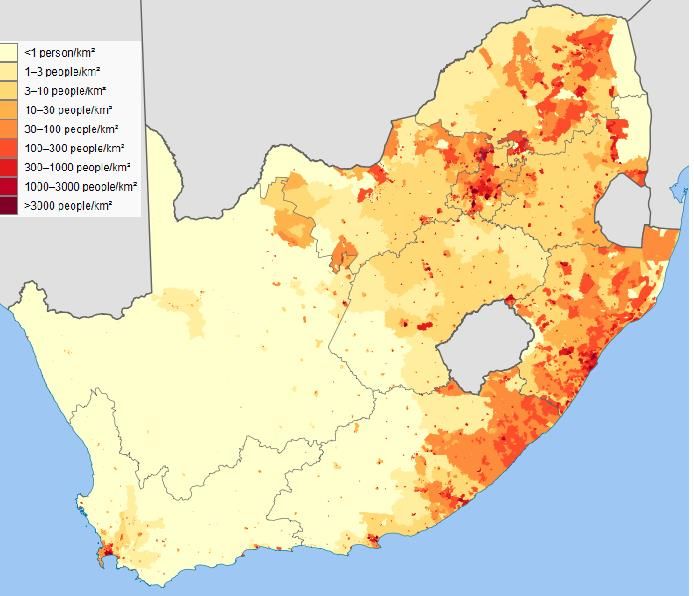
SOLAR IRRADIATION & POPULATION DENSITY

 Annual global solar irradiation   Population density

Source: dena (2012)                Source: SEDAC (2011)
                                                          3
BASIC DATA
Sources: CIA (2013), ESKOM (2013), EZB (2013), IMF (2013), STATSSA (2012), GTAI (2014)
General basic data (2014)
Area 1.22 m km² GDP (est.) 3,671.8 bn ZAR (~248.6 bn €**)
Population (est.) 53.7 m GDP per capita (est.) 68,379 ZAR (~4,629 €**)
Language English, isiZulu, Afrikaans (i. a. ) GDP growth (est.) 2.3 %
Government type Republic Inflation (est.) 6%
Administrative division 9 provinces Unemployment rate (2013) 24.9 %
Basic energy market data (2012)
Final energy consumption (2010) 1,941,940 GWh
Electricity consumption (total/per capita) 234.7 TWh / 4,830 kWh
Net electricity import 5,029 GWh
Total electricity generation 238.3 TWh
Electricity price (industrial 2013) 0.69 ZAR / kWh (~0.059 €/ kWh*)
Electricity price (residential 2013) 0.75 ZAR / kWh – 1.21 ZAR / kWh (~0.066 €/ kWh* - 0.1 €/ kWh*)
Share of renewable energy (electricity consumption) 1.6 %
Increase of electricity consumption (2012 - 2022) 4 % p. a.
Annual average solar irradiation 2,000 kWh/m²a
* Annual average exchange rate 2012 of the European Central Bank (ECB): 1 € = 11.55 ZAR
Detailed information: ESKOM Tariffs & Charges in 2014/2015 ** Average exchange rate march 2014 (GTAI): 1 € = 14.771 ZAR
4PHOTOVOLTAIC MARKET INDICATORS
Indicators
Sources: DoE (2013), EPIA (2013), dena (2013) ,REIPP (2013), EScience Associates et. al (2013)
Market size (annual 20010: 21.1 MW 2011: 23 MW 2012: 25 MW 2013: 98.25MW
installed capacity)
National PV target 2014: 1,450 MW within the Renewable Energy Independent Power Producers Program (REIPP)
Main market drivers REIPP (Independent Power Producers) Program: In sum a capacity of 3,725 MW (all eligible renewable
2013 energy technologies) is granted.
1,484 MW of solar PV have been awarded through PPAs in the first three bidding procedures. There will
be two more rounds of tendering, which will award an additional 1,041 MW until the target of 2,525 MW is
reached.
The South African “Integrated Resources Plan” sets the share of renewable resources in newly added
electricity generation capacity at 42 %.
Several provinces, e. g. Northern Cape, have a very high solar irradiation (approx. 2,300 kWh/m²a).
Support for renewable REIPP: Projects are selected depending on the offered price (70 %) and on local value creation (30 %).
projects 2012/13 During the second bidding round (March - May 2012) a massive increase of bidding prices could be
observed, especially for PV and wind capacity. The average offered price of PV project developer was 2.75
ZAR/kWh (23.8 € ct / kWh*) in the first round, which fell to 1.65 ZAR/kWh (14.2 € ct/kWh*) in the
second round.
Starting in July 2013, the 3rd bidding round within the REIPP programs (deadline August 2013) awarded
the remaining PV capacity of 401.1 MW. For the 3rd round of tendering a price of 1.2 R/kWh (10.4 €ct)
has been assumed. The main winner was Enel Green Power, which received 314 MW of PV capacity,
followed by Total’s SunPower with 86 MW.
Recent changes to the The 4th and 5th round is expected for 2014. The deadline to hand-in proposals for the 4th round was 21st
PV support regulation/ July 2014.
Support in 2014 The whole capacity of 200 MW for CSP has already been awarded.
There will be a separate tender for small-scale RE projects (up to max. 5 MW),which will is opened since
October 2013. Companies can hand-in proposals and a total of 100 MW will be allocated.
5
* Annual average exchange rate 2012 of the European Central Bank (ECB): 1 € = 11.55 ZARMAIN PV SUPPORT SCHEMES
Awarding criteria and recent bidding round
Recent bidding In the 3rd round of biddings under REIPPP 435 MW of PV have been awarded to six bidders.
rounds Financial arrangement with the six awarded bidders was not concluded – as scheduled – on 30th July 2014 . A
new date will be announced soon.
The deadline to hand-in proposals for the 4th round was 21st July 2014.
Awarding criteria Apart from economic aspects, local content regulations set by the government play an important role in which
& local content projects are chosen.
rules In connection with Black Empowerment those projects will receive a positive rating that enhance local
economic development.
Furthermore, companies with historically disadvantaged employees should be involved in PV projects –
ideally – along the whole value chain.
In addition to the lack of available capital this criteria is seen as a major barrier by bidders.
Involved Department of Energy (DoE): renewables capacity planning
Sources: REIPP (2013), DoE (2013), dena (2013)
institutions/
decision-making Department of Trade and Industry (DTI): local content, industry development
authority
National Regulator of South Africa (NERSA): approval of granted tariff within the PPAs
Electricity Supply Commission (ESKOM): State-owned utility, grid operator
Department of Environmental Affairs (DEA): environment assessment study
Communities: distribution grid operator, land use
For detailed information concerning bidding rounds see following links:
Renewable Energy IPP Program (REIPP): www.ipprenewables.co.za
South African Photovoltaic Association (SAPVIA): www.sapvia.co.za
6FURTHER PV SUPPORT SCHEME: FIT
Category Details
Eskom IDM This program has been in place since June 2012. It forms part of ESKOM’s Integrated Demand Side Management and aims
Standard Offer at reducing electricity demand. PV systems with an installed capacity between 200 kW and 5 MW are subsidised for a
Program period of three years.
The program was put on hold in October 2013 due to significant financial constrains experienced by ESKOM.
In October 2014, Eskom has launched a smaller and more restricted tariff scheme.
Applicability Applicants have to be clients of the governmental electricity provider Eskom.
The systems have to fulfill the following requirements:
Systems need to have a meter on the consumer site.
Systems have to be in line with latest technological standards.
None-grid connected systems have to replace a connection, meaning they generate
electricity, which otherwise would have been supplied by the grid.
Remuneration The FIT is 1.20 ZAR (ca. 8.55 € ct*) per kWh.
Sources: dena (2014), ESKOM (2014)
*Exchange rate from 14/10/2014: 100 ZAR = 7.12 €
7FURTHER PV SUPPORT SCHEMES
Programme Information
Integrated Resource The IRP defines a 42 % share of renewable resources for newly added power generation capacity.
Plan (IRP) Planned installation of approx. 17 GW capacity until 2030: 8 GWp PV, 1 GW of concentrated solar power
2010 - 2030 plants, 8 GW of wind power
The updated version of the IRP was published in December 2013. The target for installed PV capacity was
increased from 1.33 GW to 9.33 GW.
Sources: Climate Investment Funds (2012), ESKOM (2012a),. EEP Africa (2012)
Solar-roof-program At the moment, DoE and ESKOM are developing a Solar-roof-program, with the target to install PV
systems on 300,000 South African roofs.
Clean-Technology CTF is co-financing projects for renewable electricity generation and for increasing energy efficiency with a
Fund (CTF) total amount of 500 m US Dollars.
(World Bank) With these projects a further sum of one bn US Dollars from bi- and multilateral lenders and private
investors should be capitalised.
Energy and The EEP is supported by the donor countries Finland, Austria and United Kingdom for renewable energy
Environment and energy efficiency projects.
Partnership Technology: Every renewable technology can receive a project specific support.
Programme The call for proposals will be released on the following website: http://www.eepafrica.org/
Southern and East
Africa (EEP)
SAGEN (South African Technical cooperation with the German governmental development institution GIZ in the area of
German Energy renewable energy technologies.
Programme) Support of solar energy through the facilitation of knowledge transfer.
Support of energy efficiency.
8MARKET DEVELOPMENT AND BARRIERS
Development of installed PV capacity Main barriers in the South African PV market
Energy policy barriers:
Enormous coal resources (which are the main source for
electricity generation in the country) result in little interest and
possibilities for on-grid renewable electricity generation.
Lack of financing through local banks:
Little experience in financing renewable energy projects hinder
local banks to issue loans. This caused massive delays in project
development within the first bidding round.
Local content rules:
Barriers for project development are time consuming bidding
processes and the requirements within the local content rules.
Sources: EPIA (2012 / 2013), SESSA (2012a)
Interconnection fees:
Costs for interconnection (which are expensive in South Africa)
and possibly needed power lines must be paid by the project
owner.
Pricing pressure:
During the first two bidding rounds a rapid decrease of bidding
prices could be observed. In future more and more pressure on
prices is expected.
Sources: EScience Associates et. al (2013), GIZ (2013) 9
9MARKET NEWS (1/2)
Date Topic Source
South Africa Power Price to Rise 13% to Offset Eskom Costs
South African power prices will rise more than first planned from April to help the state-owned utility
recover 7.8 billion rand ($693 million) of unbudgeted costs, the regulator said.
03/10/2014
Electricity tariffs will increase by an average 13 percent, more than the 8 percent initially approved for the Bloomberg
year through 31st March 2016, the Pretoria-based National Energy Regulator of South Africa said in an e-
mailed statement today.
Blackouts Present Biggest Risk to South Africa’s Economy
South Africa has an electric bill coming due that’s threatening everything from its swimming pools to its
sovereign debt. Consumers are asked almost daily to switch off their water heaters, pool pumps and
25/09/2014 Bloomberg
anything else that will save power during peak periods. Industrial customers are also asked to conserve
energy, even if it means reducing production. And when that’s not enough, Eskom Holdings SOC Ltd.
orders managed blackouts.
JinkoSolar opens PV module factory with an annual production capacity of 120MW in South Africa
Located in Cape Town, the factory covers an area of 5,000m2 and has annual production capacity of 120 SolarServer
11/08/2014 MW. JinkoSolar invested a total of approximately USD 7.5 million in the factory which is expected to
create 250 jobs. First foreign solar manufacturer’s PV module factory in South Africa modeled after
Chinese standard.
South Africa Faces Higher Power Fee as Eskom Claim Approved
South Africa’s energy regulator said Eskom Holdings SOC Ltd.’s costs exceeded projections in the three
years through 2013, possibly enabling bigger power-price increases in April.
The company that provides 95 percent of South Africa’s electricity didn’t recover 7.8 billion rand ($735
30/07/2014 Bloomberg
million) of spending incurred from 2010 to 2013, the Pretoria-based regulator said in an e-mailed
statement today. Eskom in August asked that it be allowed to get back 18.4 billion rand. Nersa, which last
year said the utility can raise fees by an average of 8 percent in each of the five years through March 2018,
did not say by how much more tariffs will increase.
10MARKET NEWS (2/2)
Date Topic Source
Lease finance initiative for rooftop PV www.esi-africa.com
Powerway PV SA and InnoVent, with the support of TÜV Rheinland, have developed a model where the
consumer is paying a lower price for power generated from solar PV compared to conventionally
13/03/2014
generated electricity without a capital outlay being required by the consumer. The under the leasing
model installed modules will be produced in the joint venture production facility from Powerway PV SA
and JA Solar. The implementation date is not yet know.
Hopes for a CIGS boom in South Africa PV-Magazine
The South African PTiP together with the German Singulus commissioned a CIGS production facility.
05/02/2014
This modern production and research facility will be able to manufacture and further develop CIGS
modules with a seize of 1200 mm x 600 mm.
Solar energy to undercut coal in South Africa PV-Tech
According to a study of the South Africa Photovoltaic Industry Association (SAPVIA) the price for solar
17/10/2013 power could decline to 0.74-1.26 R/kWh (6.4-10.9 € ct/kWh) by 2020 and thus become the cheapest
power in South Africa. Already by 2018 solar power could reach the price level of coal, which could go
up to 1.69 R/kWh (14.6 € ct/kWh) by 2020.
11CONTACT INFORMATION
Category Name Website
National Ministry of
Department of Energy (DoE) www.energy.gov.za/
Energy
www.nersa.org.za
National Market Regulator National Energy Regulator of South Africa (NERSA)
www.eskom.co.za
State-owned Utility Eskom Holdings Limited (ESKOM)
German-South-African
Deutsche Industrie- und Handelskammer für das südliche Afrika (AHK) www.suedafrika.ahk.de
Chamber of Commerce
Photovoltaic Industry
South African Photovoltaic Industry Association (SAPVIA) www.sapvia.co.za
Association
Renewable Energy
South African Renewable Energy Council (SAREC) -
Association
National Partner for
www.sarenewablesinitiat
Project Financing and South African Renewables Initiative (SARI), Department of Trade and Industry
ive.wordpress.com
Development
Source: dena (2012)
12REFERENCES
CIA, Central Intelligence Agency : The World Fact Book. https://www.cia.gov/library/publications/the-world-factbook/geos/sf.html,
accessed on 09.04.2013.
Climate Investment Funds (2012): https://www.climateinvestmentfunds.org/cif/node/2, accessed on 30.05.2012.
Deutsche Energie-Agentur GmbH (dena) (2014): dena-Förderübersicht Photovoltaik 2014, Berlin.
Deutsche Gesellschaft für Internationale Zusammenarbeit (GIZ) (2013): GIZ in South Africa: Programmes and Projects,
http://www.giz.de/de/downloads/giz2013-en-giz-programmes-projects-south-africa.pdf, accessed on 14.01.2014.
DoE, Department of Energy: IPP-Procurement Programme 2013. http://www.ipprenewables.co.za/#/page/post/view/id/168, accessed on
23.05.2013.
Energy and Environment Partnership Program Southern and East Africa (EEP): http://www.eepafrica.org/, accessed on 10.09.2012.
EPIA, European Photovoltaic Industry Association (2012): Global Market Outlook For Photovoltaics until 2016, EPIA, Brussels.
EPIA, European Photovoltaic Industry Association (2013): Global Market Outlook For Photovoltaics 2013 – 2017, EPIA, Brussels.
EScience Associates et. al (2013): The localisation potential of photovoltaics (pv) and a strategy to support large scale roll-out in South Africa,
http://www.sapvia.co.za/../PV-Localisation_Draft-Final-Report-v1.2.pdf, accessed on 03.02.2014.
ESKOM (2014): Standard Offer Program, http://www.eskom.co.za/sites/idm/Industrial/Pages/SOP.aspx, accessed on 28.04.2014.
ESKOM, Transmission Development Plan (2013): http://www.eskom.co.za/content/TransDevPlanBrochure2013-2022.pdf, accessed on
22.04.2013.
ESKOM, Electricity Tariff Report (2013a): http://www.financialresults.co.za/2012/eskom_ar2012/integrated-report/electricity-tariff-
report.php, accessed on 15.04.2013.
ESKOM, Eskom Tariffs and Charges 2014/2015 (2014):
http://www.eskom.co.za/CustomerCare/TariffsAndCharges/Documents/TariffBrochureV9.pdf, accessed on 28.10.2014.
EZB, Europäische Zentralbank (2013), http://www.ecb.int/stats/exchange/eurofxref/html/index.en.html, accessed on 10.04.2013.
GTAI (2014): Wirtschaftsdaten kompakt: Südafrika:
http://www.gtai.de/GTAI/Content/DE/Trade/Fachdaten/MKT/2008/06/mkt20080612133204_159400.pdf, accessed on 27.10.2014.
IMF, International Monetary Fund (2013):
http://www.imf.org/external/pubs/ft/weo/2013/01/weodata/weorept.aspx?sy=2011&ey=2018&scsm=1&ssd=1&sort=country&ds=.&br=1&p
r1.x=11&pr1.y=9&c=199&s=GGR_NGDP%2CGGX_NGDP&grp=0&a=, accessed on 22.04.2013.
STATSSA, Statistics South Africa (2012): http://www.statssa.gov.za/, accessed on 10.04.2013.
ESKOM, Small renwable energy programme (2012a): http://www.eskomidm.co.za/industrial/sop, accessed on 10.09.2012.
13REFERENCES
REIPP Programme (2013), http:// www.ipp-nenewables.co.za, accessed on 07.11.2013.
SEDAC, Socioeconomic Data and Applications Center (Columbia University): Gridded Population of the World. South Africa.
http://sedac.ciesin.columbia.edu/, accessed on 15.08.2012.
SolarGis (2011): http://solargis.info/doc/_pics/freemaps/1000px/ghi/SolarGIS-Solar-map-South-Africa-en.png, accessed on 14.01.2014.
14You can also read