WP/18/22 A New Smartphone for Every Fifth Person on Earth: Quantifying the New Tech Cycle - IMF
←
→
Page content transcription
If your browser does not render page correctly, please read the page content below
WP/18/22

    A New Smartphone for Every Fifth Person on Earth:
                    Quantifying the New Tech Cycle

                           by Benjamin Carton, Joannes Mongardini, and Yiqun Li

IMF Working Papers describe research in progress by the author(s) and are published
to elicit comments and to encourage debate. The views expressed in IMF Working Papers
are those of the author(s) and do not necessarily represent the views of the IMF, its
Executive Board, or IMF management.
2

© 2018 International Monetary Fund                                                               WP/18/22

                                        IMF Working Paper

                                         Research Department

    A New Smartphone for Every Fifth Person on Earth: Quantifying the New Tech Cycle

             Prepared by Benjamin Carton, Joannes Mongardini, and Yiqun Li *

                          Authorized for distribution by Douglas Laxton

                                             January 2018

    IMF Working Papers describe research in progress by the author(s) and are published to
    elicit comments and to encourage debate. The views expressed in IMF Working Papers are
    those of the author(s) and do not necessarily represent the views of the IMF, its Executive Board,
    or IMF management.

                                                Abstract

The enormous global demand for smartphones in recent years has created a new global
tech cycle. In 2016 alone, global smartphone sales reached close to 1.5 billion, one for
every fifth person on earth. In turn, this has engendered complex and evolving supply
chains across Asia. We show that the new tech cycle cannot be captured by standard
seasonality, but depends on smartphone product release dates. Decomposing cycle from
trend, we also show that the sale of smartphones may have peaked in late 2015. Asia,
however, continues to gain in importance as the global tech manufacturer.

JEL Classification Numbers: F6; F14; L63

Keywords: global supply chains; global trade; tech cycle

Author’s E-Mail Address: bcarton@imf.org; jmongardini@imf.org; yli2@imf.org

*
 The authors are grateful to Tamin Bayoumi, Balazs Csonto, Rupa Duttagupta, Minsuk Kim, Douglas Laxton,
Koshy Mathai, Gian Maria Milesi-Ferretti and Anne Oeking for useful comments, and to Cristina Quintos for
excellent assistance.
3

                                                               CONTENTS

Abstract ......................................................................................................................................2

I. Introduction ............................................................................................................................4

II. The New Tech Cycle .............................................................................................................5
              The Pre-Release Cycle .......................................................................................8
              The Post-Release Cycle .....................................................................................9

III. Decomposing Trend From Cycle .......................................................................................12

IV. Conclusions........................................................................................................................16

Tables
1. Apple Inc. and Samsung Electronics Smartphone Release Dates .......................................18
2. Regression results for China Smartphone Exports ..............................................................19
3. Regression Results for South Korea Semiconductor Exports .............................................20
4. Regression results for Taiwan Province of China Electronic Export Orders ......................21

Figures
1. Global Sales of PCs and Smartphones ...................................................................................4
2. The New Tech Cycle: Apple and Samsung Phone Releases, China Smartphone Exports,
   South Korea Semiconductor Exports, and Taiwan Province of China Electronic Export
   Orders ....................................................................................................................................6
3. Global iPhone Sales ...............................................................................................................7
4. Electronics Component Exports ............................................................................................8
5. Geography of Pre-Release Cycle .........................................................................................10
6. Geography of Post-Release Cycle .......................................................................................11
7. China: Smartphone Export Cycle ........................................................................................13
8. South Korea: Semiconductor Export Cycle .........................................................................14
9. Intel and Samsung: Sales of Semiconductor Chips .............................................................14
10. Taiwan Province of China: Electronic Export Orders Cycle .............................................15

Appendixes
I. Apple Inc. and Samsung Electronics Smartphone Release Dates ........................................18
II. Regression Results ..............................................................................................................19
III. Data Sources ......................................................................................................................22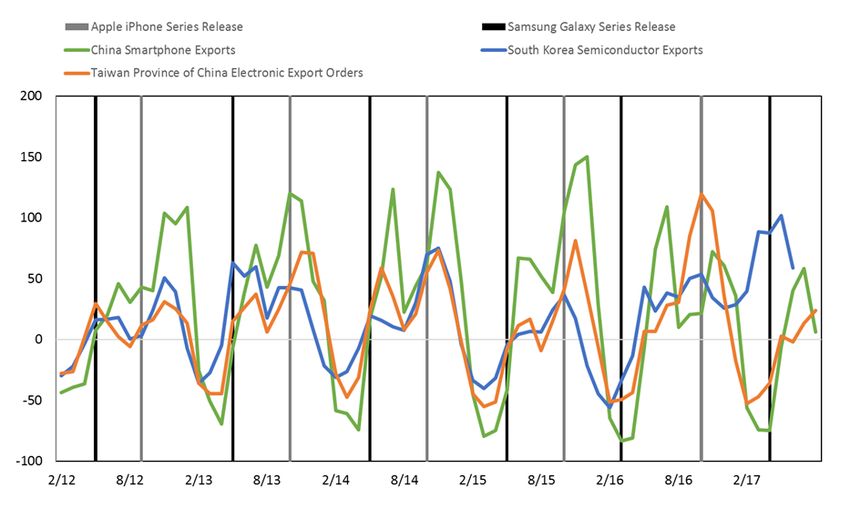
4

                                      I. INTRODUCTION

The huge increase in the demand for global smartphones since 2011 has created a new global
tech cycle. Demand has been driven by the increasing use of smartphones as the main
computing platform across the world. It is highly cyclical as it centers around the release date
of new smartphone models by global producers, including Apple Inc. and Samsung
Electronics. It has also engendered highly complex and evolving supply chains across Asia.
Thus, production and trade in several Asian countries have become highly correlated and
intertwined with the new tech cycle.

The new tech cycle can be defined as the production and export of electronics and software
associated with the release of new smartphones by global producers. This definition differs
from the traditional tech cycle prior to 2012, where it referred to the production and exports
of personal computers (PCs) and related components. In those days, the tech cycle was not as
pronounced and less centered around release dates for PCs. Since 2012, global sales of PCs
have declined, while sales of smartphones have skyrocketed. In 2016 alone, global
smartphone sales reached close to 1.5 billion units, equivalent to one for every fifth person
on earth (Figure 1).

                     Figure 1. Global Sales of PCs and Smartphones
                                            (Millions of Units)

           1600
                      PCs    Smartphones
           1400

           1200

           1000

            800

            600

            400

            200

              0
                   2009     2010     2011       2012        2013   2014   2015   2016
            Sources: Gartner, IDC.

The importance of the new tech cycle cannot be underestimated. In 2016, exports of
electronic components for smartphone production at the peak of the cycle accounted for more
than one third of total exports in Taiwan Province of China, 15 percent in Singapore and
South Korea, and 11 percent in Malaysia. In addition, in the same year, China exported $107
billion worth of smartphones to the rest of the world, equivalent to 5 percent of its total
exports. Data on value added of the new tech cycle is not readily available. However, OECD
data on value added in GDP of the computer, electronic, and optical (CEO) sectors are
5
indicative of the magnitudes involved. 1 In South Korea, the CEO sectors accounted for 7.4
percent of total value added in 2013. In Japan and Ireland, the same ratio was 2.1 percent and
2.0 percent in 2012, respectively. Data for other Asian countries are not readily available.
These ratios are likely though to have increased substantially in the last few years, thanks to
the new tech cycle.
In this paper, we show that the new tech cycle cannot be captured by standard seasonality.
Instead, it critically depends on the release dates for new smartphones by global producers.
The cycle can be subdivided into two components. The first one is the pre-release cycle,
which comprises the exports of all components from several Asian countries to China, which
is de facto the final producer of most smartphones. The second is the post-release cycle, with
shipments of smartphones from China to the rest of the world. Both pre- and post-release
cycles have a very strong impact on growth and trade patterns in Asia.
We also show that the new tech cycle may have peaked in late 2015. By decomposing cycle
from trend, we show that the trend is non-linear and reached its peak in September 2015,
suggesting that the global market for smartphones may have become saturated. However,
Asia continues to gain market share in other consumer electronics, including embedded
automobile computers, smart appliances, and wearable devices. This is evident in the rising
demand for South Korean semiconductors and, to a lesser extent, in Taiwan Province of
China electronic export orders.
The paper is organized as follows. Section II provides a summary description of the tech
cycle since 2012. The decomposition between cycle and trend is then discussed in Section
III. Section IV provides some concluding remarks. Appendix I, II, and III present the Apple
Inc. and Samsung Electronics release dates, the main regression results, and related data
sources, respectively.
II. THE NEW TECH CYCLE
The new tech cycle has gained in importance as a key determinant of economic performance
of several Asian countries since 2012. The global shift from PCs to smartphones (and tablets
to a lesser extent) has led to the development of complex and evolving supply chains across
Asia to provide electronic components necessary for final assembly of smartphones in China.
Several Asian countries have been the main beneficiaries of these new supply chains, leading
to increasingly strong correlations in export and growth performance around the release dates
of these products.
An intuitive way to present the new tech cycle is to chart the growth rates of exports of
several countries involved in the supply chain across Asia. Figure 2 shows the main release
dates for Apple and Samsung smartphones (the grey and black vertical lines), and the three-
1
OECD (2015), Figure 2.4.6
month moving average of monthly growth rates of Chinese smartphone exports, South Korea
semiconductor exports, and Taiwan Province of China export orders. 2 The figure clearly
demonstrates three things. First, it gives a visual depiction of the correlation of component
exports from South Korea and Taiwan Province of China, and Chinese exports of
smartphones. This holds true also as well for related electronic components from Malaysia,
Singapore, and, to a lesser extent, Thailand. Second, the pickup in growth rates is
concentrated around the release dates for Apple and, to a lesser extent, Samsung
smartphones. Third, the high growth rates—up to 150 percent for Chinese smartphone
exports—show that the tech cycle has a large cyclical impact on export and growth
performance in Asia.
Figure 2. The New Tech Cycle: Apple and Samsung Phone Releases,
China Smartphone Exports, South Korea Semiconductor Exports,
and Taiwan Province of China Electronic Export Orders
(Percentage change, 3-month moving average-on-3-month moving average annualized, not seasonally adjusted)
Sources: KITA; Ministry of Economic Affairs, Taiwan Province of China; and TDM Data.
At this stage, the reader may ask why the tech cycle is not captured by seasonal adjustment
methods. The reason is threefold. First, the recent nature of the new tech cycle (only six years
so far) makes it hard to capture the cycle with standard seasonal adjustment as the latter
would require a significantly longer time series to be statistically meaningful. Second, supply
chains associated with smartphones have evolved and become more complex over time,
which implies that several countries have experienced a higher impact of the new tech cycle
in the last few years. Third, and more importantly, we will show below that the tech cycle
2
We are indebted to Seok Gil Park (2017) for this chart and a useful introduction to the tech cycle.7
critically depends on smartphone release dates, which can vary during the calendar year and
can have a differential impact on production and exports depending on the success of global
smartphone sales. This is likely to have been particularly relevant in the fourth quarter of
2017, when Apple Inc. released the iPhone 8/8 Plus in October and the iPhone X a month
later (Appendix I).
To further elaborate on this point, it is worth looking specifically at the number of global
Apple iPhone sales over the last five years (Figure 3). Reflecting a booming global demand,
sales surged from 35.1 million units in the first quarter of 2012 to 78.3 million in the fourth
quarter of 2016. While a clear quarterly pattern seems to be emerging, where the second and
third quarter sales are usually weaker reflecting the expectations of another release in the
fourth quarter, the amplitude of this quarterly pattern has only really been established since
the release of the iPhone 6/6 Plus in September 2014. Moreover, there are clear spillovers
from the fourth quarter of the previous year onto the first quarter of the following year.
Figure 3. Global iPhone Sales
(Millions of units Sold Each Quarter)
90
78.3
80 74.5 74.8
70
61.2
60
51.0 51.2 50.8
50
47.8 47.5 48.0 45.5 46.7
43.7
39.3 40.4 41.0
40 35.1 37.4
33.8 35.2
31.2
30 26.0 26.9
20
10
0
Q1 Q2 Q3 Q4 Q1 Q2 Q3 Q4 Q1 Q2 Q3 Q4 Q1 Q2 Q3 Q4 Q1 Q2 Q3 Q4 Q1 Q2 Q3
2012 2013 2014 2015 2016 2017
Source: Apple Inc. quarterly financial statements (quarters shown are calendar and not fiscal year).
The large global demand for smartphones has a significant macroeconomic impact on several
countries in Asia. At peak, the new tech cycle accounts for over one third of total exports in
Taiwan Province of China, 15 percent in Singapore and South Korea, 11 percent in Malaysia
and 8 percent in China (Figure 4). The significance of the new tech cycle has also grown over
time as supply chains have become more complex and cover a larger number of countries
across Asia. In the third quarter of 2017, for example, the new tech cycle was a major
contributor to exports and growth in Malaysia, Singapore, South Korea and Taiwan Province
of China. It is also likely to have a significant impact on growth performance in China in the
fourth quarter of 2017.8
Figure 4. Electronics Component Exports
(Percent of total monthly exports)
Singapore (IC) Malaysia (IC) South Korea (Semiconductor) China (Mobile Phone) Taiwan Province of China (IC)
40
Taiwan Province of
35 China peak: Sep 2016 35.1
30
25
South Korea
20 peak: Aug 2017
China peaks: Oct Singapore peak: 15.3
15.0
15 2015 & Oct 2016 July 2017
11.0
10
Malaysia peak:
7.9 7.9 Jun 2017
5
0
1/15 4/15 7/15 10/15 1/16 4/16 7/16 10/16 1/17 4/17 7/17
Sources: TDM Data and Haver Analytics.
The Pre-Release Cycle
Smartphone releases are predated by a significant ramp up of electronics component exports.
This pre-release cycle is characterized by large shipments from several Asian countries to
China, where final manufacturing and assembly of most smartphones takes place. This
includes shipments of memory chips (DRAM and flash memory), mainly from South Korea
and Vietnam; system chips (CPUs and app processors) and multichip packages (MCPs) from
Japan, Malaysia, Singapore, South Korea and Taiwan Province of China; and displays from
Japan and South Korea. For the operating system, the software for Samsung smartphones, the
Google Android operating system, is open source from the US and thus free of charge. The
operating system for iPhones comes from Ireland, where Apple Inc.’s intellectual property is
currently located. 3
3
Per US Senate Permanent Subcommittee on Investigations (2013), Apple Inc. holds its intellectual property in
a subsidiary in Ireland to take advantage of very low corporate income taxes there. At the same time, the same
subsidiary has a manufacturing service agreement with the Chinese electronics manufacturer to produce
iPhones. As such, global iPhone sales are recorded as Irish exports in line with the geographical location of the
Apple’s intellectual property, while the iPhone manufacturing is recorded as a manufacturing service import
from China in the Irish balance of payments.9
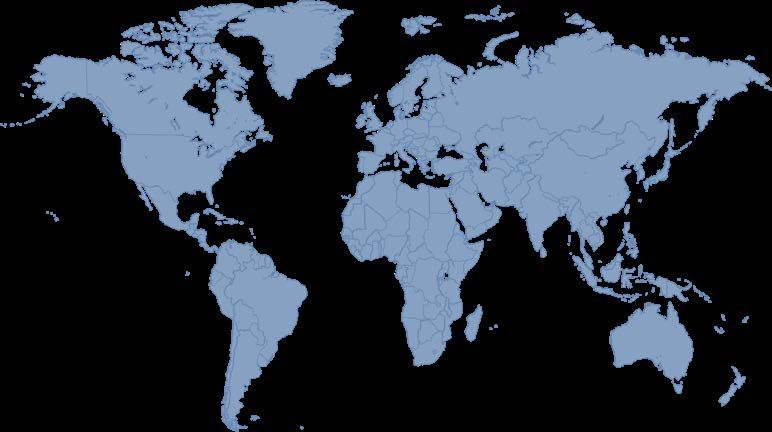
The supply chain has evolved over the last few years and become more complex. Figure 5
presents the geography of the pre-release cycle across Asia in 2016. It shows that the main
contributors to this complex supply chain were Japan, Malaysia, Singapore, South Korea, and
Taiwan Province of China. Newcomers to the supply chain are the Philippines, Thailand, and
Vietnam, with growing shares of component exports in the tech cycles. The supply chain is
likely to have evolved and become even more complex in 2017. Press reports indicate that
Apple Inc. signed a contract with Samsung Electronics in April 2017 for the shipment of 70
million OLED screens for the iPhone X. 4 This contract is likely to boost Samsung exports
further, particularly in the second half of 2017 and into 2018.
Overall, the pre-release cycle accounted for USD68.2 billion of imports of electronics
components to China in 2016, equivalent to about 4.3 percent of total Chinese merchandise
imports. The effect on gross trade flows across Asia is large, while the impact on net value
added for China is small. Manufacturing and shipments of smartphones only create an
estimated USD20 billion of value added in mainland China, equivalent to 0.2 percent of 2016
GDP. So, while the tech cycle has a significant impact on growth and trade for the smaller
countries in Asia, it has a relatively small growth effect in China.
The Post-Release Cycle
The post-release cycle is global in nature (Figure 6). China is the de facto the final
manufacturer for most smartphones. Shipments originate from China to regional distribution
centers around the world and from there to consumers. In 2016, Chinese exports of
smartphones amounted to USD106.9 billion (5.1 percent of total exports). The main
destinations of smartphone shipments were the United States (28.0 percent), Europe
(22.7 percent), South East Asia and India (15.4 percent), South Korea (7.6 percent) and Japan
(7.1 percent). The large shipments to South Korea reflect the distribution of a portion of
Samsung smartphones from there to the rest of the world.
It is worth noting that the pre- and post-release cycles do intertwine in the sense that, after a
smartphone release, production continues to require significant electronics component
through the Asian supply chain while China already is shipping the finished smartphones to
the rest of the world. As such, both pre- and post-release cycles overlap, which adds to the
interesting dynamics of the new tech cycle.
4
Nikkei Asian Review (2017).Figure 5. Geography of Pre-Release Cycle
(Annual exports of Integrated Circuits, Value and Percentage of Total Component Exports, 2016)
.
10
Sources: KITA; Ministry of Economic Affairs, Taiwan Province of China; TDM Data; and UN Comtrade Database.Figure 6. Geography of Post-Release Cycle
China: Exports of Smartphones
(Value and Share of Total Smartphone Annual Exports, 2016)
Russia & CIS
USD3.0 Billion
2.8%
Europe
USD24.3 Billion South Korea
22.7% USD8.0 Billion
US & Canada
7.5%
USD29.9 Billion
28.0% Japan
MENA USD7.6 Billion
USD7.1 Billion 7.1%
11
6.6%
South East Asia & India
Latin America
USD16.4 Billion
USD6.3 Billion Sub-Sahara 15.4%
5.9% USD2.2 Billion
2.1%
Australia and New Zealand
USD1.9 Billion
1.8%
Source: TDM Data.12
III. DECOMPOSING TREND FROM CYCLE
In the previous section, we argued that the new tech cycle has a strong seasonal pattern
around the release dates of major smartphones. In this section, we test this hypothesis by
decomposing trend from cycle econometrically, based on the data shown in Figure 2. The
main result is that shipments of smartphones seems to have peaked in late 2015, suggesting
that the global market for smartphones may have saturated.
Major releases of Samsung smartphones are usually in the second quarter, while Apple
iPhones are generally in the third or fourth quarter of each year. For iPhones, global sales in
the fourth quarter have accounted for an average 35 percent of total annual sales. Part of the
reason for this concentration relates to sales associated with the Christmas holidays.
However, the strength of global sales usually spills over to the first quarter of the following
year—albeit at a more subdued pace—until the Chinese New Year.
We use a standard methodology to decompose trend from cycle. We use monthly dummies
before and after the release dates to capture the cycle, while time and the square of time
(time2) are used to capture a potentially non-linear trend. We also include a dummy to
capture the 15 days of the Chinese New Year, when most factories in China are closed
including the major smartphone manufacturers. Given that the Chinese New Year follows the
lunar calendar, the holiday period shifts by roughly 11 days each year in the Gregorian
calendar. To capture this shift, the dummy is equal to the number of vacation days for the
Chinese New Year in each month.
The econometric results for exports of Chinese smartphones show that the cycle is mainly
determined by the release dates of iPhones, while the trend is non-linear with a peak in
September 2015 (Figure 7 and Table 2 in Appendix II). 5 The coefficients on one month
before the release date and up to four months after are statistically significant. The fitted
value is shown in the blue line below. The coefficients on the trend variables (time and time2)
are both statistically significant, with a negative coefficient on time2, suggesting that global
sales of smartphones may have peaked (orange line in Figure 7). However, these results are
partly driven by the lack of data for the second half of 2017, which may overstate the amount
of the recent downturn in the trend. The coefficient on the Chinese New Year dummy is
negative and highly significant as expected, given the shutdown of smartphone
manufacturing during these holidays (red line in Figure 7). Overall, the decomposition
between cycle and trend explains about 92 percent of Chinese smartphone exports (green line
in Figure 7).
5
Samsung smartphone release dates were not statistically significant, which may partly reflect the fact that they
are not associated with the holiday season in the fourth quarter of each year.13
Figure 7. China: Smartphone Export Cycle
(Millions of Units Exported Per Month)
160
iPhone Release
Tech Cycle Estimated Trend
Dates
(Vertical Lines)
140
120
100
80
60
Smartphone Chinese New
Exports Year Effect
40
Sep
Sep
Sep
Sep
Sep
Sep
Jan
Jul
Jan
Jul
Jan
Jul
Jan
Jul
Jan
Jul
Jan
Jul
Mar
May
Mar
May
Mar
May
Mar
May
Mar
May
Mar
May
Nov
Nov
Nov
Nov
Nov
Nov
2011 2012 2013 2014 2015 2016 2017
Sources: TDM Data, Haver, and authors’ regression results.
Using the same methodology, we find a rather different story for South Korean
semiconductor exports. The coefficients on the dummies up to one month ahead of the
release date and one month after the release date are significant, suggesting that production
rumps up just before the release date (blue line in Figure 8 and Table 3 in Appendix II). In
addition, while not statistically significant, the trend terms (time and time2) are both positive,
which may be an indication that demand for South Korean semiconductors continued to rise
during 2011-17, despite the possible saturation in the global smartphone market (orange line
in Figure 8). This is consistent with the fact that Samsung Electronics has overtaken Intel
Corporation as the largest semiconductor producer in the world in the second quarter of 2017
(Figure 9). Finally, the Chinese New Year dummy is negative and statistically significant as
expected (red line in Figure 8). The regression explains about two thirds of the variation in
South Korea’s semiconductor exports (green line in Figure 8).14
Figure 8. South Korea: Semiconductor Export Cycle
(Millions of Units Exported Per Month)
160
Tech Cycle Estimated Trend
140
120
100
80
60 Chinese New
Year Effect
Semiconductor
Exports
40
Jul
Jul
Jul
Jul
Jul
Jul
Nov
Jan
Nov
Jan
Nov
Jan
Nov
Jan
Nov
Jan
Nov
Jan
Sep
Mar
May
Sep
Mar
May
Sep
Mar
May
Sep
Mar
May
Sep
Mar
May
Sep
Mar
May
2011 2012 2013 2014 2015 2016 2017
Sources: TDM Data, Haver, and authors’ regression results.
Figure 9. Intel and Samsung: Sales of Semiconductor Chips
(Billions of USD)
18
Intel Samsung Electronics
16
14
12
10
8
6
2012Q1 2012Q3 2013Q1 2013Q3 2014Q1 2014Q3 2015Q1 2015Q3 2016Q1 2016Q3 2017Q1
Sources: Intel and Samsung Electronics Quarterly Financial Statements.15
Finally, the same methodology for Taiwan Province of China electronics export orders
produces similar results, although the data are in value terms (volume data are not available)
The release month and subsequent three months are statistically significant in explaining the
cycle (blue line in Figure 10). These results suggest that Taiwan Province of China
electronics export orders are contemporaneous with the smartphone export cycle in China,
pointing to a very short lead-time component production. Moreover, the time coefficients
(time and time2), while borderline statistically significant, show that export orders may be in
the process of peaking. This, however, may reflect the lack of data for the second half of
2017. Finally, the dummy on the Chinese New Year effect is negative and statistically
significant as expected. Overall, the regression explains about 80 percent of the variation in
Taiwan Province of China’s electronic export orders.
Figure 10. Taiwan Province of China: Electronic Export Orders Cycle
(Millions of USD, monthly export orders)
12000
iPhone Release Tech Cycle Estimated Trend
Dates
(Vertical Lines)
11000
10000
9000
8000
7000
Chinese New
Electronic Export
Year Effect
Orders
6000
Mar
May
Mar
May
Mar
May
Mar
May
Mar
May
Mar
May
Jul
Jul
Jul
Jul
Jul
Jul
Jan
Jan
Jan
Jan
Jan
Jan
Sep
Nov
Sep
Nov
Sep
Nov
Sep
Nov
Sep
Nov
Sep
Nov
2011 2012 2013 2014 2015 2016 2017
Sources: Ministry of Economic Affairs, Taiwan Province of China; and authors’ regression results.
These three decompositions of the new tech cycle provide an interesting insight into the
dynamics of supply chains for smartphones. The regressions clearly show that iPhone release
dates have driven the tech cycle in the last five years, both in terms of Chinese smartphone
exports, South Korean semiconductor exports, and Taiwan Province of China export orders.
While there is a clear indication from the China exports decomposition that the global
demand for smartphones may have peaked in late 2015, the global demand for South Korean
semiconductors seems to be on an upward trend, suggesting that other electronic products are
driving the acceleration (e.g., automobile computers, smart appliances, and wearable
devices). In line with these results, the underlying trend in Taiwan Province of China
electronic export orders remains strong, albeit at a more moderate rate in the first half of
2017.16
IV. CONCLUSIONS
The new tech cycle is an important new feature of the global economy. Over the last six
years, the enormous global demand for smartphones has changed the export and growth
performance of several Asian countries through complex and evolving supply chains that
involve several countries in the region.
In the paper, we show that the release date of iPhone products has a significant impact on
related electronics exports of three major Asian countries, namely China, South Korea, and
Taiwan Province of China. In addition, the decomposition of trend from cycle shows that the
global smartphone market may have saturated in late 2015. However, the demand for other
electronics products continues to boost production of semiconductors, particularly in South
Korea. Thus, Asia continues to gain in importance as the global tech manufacturer.17
References
Apple, Inc., Quarterly Financial Statements, 2012–17, available at http://investor.apple.com/
Nikkei Asian Review, 2017, “Apple Has Ordered 70m Units of OLED Panels: Sources,”
April 4, 2017.
OECD (2015), “OECD Digital Economy Outlook 2015”, OECD Publishing, Paris, available
at http://www.oecd.org/internet/oecd-digital-economy-outlook-2015-9789264232440-
en.htm
Park, Seok Gil (2017), “Anatomy of Korean Semicon: Signals for Regional Tech Cycle,
JP Morgan Global Data Watch, pp. 22–5, August 11, 2017.
Samsung Electronics, Quarterly Financial Statements, 2012–17, available at
http://www.samsung.com/global/ir/
U.S. Senate Permanent Subcommittee on Investigations, 2013, “Offshore Profit Shifting and
the U.S. Tax Code – Part 2,(Apple Inc.),” May 21, 2013, p. 192, available at:
https://www.hsgac.senate.gov/subcommittees/investigations/hearings/offshore-profit-
shifting-and-the-us-tax-code_-part-218
Appendix I. Apple Inc. and Samsung Electronics Smartphone Release Dates
Table 1. Apple Inc. and Samsung Electronics Smartphone Release Dates
Release Date Smartphone Model
2012 May Samsung Galaxy S3
2012 Sep Apple iPhone 5
2013 Apr Samsung Galaxy S4
2013 Sep Apple iPhone 5s
2014 Apr Samsung Galaxy S5
2014 Sep Apple iPhone 6/6 Plus
2015 Apr Samsung Galaxy S6/Galaxy S6 Edge
2015 Sep Apple iPhone 6s/6s Plus
2016 Feb Samsung Galaxy S7/Galaxy S7 Edge
2016 Sep Apple iPhone 7/7 Plus
2017 Mar Samsung Galaxy S8/Galaxy S8+
2017 Oct Apple iPhone 8/8 Plus
2017 Nov Apple X
Source: Apple, Inc. and Samsung Electronics.19
Appendix II. Regression Results
Table 2. Regression Results for China Smartphone Exports
Dependent Variable: Volume of China Smartphone Exports (in log)
Coefficient Std. Error t P>|t|
Explanatory Variables:
Months before/after phone release:
M-3 0.02238 0.029 0.77 0.45
M-2 0.03710 0.029 1.27 0.21
M-1 0.05686 0.032 1.80 0.01
M 0.15978 0.032 5.10 0.00
M+1 0.17295 0.032 5.50 0.00
M+2 0.29625 0.031 9.41 0.00
M+3 0.24075 0.029 8.36 0.00
M+4 0.14691 0.029 5.16 0.00
Other variables:
Constant -70.04554 9.640 -7.27 0.00
Time 0.26577 0.029 9.06 0.00
Time2 -0.0002 -0.000 -8.94 0.00
Chinese New Year dummy* -0.03106 0.002 -13.96 0.00
Statistics:
R-squared 0.922
Adjusted R-squared 0.907
F-statistic 60.35
Durbin-Waston d-statistic 2.434
Source: Authors’ estimation.
*This dummy takes the value of the number of Chinese New Year holidays in a month.20
Table 3. Regression Results for South Korea Semiconductor Exports
Dependent Variable: Volume of South Korea Semiconductor Exports (in log)
Coefficient Std. Error t P>|t|
Explanatory Variables:
Months before/after phone release:
M-3 0.11220 0.060 1.86 0.07
M-2 0.03441 0.060 0.57 0.57
M-1 0.16054 0.602 2.67 0.01
M 0.16968 0.060 2.82 0.01
M+1 0.12721 0.060 2.12 0.04
M+2 0.06735 0.060 1.12 0.27
M+3 -0.03859 0.055 -0.70 0.49
M+4 -0.13387 0.055 -2.45 0.02
Other variables:
Constant 40.34612 19.815 2.04 0.62
Time -0.07255 0.060 -1.20 0.24
Time2 0.00006 0.000 1.29 0.20
Chinese New Year dummy* -0.01446 0.004 -3.41 0.00
Statistics:
R-squared 0.673
Adjusted R-squared 0.606
F-statistic 10.09
Durbin-Waston d-statistic 1.038
Source: Authors’ estimation.
*This dummy takes the value of the number of Chinese New Year holidays in a month.21
Table 4. Regression Results for Taiwan Province of China
Electronic Export Orders
Dependent Variable: Value of Taiwan Province of China Electronic Export Orders (in log)
Coefficient Std. Error T P>|t|
Explanatory Variables:
Months before/after phone release:
M-3 -0.01319 0.025 -0.52 0.61
M-2 0.01082 0.025 0.42 0.67
M-1 0.01387 0.027 0.50 0.62
M 0.11080 0.027 4.03 0.00
M+1 0.12798 0.027 4.66 0.00
M+2 0.13684 0.027 4.98 0.00
M+3 0.09003 0.025 3.59 0.00
M+4 0.02103 0.025 0.84 0.40
Other variables:
Constant -6.52886 8.403 -0.78 0.44
Month 0.04467 0.026 1.75 0.09
Month2 0.00003 0.000 -1.63 0.11
Chinese New Year dummy* -0.01427 0.014 -7.36 0.00
Statistics:
R-squared 0.809
Adjusted R-squared 0.771
F-statistic 21.54
Durbin-Waston d-statistic 1.158
Source: Authors’ estimation.
*This dummy takes the value of the number of Chinese New Year holidays in a month.22
Appendix III. Data Sources
Variables Source
Global Sales of PCs and Smartphones Gartner/IDC
Global iPhone Sales Apple Inc.
China Total Merchandise Exports Haver Analytics
South Korea Total Merchandise Exports Haver Analytics
Taiwan Province of China Total Merchandise
Haver Analytics
Exports
Singapore Total Merchandise Exports Haver Analytics
Malaysia Total Merchandise Exports Haver Analytics
Singapore IC Exports UN Comtrade Database
Malaysia IC Exports UN Comtrade Database
Thailand IC Exports UN Comtrade Database
Philippines IC Exports UN Comtrade Database
Volume of China Smartphone Exports TDM Data (Trade Data Monitor)
Volume of South Korea Semiconductor Exports TDM Data (Trade Data Monitor)/KITA
Value of South Korea Semiconductor Exports TDM Data (Trade Data Monitor)/KITA
Value of Taiwan Province of China Electronic Ministry of Economic Affairs, Taiwan Province
Export Orders of ChinaYou can also read