Schaeffler AG 2017 Global Auto Industry Conference - January 10, 2017 Detroit
←
→
Page content transcription
If your browser does not render page correctly, please read the page content below

Schaeffler AG
2017 Global Auto Industry Conference

              January 10, 2017
                  Detroit
Disclaimer

    This presentation contains forward-looking statements. The words "anticipate", "assume", "believe", "estimate", "expect", "intend", "may", "plan",
    "project“, "should" and similar expressions are used to identify forward-looking statements. Forward-looking statements are statements that are not
    historical facts; they include statements about Schaeffler Group's beliefs and expectations and the assumptions underlying them. These statements are
    based on plans, estimates and projections as they are currently available to the management of Schaeffler AG. Forward-looking statements therefore speak
    only as of the date they are made, and Schaeffler Group undertakes no obligation to update any of them in light of new information or future events.
    By their very nature, forward-looking statements involve risks and uncertainties. These statements are based on Schaeffler AG management's current
    expectations and are subject to a number of factors and uncertainties that could cause actual results to differ materially from those described in the
    forward-looking statements. Actual results may differ from those set forth in the forward-looking statements as a result of various factors (including, but
    not limited to, future global economic conditions, changed market conditions affecting the automotive industry, intense competition in the markets in
    which we operate and costs of compliance with applicable laws, regulations and standards, diverse political, legal, economic and other conditions affecting
    our markets, and other factors beyond our control).
    This presentation is intended to provide a general overview of Schaeffler Group’s business and does not purport to deal with all aspects and details
    regarding Schaeffler Group. Accordingly, neither Schaeffler Group nor any of its directors, officers, employees or advisers nor any other person makes any
    representation
    or warranty, express or implied, as to, and accordingly no reliance should be placed on, the accuracy or completeness of the information contained in the
    presentation or of the views given or implied. Neither Schaeffler Group nor any of its directors, officers, employees or advisors nor any other person shall
    have any liability whatsoever for any errors or omissions or any loss howsoever arising, directly or indirectly, from any use of this information or its contents
    or otherwise arising in connection therewith.
    The material contained in this presentation reflects current legislation and the business and financial affairs of Schaeffler Group which are subject to
    change.

2            January 10, 2017                                 2017 Global Auto Industry Conference | © Schaeffler 2017
Schaeffler Executive Team – Introducing Matthias Zink and Marc McGrath

                            u Matthias Zink (47) joined the Executive Board on January 1, 2017
                            u Co-CEO Automotive Schaeffler Group succeeding Norbert Indlekofer
                            u 22 years with Schaeffler
                            u Execute the mobility for tomorrow strategy with a focus on future powertrains to support
                              E-Mobility

                             u Marc McGrath (50) joined Schaeffler Americas in 1988
                             u Head of Automotive Americas since January 1, 2016
                             u 29 years with Schaeffler
                             u Pivoting resources to strengthen regional E-Mobility and mechatronics development for future
                               mobility

3      January 10, 2017                     2017 Global Auto Industry Conference | © Schaeffler 2017
Agenda

1   Schaeffler at a glance

2   Strategy "Mobility for tomorrow"

3   Investment Highlights

4   Summary

4        January 10, 2017              2017 Global Auto Industry Conference | © Schaeffler 2017

1 Schaeffler at a glance
Schaeffler AG – A leading automotive and industrial supplier

    Schaeffler at a glance                                                                                               Sales growth 2012-2016 (in EUR bn)
                                                                                                                                                                                 13,2
                                                                                                                                                                      12,1
                                                                                                                                    10,7            11,1    11,2
    u   Leading automotive and industrial supplier of high-precision components and
        systems
    u   Global footprint with around 85,000 employees at about 170 locations in more than
        50 countries
    u   Balanced business portfolio across sectors, geographies
        and diversified customer base with leading market positions
    u   Sizeable aftermarket exposure contributes to stable financial performance                                                  2011             2012    2013     2014        2015         2016
    u   Highly attractive profitability and cash returns                                                               Growth      +12.6%           +4.0%   +0.7%     +8.2%      +8.7%
                                                                                                                       rates

    Sales by division and region (9M 2016) (in %)                                                                        Global footprint
                                                                                                                                                                    #Plants             #R&D Centers
                                     24,4                                      22,0
                                                                                                                           Europe                                       48                           9
                                                                            14,4               53,3
                                                                                                                           Americas                                     14                           5
                        75,6                                                    10,3
                                                                                                                           Greater China                                     8                       1
                Industrial            Automotive               Europe     Asia/Pacific   Greater China   Americas          Asia / Pacific                                    5                       2
                                                                                                                           Total                                        75                       17
    EUROPE: Incl. Germany, Western, Southern and Eastern Europe, Middle East, Africa, Russia and India

5                January 10, 2017                                                        2017 Global Auto Industry Conference | © Schaeffler 2017
2 Strategy "Mobility for tomorrow"
Strategy "Mobility for tomorrow" – 4 key elements

    Vision / Mission                                                         4 Focus areas

     8 Strategic pillars                                                     16 Strategic initiatives

6           January 10, 2017              2017 Global Auto Industry Conference | © Schaeffler 2017
2 Strategy "Mobility for tomorrow"
Financial Ambitions for 2020 – Sustainable value creation

     Financial Ambitions 2020                                                                                                       Market assumptions

      Sales Growth                                                 Ø 4-6% p.a.                                                    4 Automotive: Growth of global passenger car production around 2%
                                                                   w/o external growth, FX-adjusted

                                                                                                                                  4 Industrial: Low single-digit growth of industrial production
      EBIT Margin                                                  12-13% p.a.
                                                                   Before one-off effects, w/o external growth

      Free Cash flow                                               ~€ 900M in 2020
                                                                   w/o external growth

      Earnings per Share                                           ~€ 2.00 per share in 2020
                                                                   w/o external growth

      Gearing ratio 1)
3 Investment highlights
The Schaeffler Equity Story – 3 key elements

    3 key elements                                                                                                   Key objectives
                                                                                                 Growth

                               u Consistent growth above markets;
         Outperformance          targeting at least 4%-pts OE sales above market until 2020
     1
         in Automotive         u Best-in-class margin

                                                                                                 Margin
                                                                                                                            Profitable growth

                                                                                                                 q
                               u CORE program launched to revitalize                                                         and sustainable
         Margin upside           Industrial division
     2
         in Industrial         u Margin upside potential + 3%-points                                                          value creation

                                                                                                   Cash
                                                                                                   flow
         Strong Free           u Strong operating Cash flow Generation
     3   Cash flow             u FCF used for dividend payments, M&A and further
         generation              deleveraging

8           January 10, 2017                          2017 Global Auto Industry Conference | © Schaeffler 2017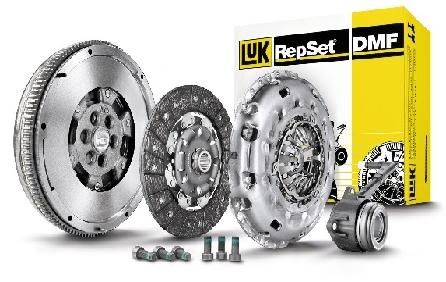
3 Investment highlights – Outperformance Automotive
  1 Schaeffler Automotive – Strong track                                   record of above market growth

    Sales and EBIT margin                                                                                        Out-performance in all regions1)
                                                                                                                                               Global Market +4%
                                                                             9,993         10,169
                                               8,164          8,986                                                                                 Schaeffler Automotive +9%
                                  7,658
                                                                                                                                                        Market        Schaeffler

                                                                                                                             15%                                                                                 24%

                                  2012         2013            2014          2015        LTM 2016                                                                                   9%
                                                                                                                     5%                           2%     5%                1%                             7%
    Growth rate (y-o-y)            +7.0%       +6.6%         +10.0%        +11.2%           +3.5%
    EBIT margin1)                  13.5%       13.0%          14.0%         13.6%           14.2%                     Americas                      Europe                 Asia / Pacific                Greater China
    1) Before   one-off effects                                                                                  1) Schaeffler   Automotive CAGR 2010 – 2015 excluding Aftermarket and FX

    Sales by region                                                                                              Broad customer mix
                                                                                                                   Top 10 customers
                                                22%

                                                                                                                                                                                                               40%
                                                                 53%
                                            15%
                                                                                                                                                                                       60%
                                                  10%

                                   Europe   Asia/Pacific   Greater China   Americas
                                                                                                                                                                                            Top 10 automotive customers
                                                                                                                                                                                            Other customers

9                  January 10, 2017                                              2017 Global Auto Industry Conference | © Schaeffler 2017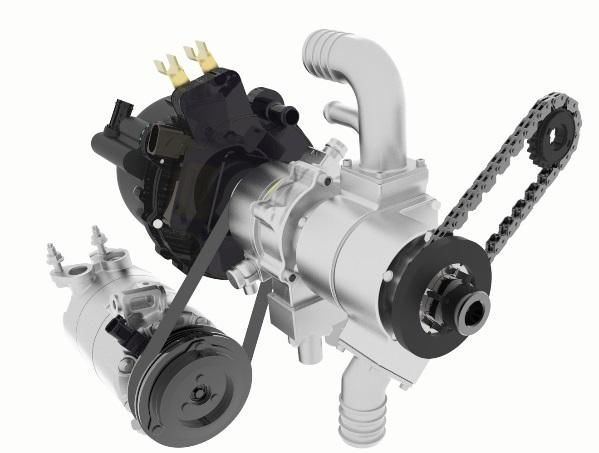
3 Investment highlights – Outperformance Automotive
 1   Outperformance Automotive – Four main growth drivers

     Growth drivers                                                          Current examples
                                                                             Finger follower                                                                                  Finger follower
                                                                             (not switchable)                                      ~ 4 x more                                    (switchable)
        Growth from                                                                                                                 content1)
      1
        new technologies / products

                                                                             Conventional                                                                                      Double clutch
                                                                             clutch                                                                                           with actuation
                                                                                                                                  ~ 10 x more
        Growth from                                                                                                                 content1)
                                                                                                                                                                             and control unit
      2
        higher systems share

                                                                    q
                                                                                                                                                                              Ball screw drive
                                                                                                                                    +15% pts                                        for electric
        Growth from                                                                                                                installation                                   brake China
      3                                                                                                                               rate2)
        new customers and markets

                                                                             Dual mass                                                                                                 RepSet
                                                                             flywheel                                                                                               dual mass
                                                                                                                                   > 4 x faster
        Growth from                                                          (single parts)                                         growth3)
                                                                                                                                                                                     flywheel
      4
        Aftermarket business
                                                                             1)   based on unit price; 2) installation rate 10% in 2015, 25% in 2020; 3) Sales CAGR 2015 – 2020

10         January 10, 2017                           2017 Global Auto Industry Conference | © Schaeffler 2017
3 Investment highlights – Outperformance Automotive
1 Outperformance to increase again in 2017 – 4%-pts OE sales growth above market targeted 1)
Outperformance YTD September 2016: Targeted outperformance 2017
u Trucks effect: u Order book shows strong growth potential in all regions
Truck sales is part of our total Automotive sales, weak and business divisions
markets dampening growth u Growth from existing technologies/products:
u Phase out effect: Torque converters in the US, new DCT projects in China,
Phase-out of two projects affecting growth rate negatively new contract with UniAir system
in 2016 u Growth from new technologies/products:
u Americas mix effect: Innovative thermal management module, electro
OEM stopped production of two small sedans as market mechanical cam phasing system, new e-clutch
was shifting to SUVs and light trucks u Growth from new customers/markets:
Strong growth in China with non Chinese OEMs as well as
Chinese OEMs (dual clutch dry/wet, dual mass flywheel,
clutch release system)
2016 2017
outperformance YTD 09: outperformance target:
1) At constant currency ~ 2% ~ 4%
11 January 10, 2017 2017 Global Auto Industry Conference | © Schaeffler 20173 Investment highlights – Outperformance Automotive
1 Market growth based on increasing production of hybrid and electric vehicles – Two scenarios
Global production volume 1) Basic scenario 2) Global production volume 1) Accelerated
in millions of units in millions of units scenario 2)
CAGR 2010/2030 CAGR 2010/2030
+2.4% p.a. 120 +2.4% p.a. 120
111 111
10%
102 4% 102 30%
15%
89 89
13% 24% 37% 13%
74 74 35%
40%
98% 97% 85% 72% 53% 98% 97% 85% 50%
30%
2010 2015 2020e 2025e 2030e 2010 2015 2020e 2025e 2030e
Battery electric vehicles Battery electric vehicles
Source: IHS, LMC Automotive, Schaeffler Group projections Source: IHS, LMC Automotive, Schaeffler Group projections
1) Annually expected global production volume, automobiles/small Hybrid vehicles 1) Annually expected global production volume, automobiles/small Hybrid vehicles
utility vehicles in millions of units utility vehicles in millions of units
2) Schaeffler estimates Internal combustion engines 2) Schaeffler estimates Internal combustion engines
12 January 10, 2017 2017 Global Auto Industry Conference | © Schaeffler 20173 Investment highlights – Outperformance Automotive
1 Strong starting position in e-mobility – Six series contracts for hybrid modules and e-axles
Product portfolio Key aspects
1999
C02 – Reduction
1st Schaeffler E-Mobility symposium
2002
1st E-Mobility concept car
2005
1st serial production of components
HV hybrid for hybrid modules
module
48 V hybrid 2016
module Electric wheel u 500 Million Euro investment to date1),
hub drive 1,200 employees globally
E-Clutch
u More than 20 customer projects
HV e-axle
u 6 series contracts for hybrid modules and
e-axles
48 V 48 V
e-axle 2020
Front end
accessory drive u Further 500 Million Euro investment1)
u Doubling of employees in R&D and
Mild hybrid vehicles (48 V) Hybrid vehicles (HEV, PHEV) Electric vehicles (BEV)
manufacturing
Grade of electrification
1) IncludingR&D
14 January 10, 2017 2017 Global Auto Industry Conference | © Schaeffler 20173 Investment highlights – Outperformance Automotive
1 Example Schaeffler North America – Developing components and systems for future technology
48V transmission driven accessories Hybrid module HV E-Axle
u Mild hybrid system invented and u Expertise in components saved u R&D in-place in the region
developed in US >50mm when integrated into a
system u Engaged in 7 E-Axle projects
u 12 KW
u Can be utilized as a full hybrid or u Component expertise yields smaller,
u Direct energy recovery results in plug-in hybrid lighter packages
fuel economony levels equivelant
or greater than a P2 hybrid for the u SOP 2018
cost of a Belt Starter Alternator
14 January 10, 2017 2017 Global Auto Industry Conference | © Schaeffler 20173 Investment highlights – Outperformance Automotive
1 Compact Dynamics acquired – Broadening competence and scope
1 System and Powertrain Competence 2 Acquisition
u Schaeffler acquires a 51% stake in Compact
Dynamics GmbH from SEMIKRON International
GmbH.
u Closing expected in Q1 2017; call option for
remaining 49% stake until June 2018.
u Compact Dynamics is a development specialist in
the field of innovative, electric drive concepts
3 Cooperation
u 500 Million Euro investment to date1), u At the same time, SEMIKRON and Schaeffler
1,200 employees globally establish a cooperation to develop power electronic HV E-Axle
solutions for alternative drive concepts
u More than 20 customer projects
u SEMIKRON is a worldwide leader for innovative Preferred
u 6 series contracts for hybrid modules and power electronics Mobility Solutions Partner
e-axles
u Schaeffler is significantly expending its expertise in
e-motors and power electronics
15 January 10, 2017 2017 Global Auto Industry Conference | © Schaeffler 20173 Investment highlights – Margin upside Industrial
2 Schaeffler Industrial – Bearing solutions for 8 sector clusters and distribution
Sales development 2012 – 2015 Sales split by region 2015
Americas
3,406
3,233 19%
3,138 Greater China Europe
3,041
2012 2013 2014 2015 15% 56%
Growth rate (y-o-y) -1.6% -10.7% +3.2% +3.0%
Asia/Pacific 10%
EBIT-margin1) 12.7% 10.7% 9.6% 9.7%
1) Before one-off effects
Sales split by sector cluster & distribution channel 2015 Sales split by business model 20151)
Wind Raw Materials Standard product
distribution business
10% 8% Aerospace
7% Customized product business
Rail 30%
7% 35%
5% Offroad
Industrial Distribution 33%
4% Two-Wheelers
14% Standard product
13% 35% OEM and MRO business
Industrial Automation Power Transmission
1) Including service business
16 January 10, 2017 2017 Global Auto Industry Conference | © Schaeffler 20173 Investment highlights – Margin upside Industrial
2 Program CORE – Revitalizing the Industrial division
4 key drivers
1 u Strengthen sales organizations in the regions
Customer
u Strengthen regional engineering / customer support centers
focus and
growth u Establish dedicated global key account management
2 u Reduce overhead cost
Cost
reduction & u Re-dimension central departments
efficiency u Drive cost saving program including material cost,
Program improvement efficiency gains and overhead reduction
CORE
3 u Establish European distribution centers (EDC)
High
to ensure immediate product availability
delivery
performance u Increase level of standardization
u Implement high runner program with 24/48h delivery time
4 u Strengthen standard product business
Optimized
product u Balance customized product business / engineering solutions
and service u Enforce market penetration of service / digitalization
offering
17 January 10, 2017 2017 Global Auto Industry Conference | © Schaeffler 20173 Investment highlights – Margin upside Industrial
2 Program CORE – Overall target remains in place
Successful implementation Financial ambitions
Today
Indicative Stable market
Timing
environment
Continuous improvement through
further optional measures
EBIT margin
500 HCO Industrial Division
Cost reduction 10-11% in 2018
2nd wave
24 months
Cost reduction 500 HCO
1st wave Successful
implementation
24 months of CORE program
2015 2016 2017 2018 2019
18 January 10, 2017 2017 Global Auto Industry Conference | © Schaeffler 20173 Investment highlights – Strong Free Cash Flow Generation
3 Use of cash – M&A strategy based on selected add-on acquisitions
M&A strategy Use of cash
Approach 4 Focus on technological competence to maintain our strong position as
technology and innovation leader
External growth
4 Focus on smaller add-on acquisitions that contribute to a sustainable Add-on
value creation acquisitions
Acquisition 4 Strategic and cultural fit, technological excellence and value
Criteria
Use
contribution as the most important acquisition criteria of
4 Possible acquisitions will be in the three-digit million range Cash
Deleveraging Dividends
Automotive 4 Attractive pipeline of potential acquisition targets for both divisions Further 30-40% of
& Industrial optimization of net income
4 Focus in Automotive and Industrial is on technology and on balance sheet
strengthening market positions
19 January 10, 2017 2017 Global Auto Industry Conference | © Schaeffler 20174 Summary
Key messages
Schaeffler is a leading global automotive and industrial supplier with superior
1
technologies
Strategy "Mobility for tomorrow" implemented; Financial Ambitions 2020 with focus on
2
sales growth, EBIT margin, FCF generation, EPS, gearing ratio and dividend payout ratio
3
Returning to historic outperformance levels in Automotive targeted as of 2017; move Mobility for
into e-Mobility offer significant growth potential (leveraged via recent M&A activity) tomorrow
Program CORE to revitalize the Industrial division extended; second wave of efficiency
4
measures initiated
5 Strong cash flow generation allow for selected technological add-on acquisitions
20 January 10, 2017 2017 Global Auto Industry Conference | © Schaeffler 2017IR Contact
Investor Relations Financial Calendar
FY 2016 results: March 8, 2017
Phone: + 49 9132 82 4440 Q1 2017 results: May 11, 2017
Email: ir@schaeffler.com H1 2017 results: August 8, 2017
Web: www.schaeffler.com/ir 9M 2017 results: November 8, 2017
21 January 10, 2017 2017 Global Auto Industry Conference | © Schaeffler 2017Backup
2 Cost reduction and efficiency improvements – First wave mostly completed
Key aspects Indicative Financial Impact
Δ EBIT in EUR mn
40
4 First wave announced in August 2015 31
152)
4 Cost savings through HCO reduction in overhead functions of the
Industrial Division
4 Reduction of 500 HCO mainly in Germany until 12/2017 -36
4 Approximately 40 EUR mn overhead cost savings (full run rate 2018) 2014A 2015A 2016F 2017P 2018P
1) Financial impact in specific year
4 36 EUR mn restructuring provisions (booked in Q IV 2015) 2) thereof 9 mn Euro YTD September 2016
EBIT Improvement One-off effects
Completion
HCO reduction Overhead Ratio 83 % 3)
2.165 263
154
83
1.665
417
Overhead Left payroll Signed In progress Target
Headcount termination Overhead
06/2015 contracts Headcount
3) as of November 3, 2016 12/2017
22 January 10, 2017 2017 Global Auto Industry Conference | © Schaeffler 2017Backup
2 Cost reduction and efficiency improvements – Second wave initiated
Key aspects Indicative Financial Impact
Δ EBIT in EUR mn
58
4 Second wave announced in November 2016 41
23
50 60
4 Cost savings through consolidation of plants in Europe and Americas 37
and HCO reduction in overhead functions also outside the Industrial
-9 -2
division -14
4 Reduction of 500 HCO in Germany1), Europe and other regions -50 1)
targeted 2015A 2016F 2017P 2018P 2019P
1) 2016-2019 in total75 mn Euro, thereof 50 mn Euro booked as EBIT Improvement One-off costs
4 Approximately 60 EUR mn improvement from Gross Profit restructuring provision
optimization and Overhead cost reduction until 2019 planned
Indicative
HCO reduction Plants/Overhead figures
4 Around 75 EUR mn one-off-cost until 2019 of which approximately
50 EUR mn shall be booked as restructuring provisions
as of year end 2016 500 ~400
~100
Total HCO Germany Europe Amercias Others
reduction
target
1) Subject to negotiation with working council
23 January 10, 2017 2017 Global Auto Industry Conference | © Schaeffler 2017Backup
Sales growth 9M 2016 2.7% (FX-adjusted)
Sales Sales by region 9M 2016
in EUR mn y-o-y growth (w/o FX effects)
Asia/Pacific
+2.7%1)
+2.9% (+4.4%)
vs 9M 2015
Greater China 10.3%
3,339 3,382 3,343 3,369
3,237 3,221 3,265 +5.5% (+10.5%) 14.3%
54.2%
21.2%
Americas Europe
-5.0% (-0.4%) +0.5% (+1.7%)
13,179 9,977
Q1 Q2 Q3 Q4 Q1 Q2 Q3 Sales by division
Y-o-y growth (w/o FX effects)
2015 2016
D D
FX-adjusted sales growth in % 9M15 9M 16 (w/o FX Q3 15 Q3 16 (w/o FX
5.3 4.5 2.9 1.3 2.4 3.3 2.3 effects) effects)
3.5 2.7 Auto-
7,511 7,703 +5.3% 2,442 2,524 +5.1%
motive
EBIT margin2) in %
13.2 11.4 13.4 13.0 12.6 13.0 12.8 Industrial 2,447 2,274 -5.3% 795 741 -6.2%
12.3 12.8
Total 9,958 9,977 +2.7% 3,237 3,265 +2.3%
1) FX-adjusted
2) Before one-off effects
24 January 10, 2017 2017 Global Auto Industry Conference | © Schaeffler 2017Backup
Automotive – Strong growth in Greater China
Automotive sales and market development 9M Automotive sales by division 9M
Europe Americas Greater China Asia/Pacific in EUR mn 9M 2015
+22% +4.7%1) 9M 2016
+11%
+7% +2.4%1) 3,150 3,217
+4% +3%
0% +1% 1,946 1,960 +10.3%1)
+6.2%1)
-3% 1,317 1,384
1,098 1,142
World production: +3.4%
Schaeffler Automotive: +5.3%
(w/o FX effects)
Engine Systems Transmission Chassis Systems Automotive
Production of light vehicles 9M 2016 vs 9M 2015 (IHS) Systems Aftermarket
Sales growth (w/o FX effects) Schaeffler Automotive 9M 2016 vs 9M 2015
Automotive sales by division Q3
Automotive sales by region Asia/Pacific
in EUR mn Q3 2015
Q3: +3.7% FX-adjusted
+4.4%1) Q3 2016
Greater China 10% 1,009 1,037
+2.4%1)
Q3: +38.9% FX-adjusted 15%
625 636 +9.8%1)
+5.3%1)
53% 352 368 456 483
Americas 22%
Europe
Q3: -1.2% FX-adjusted
Q3: +0.2% FX-adjusted Engine Systems Transmission Chassis Systems Automotive
Systems Aftermarket
Sales 9M 2016: EUR 7,703 mn 1) Growth rates FX-adjusted
25 January 10, 2017 2017 Global Auto Industry Conference | © Schaeffler 2017Backup
Industrial – Mixed development across sectors
Industrial sales by sector cluster 9M1) Industrial sales by region 9M
in EUR mn 9M 2015
9M 2016
Two-Wheelers
Wind -0.9%1)
Aerospace 1,382 1,352 -6.4%1)
Industrial Automation -20.4%1)
466 423 -5.3%1)
Offroad 361
279 238 220
Power Transmission
Rail
Raw Materials Europe Americas Greater China Asia/Pacific
Industrial Distribution
-25% -20% -15% -10% -5% +5% +10% +15%
Industrial sales by sector cluster Q31) Industrial sales by region Q3
in EUR mn Q3 2015
Two-Wheelers Q3 2016
Industrial Automation
Aerospace -2.4%1)
Wind
451 435
Offroad
-4.7%1) -21.1%1)
Power Transmission -6.3%1)
146 139 122 93
Rail 76 74
Raw Materials
Industrial Distribution Europe Americas Greater China Asia/Pacific
-25% -20% -15% -10% -5% +5% +10% +15%
1) FX-adjusted 1) Growth rates FX-adjusted
26 January 10, 2017 2017 Global Auto Industry Conference | © Schaeffler 2017Backup
Overview Corporate and Financing Structure
Corporate Structure (simplified) Financing Structure
as of October 14, 2016 as of October 14, 2016
INA-Holding Schaeffler IHO Verwaltungs GmbH (HoldCo)
GmbH & Co. KG
Nominal Nominal
Debt instrument Interest Maturity Rating
(USD mn) (EUR mn)
Term loan (EUR) - 4251) E+2.75% Sep-21 not rated
Loans
IHO Beteiligungs
GmbH RCF (EUR 200 mn) - - E+2.75% Sep-21 not rated
(formerly Schaeffler 10.0%
Verwaltungs GmbH) 2.75% SSNs 2021 (EUR)2) - 750 2.75% Sep-21 Ba1/BB-
4.125% SSNs 2021 (USD)2) 500 4553) 4.125% Sep-21 Ba1/BB-
3.25% SSNs 2023 (EUR)2) - 750 3.25% Sep-23 Ba1/BB-
Bonds
4.50% SSNs 2023 (USD)2) 500 4553) 4.50% Sep-23 Ba1/BB-
HoldCo bonds
IHO Verwaltungs 3.75% SSNs 2026 (EUR)2) - 750 3.75% Sep-26 Ba1/BB-
GmbH 4.75% SSNs 2026 (USD)2) 500 4553) 4.75% Sep-26 Ba1/BB-
and loans (formerly Schaeffler
Verwaltung Zwei GmbH) Total 4,040
Free Free
float float
Schaeffler Group (OpCo)
24.9% 75.1% 36.0% 54.0% Nominal Nominal
Debt instrument Interest Maturity Rating
(USD mn) (EUR mn)
Term loan (EUR) - 1,000 E+1.45% Jul-21 not rated
Loans
OpCo RCF (EUR 1,300 mn) - - E+1.05% Jul-21 not rated
Schaeffler AG Continental AG 2.50% SSNs 2020 (EUR) - 400 2.50% May-20 Baa3/BB+
loans
4.25% SSNs 2021 (USD) 700 6363) 4.25% May-21 Baa3/BB+
Bonds
3.50% SSNs 2022 (EUR) - 500 3.50% May-22 Baa3/BB+
4.75% SSNs 2023 (USD) 600 5453) 4.75% May-23 Baa3/BB+
3.25% SSNs 2025 (EUR) - 600 3.25% May-25 Baa3/BB+
OpCo Schaeffler
Schaeffler Total 3,681
Technologies
bonds Finance B.V.
AG & Co. KG
1) Up to EUR 600 mn.
2) Senior Secured PIK Toggle Notes.
3) EUR/USD = 1.10 as of October 14, 2016.
27 January 10, 2017 2017 Global Auto Industry Conference | © Schaeffler 2017You can also read