Premium packaging solutions - Investor Relations

Page created by Brandon Simpson
 
CONTINUE READING
Premium packaging solutions - Investor Relations
Premium packaging solutions

                              1
Premium packaging solutions - Investor Relations
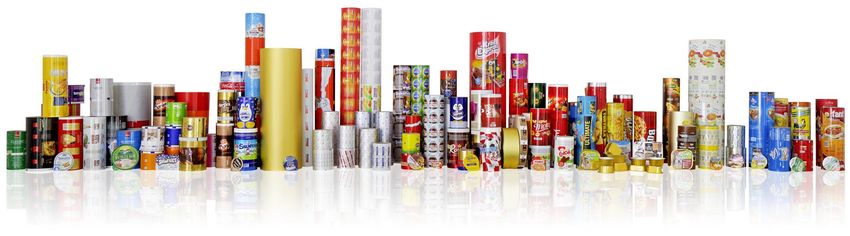
Aluflexpack AG
Full year 2020 results
19 March 2021
Disclaimer

The information contained in this presentation is not for use within any country or jurisdiction or by any persons where such use would constitute a violation of law. If this applies to you, you are not
authorized to access or use any such information. The presentation may not be reproduced, published or transmitted, in whole or in part, directly or indirectly, to any person (whether within or outside
such person’s organization or firm) other than its intended recipients.

The attached information is not an offer to sell or a solicitation of an offer to purchase any security in the United States or elsewhere and shall not constitute an offer, solicitation or sale any securities of
Aluflexpack AG (Aluflexpack, Group) in any state or jurisdiction in which, or to any person to whom such an offer, solicitation or sale would be unlawful nor shall it or any part of it form the basis of, or be
relied on in connection with, any contract or investment decision. No securities may be offered or sold within the United States or to U.S. persons absent registration or an applicable exemption from
registration requirements. Any public offering of securities to be made in the United States will be made by means of a prospectus that may be obtained from any issuer of such securities and that will
contain detailed information about us. Any failure to comply with the restrictions set out in this paragraph may constitute a violation of the securities laws of any such jurisdiction. This presentation is not
an offering circular within the meaning of article 652a of the Swiss Code of Obligations, nor is it a listing prospectus within the meaning of the listing rules of the SIX Swiss Exchange or a prospectus
under any other applicable laws.

This presentation may contain “forward-looking statements” that are based on our current expectations, assumptions, estimates and projections about us and our industry. Forward-looking statements
include, without limitation, any statement that may predict, forecast, indicate or imply future results, performance or achievements, and may contain the words “may”, “will”, “should”, “continue”, “believe”,
“anticipate”, “expect”, “estimate”, “intend”, “project”, “plan”, “will likely continue”, “will likely result”, or words or phrases with similar meaning. Undue reliance should not be placed on such statements
because, by their nature, forward-looking statements involve risks and uncertainties, including, without limitation, economic, competitive, governmental and technological factors outside of the control of
Aluflexpack AG (Aluflexpack, Group), that may cause Aluflexpack’s business, strategy or actual results to differ materially from the forward-looking statements (or from past results). Nothing contained in
this presentation is or should be relied upon as a promise or representation as to the future. It is up to the recipient of the presentation to make its own assessment as to the validity of such forward-
looking statements and assumptions.

The information contained in the presentation does not purport to be comprehensive. Aluflexpack undertakes no obligation to publicly update or revise any information contained herein or forward-
looking statements, whether to reflect new information, future events or circumstances or otherwise. It should further be noted, that past performance is not a guide to future performance. Please also
note that interim results are not necessarily indicative of the full-year results. Persons requiring advice should consult an independent adviser. Some financial information in this presentation has been
rounded and, as a result, the figures shown as totals in this presentation may vary slightly from the exact arithmetic aggregation of the figures that precede them. While we are making great efforts to
include accurate and up-to-date information, we make no representations or warranties, expressed or implied, and no reliance may be placed by any person as to the accuracy and completeness of the
information provided in this presentation and we disclaim any liability for the use of it. Neither Aluflexpack nor any of its directors, officers, employees, agents, affiliates or advisers is under an obligation
to update, correct or keep current the information contained in this presentation to which it relates or to provide the recipient of it with access to any additional information that may arise in connection
with it and any opinions expressed in this presentation are subject to change.

In this presentation, we utilise certain alternative performance measures, including EBITDA, adjusted EBITDA, adjusted Operating Profit, organic growth, Working Capital ratio, and others that in each
case are not recognized under International Financial Reporting Standards (“IFRS”). These non-IFRS measures are presented as we believe that they and similar measures are widely used in the
markets in which we operate as a means of evaluating a company’s operating performance and financing structure. They may not be comparable to other similarly titled measures of other companies
and are not measurements under IFRS or other generally accepted accounting principles, nor should they be considered as substitutes for the information contained in the financial statements included
in this presentation. For a particular definition of any of the mentioned and non-mentioned alternative performance indicators please see either notes in this presentation or definitions in our HY2019
interim financial statement.

By receiving this Presentation, you agree to be bound by the foregoing limitations. Any failure to comply with these restrictions may constitute a violation of applicable securities laws.
This Presentation does not constitute investment, legal, accounting, regulatory, taxation or other advice.
THIS PRESENTATION IS NOT AN INVITATION TO PURCHASE SECURITIES OF ALUFLEXPACK AG OR THE GROUP.

                                                                                                                                                                                                                      3
Executive summary
FY 2020 results presentation

                           FY 2020 net sales increased by 15.2% to € 239.4m, of which
  Dynamic growth in
                           13.7% organic, based on strong business development and solid
  net sales
                           demand in most of Aluflexpack’s end-markets.

                           Increase in adj. EBITDA by 26.8% yoy to € 37.4m and in adj.
  Continuous develop-      EBITDA margin from 14.2% to 15.6% driven by further scaling of
  ment of results          the business model and operational improvements.

                           Continued focus on development of premium solutions in
  Strategically on track   attractive end-markets and expansion of technological
                           infrastructure. Integration of Polish acquisition progressing well.

                           Preparation for start of construction of major expansion is in full
  Update on organic
                           swing; expected ramp-up of new capacities by end of 2022;
  expansion program
                           concentration of € 65m investments in Drniš (Croatia).

                           Net sales guidance of € 260m to € 270m affirmed, EBITDA
  Outlook for 2021
                           before one-offs expected to be between € 40m and € 43m.

                                                                                                 4
Net sales overview
Dynamic growth of 15.2% in FY 2020 (13.7% organic)

Net sales
(in €m)

                                                     Net sales drivers in 2020

                                          239.4      •   Focus on attractive niches.
                                  207.9
                                                     •   Stable demand for on-the-shelf food products
                          181.7
                                                         and pharmaceuticals over the course of the
                  160.6
                                                         pandemic.
          144.1

                                                     •   Flexible and reliable service as well as
                                                         uncompromised product quality.

                                                     •   Fully operational throughout 2020.

                                                     •   Consolidation of Polish acquisition as of 1
          2016    2017    2018    2019    2020           September 2020.

                                                                                                        5
End-market dynamics
Strong business development across most end-markets in FY 2020

Net sales growth rates for Aluflexpack in its end-markets                 Net sales split by end-markets
(in %, FY 2020 yoy)                                                       (FY 2020)

        41%

                                                                                                       3%
                                                                                                 11%
                                                                                                             23%

                                                                                           13%

                                 16%                            16%                               € 239.4m
                        13%                 12%                                                                 18%
                                                                                            14%
                                                      8%
                                                                                                       18%

      Coffee &          Dairy   Pet food   Pharma Other food    Other                      Coffee & Tea      Other food
        Tea                                                    non-food                    Pet food          Confectionery
                  -7%                                                                      Dairy             Other non-food
                                                                                           Pharmaceuticals

Comment
Demand in AFP’s focus end-markets Coffee & Tea, Pet food and Pharmaceuticals continued to be on a solid level in 2020. The Confectionery
end-market suffered in H1 and recovered modestly in H2 already, whereas dynamics in the Dairy end-market slowed down in H2. Growth in
Other food and Other non-food can be explained by a ramp-up of new product solutions.

                                                                                                                                           6
Earnings highlights
Improvement of adj. EBITDA to € 37.4m, margin of 15.6% in 2020

 Adj. EBITDA                                                                                                                    Adj. EBIT
 (in €m / margin in % of net sales)(1)                                                                                          (in €m / margin in % of net sales)(1)

           10.0%                      11.3%                     11.9%                     14.2%                         15.6%        2.3%            3.7%               4.4%   6.6%   8.1%

                                                                                                                        37.4

                                                                                            29.5

                                                                  21.6                                                                                                                20.0
                                        18.1
                                                                                                                                                                               13.8
             14.4

                                                                                                                                                                        8.0
                                                                                                                                                     5.9
                                                                                                                                     3.3

             2016                      2017                      2018                       2019                        2020        2016             2017               2018   2019   2020

  Drivers
  • Economies of scale - cost positions growing slower than top line, e.g. personnel costs, energy costs.
  • Efficiency improvements across organisation.
  • Contribution from investments into platform in prior years.

Notes: (1) A detailed reconciliation from reported to adjusted figures can be found on slide 26 of this presentation.

                                                                                                                                                                                             7
Cost management
Improvements in material and personnel cost margins in 2020

 400Material            costs                                                                                                          85 Other
                                                                                                                                    70.0%                   operating costs
     (in €m / in % of net sales, on adj. level)(1)                                                                                            (in €m / in % of net sales, on adj. level)(2)                                                                      19.0%
 350                                                                                                                                   75
                                                                                                                                    68.0%
                                                                                                                                       65                                                                                                                        17.0%
 300             65.4%
                                                                 64.5%                                                              66.0%
                                                                                                                                       55                                                                                                                        15.0%
 250                                     63.5%                                          63.4%
                                                                                                                                    64.0%               12.4%                   12.6%
                                                                                                                                       45                                                               12.2%                                                    13.0%
 200
                                                                                                                61.2%               62.0%                                                                                        10.6%                   11.0%
                                                                                                                                       35
 150                                                                                                                                                                                                                                                             11.0%
                                                                                                                                       25
                                                                                                                                    60.0%
 100                                                                                                                                                                                                                                                             9.0%
                                                                                         131.8                   146.4                 15                                                                                                                 26.4
   50             94.3                   102.0                   117.3                                                              58.0%                                         20.3                    22.1                    22.1
                                                                                                                                                         17.8                                                                                                    7.0%
                                                                                                                                         5
     0                                                                                                                              56.0%
                  2016                    2017                    2018                    2019                   2020                   -5               2016                    2017                    2018                     2019                    2020   5.0%

 100                                                                                                                                19.0%
                                                                                                                                       Comments
   90Personnel               costs                                                                                                     •
                                                                                                                                    18.0% Material costs in % of net sales improved further in 2020 despite
   80(in €m / in % of net sales, on adj. level)
                                               (3)
                                                                                                                                    17.0% Covid-19 related temporary cost increases for certain input materials,
   70                                                                                                                                     mainly based on efficiency gains and benefits from further
                                                                                                                                    16.0% integration of our supply chain.
   60
                                                                                                                                    15.0%
   50
                                                                 13.5%                  13.4%                                          •
                                                                                                                                    14.0% Other operating costs in % of net sales increased to 11.0% as
   40                                    13.1%                                                                  12.9%                     increased expenses for commissions, insurance and provisions for bad
                 12.7%
                                                                                                                                    13.0% debt outweighed reduced travel and energy costs, on a relative basis.
   30
   20                                                                                                                               12.0%
                                                                  24.5                    28.0                    30.8
                                                                                                                                    11.0%
                                                                                                                                         •Personnel costs in % of net sales decreased to 12.9% in 2020, which
   10             18.4                    21.0
                                                                                                                                          is indicative of the benefits from an increase in the Group’s operating
     0                                                                                                                              10.0% leverage.
                  2016                    2017                    2018                    2019                   2020
Notes: (1) Material costs are defined as cost of materials, supplies and services less temporary personnel, less income from disposal from recycling products, less related income from insurance, less income from claims and adjusted for changes in
finished and unfinished goods and other effects; (2) Adjusted for costs for listing on the stock exchange and costs in relation to the fire incident at Eliopack in June 2019; (3) Adjusted for temporary personnel costs, one-off bonus payments paid by the
majority shareholder and costs for the employee phantom stock program. A detailed reconciliation between reported and adjusted figures can be found on pages 55 and 56 of Aluflexpack’s Annual Report 2020.                                                         8
Other cost positions
Relative decrease in depreciation(1), financial result reflecting FX and option impact

 Depreciation and amortisation                                                                                            Financial result
 (in €m / in % of net sales)                                                                                              (in €m)

                                                                                                                                                                          2020            2019
                                                                                                                          Net interest expenses                            -1.9           -3.7
                                                                                                                          Other financial income                            1.7           3.4
                                                                                                                          Other financial expenses                         -4.9           -1.8
                                                                                                                          Financial result                                 -5.2           -2.1
40
                                                                                                                  12.0%    Comments
35
                                                                                                                           •  Net interest expenses comprise interest payments to financial
30                                                                                                                10.0%       institutions and leases in the amount of € -1.9m (2019: € -3.7m).
              8.7%                   8.5%                   8.3%                   8.4%
25                                                                                                        7.9%
                                                                                                                  8.0%     •   Other financial income totaled € 1.7m in 2020 and includes
20                                                                                                                             mainly positive mark-to-market valuation effects from financial
                                                                                                           1.8
15
                                                                                    2.2                                        instruments used to hedge against the Group’s aluminium price
                                                             1.8                                                  6.0%
                                      1.8                                                                                      exposure.
               1.8
10
                                                                                                          17.0
                                                                                   15.3
              10.8                   11.9                   13.2                                                  4.0%     •   Other financial expenses amounted to € -4.9m and mainly
 5
                                                                                                                               encompass negative FX effects of local loans denominated in
 0                                                                                                                2.0%         Euro (€ -1.3), which are offset by an increase in equity, as well as
              2016                   2017                   2018                   2019                   2020                 negative effects from the valuation of outstanding put options for
                              Depreciation                      Amortisation                     in % sales
                                                                                                                               stakes in subsidiaries of the Group held by minority shareholders
                                                                                                                               (€ -3.4).

Note(s): On a relative basis; depreciation and amortisation is net of impairments in relation to fire incident.
                                                                                                                                                                                                      9
Profit and Loss statement - overview
Further improvement of result in 2020

           (in €m)                                                                                             2020      2019    yoy (%)   Comments

           Net Sales                                                                                           239.4     207.9    15.2     •   Further improvement in absolute results
                                                                                                                                               and margins across the board.
           EBITDA                                                                                               36.4     19.2     89.6
                                                                                                                                           •   Result before tax at € 12.2m (2019: €
           Adj. EBITDA(1)                                                                                       37.4     29.5     26.9
                                                                                                                                               -1.5m).
           Adj. EBITDA margin                                                                                 15.6%      14.2%
                                                                                                                                           •   € -3.2m in income tax expenses
                                                                                                                                               (2019: € -2.0m) due to increase in
           Adj. EBIT (1)                                                                                        20.0     13.8     45.0
                                                                                                                                               taxable base.
           Adj. EBIT margin                                                                                    8.3%      6.6%
                                                                                                                                           •   Result for the period increases to €
           Financial result                                                                                      -5.2    -2,1                  9.0m (2019: € -3.4m).

           Result before tax                                                                                    12.2     -1.5

           Result for the period                                                                                 9.0     -3.4

                                            o/w owners of the company                                            8.8     -3.5

                                          o/w non-controlling interests                                          0.2      0.1

Notes: (1) A detailed reconciliation from reported to adjusted figures can be found on slide 26 of this presentation..

                                                                                                                                                                                      10
Cashflow statement - overview
Increase in Operating Cashflow by 69% to € 26.1

                                                             Comments
  (in €m)                                    2020    2019
  Cash and cash equivalents at the                           •   Operating cash flow strongly increased to € 26.1m
  beginning of the period                    62.8    19.0        2020 (+69% yoy). Cash generation was slightly
                                                                 dampened by a negative cash impact from an increase
                                                                 in working capital in the amount of € 11.8m, mainly
  Net cash from operating activities         26.1    15.5
                                                                 relating to a build-up in inventory.

  Net cash used in investing activities      -32.9   -32.8
                                                             •   Investments of € 32.9m in 2020 include organic capex
                                                                 of € 20.5m and payments made for acquisitions.
  Net cash from financing activities         -11.5   60.1
  +/- effect of exchange rate fluctuations                   •   Net cash flows from financing activities amounted to
  on cash held                               -0.2    1.2         € -11.5m and include the combined effects of net
  Cash and cash equivalents at the end                           repayments of loans to financial institutions as well as
  of the period                              44.3    62.8        payments for lease liabilities.

                                                                                                                            11
Capital management
Trade Working Capital Ratio up mainly due to build-up in inventory

 Trade Working Capital (Ratio)
 (in €m / in % of net sales)(1)

  85.0                                                                                                                               30.0%

                                                                                                                                                       Comments
  75.0
                                                                                                                                     25.0%
  65.0
                                                                  21.1%
                                                                                                                                                       •       Inventories rose to € 59.6m (12/2019: € 48.7m) due to
                                                                                                                                                               increased business activity and the strategic decision to
  55.0                                                                                                            18.3%              20.0%                     temporarily increase the level of inventory to ensure
                  16.1%                                                                                                                                        stable supply chains and flexible service to customers
  45.0                                                                                    15.7%
                                          14.3%
                                                                                                                                                               in the current environment.
                                                                                                                                     15.0%
  35.0
                                                                                                                                                       •       Trade receivables increased to € 24.0m (12/2019:
                                                                                                                                                               € 22.8m) as a result of the additional business
  25.0                                                                                                                               10.0%
                                                                                                                   43.9                                        generated.
                                                                   38.3
  15.0                                                                                     32.7
                    23.2                    23.0                                                                                                       •       Total operative payables increased slightly to € 39.7m
                                                                                                                                     5.0%
                                                                                                                                                               (12/2019: € 38.9m).
   5.0

  -5.0             2016                    2017                    2018                    2019                    2020              0.0%              •       Increase in TWC ratio partly related to consolidation
                                                                                                                                                               effects of Polish acquisition.

Notes: (1) Trade Working Capital is calculated as sum of total inventories and trade receivables less total operative payables for a respective period. The Working Capital Ratio is calculated by dividing end of period working capital by sales of the last
12 months.
                                                                                                                                                                                                                                                                 12
Invested platform to support future growth
Capex for organic investment lower compared to prior year(1)

 Capex
 (in €m / in % of net sales)

                                                                                                                  Comments
 45                                                                                                       18.0%
                                                                             15.8%
 40                                                                                                       16.0%
                                                                                                                  •   Capital expenditure for organic investments in the amount
                                   13.2%
 35                                                                                                       14.0%       of € 20.5m, mainly for additional printing and finishing
 30                                                                                                       12.0%       capacities in the Group’s production sites in Croatia and
                                                        10.2%                                                         France, among others.
 25            8.8%                                                                                8.6%   10.0%

 20                                                                                                       8.0%    •   Capex-to-net-sales ratio decreased from 15.8% in 2019 to
 15
                                                                              32.9
                                                                                                          6.0%
                                                                                                                      8.6% in 2020.

 10                                 21.3                                                           20.5   4.0%
                                                         18.6                                                     •   Capex is expected to be on an elevated level in 2021,
               12.6                                                                                                   reflecting the bulk of the investments for the major on-site
   5                                                                                                      2.0%
                                                                                                                      expansion program in Croatia.
   0                                                                                                      0.0%
               2016                 2017                 2018                 2019                 2020

Note(s): Capex equals payments made for PPE and intangibles, but excludes payments for acquisitions.
                                                                                                                                                                                     13
Financial Position - overview
As of 31 December 2020

(in €m)                                31 Dec 2020   31 Dec 2019   Delta (%)   Comments
ASSETS
                                          146.8                                •   Increase in non-current
Non-current assets                                      133.3       10.1%          asset base due to investment
  o/w Property plant and equipment        106.7         102.2        4.4%          activity and inclusion of Top
  o/w Intangible assets and goodwill      38.6          29.9        28.9%          System.
 o/w Other non current assets               1.6          1.2         31.0%
                                                                               •   Inventory driven increase in
Current assets                            135.9         145.1        -6.3%         working capital to € 43.9
 o/w Inventories                           59.6          48.7        22.3%         (12/2019: € 32.7).
 o/w Trade receivables                     24.0          22.8         5.1%
 o/w Other receivables and assets           8.0          10.7       -25.1%     •   Solid financial position: Net
 o/w Cash and cash equivalents             44.3          62.8                      debt of € 6.0m (12/2019: net
                                                                    -29.4%
                                                                                   cash of € 12.1m) and equity
Total assets                              282.7         278.4         1.6%         ratio of 61.6% (12/2019:
                                                                                   61.9%) providing enough
EQUITY AND LIABILITIES                                                             room to manoeuvre during
                                                                                   upcoming expansion cycle.
Total equity                              174.3         172.2         1.2%
Non-current liabilities                    39.3          48.2       -18.4%
Current liabilities                        69.1          58.0        19.1%
Total equity and liabilities              282.7         278.4         1.6%

                                                                                                                   14
Return on capital employed
 ROCE increased to 11.7% highlighting further improvement of capital efficiency(1)

  Return on Capital Employed
  (in %)(1)

18.0%

16.0%
                                                                                                                                           Comments
14.0%
                                                                                                             11.7%
12.0%
                                                                                                                                           •       Despite increase in capital employed as a result of the
                                                                                       9.6%
10.0%                                                                                                                                              investments in recent years, return on capital employed
8.0%
                                                                                                                                                   (ROCE) increased further to 11.7% in 2020, which
                                                                6.9%
                                         5.9%                                                                                                      underlines the value-adding nature of investments made
6.0%                                                                                                                                               in Aluflexpack’s platform over recent years.
                  3.8%
4.0%
                                                                                                                                           •       The major organic investments scheduled for 2021 and the
2.0%
                                                                                                                                                   related increase in capital employed will impact the Group’s
0.0%                                                                                                                                               ROCE in 2021.
                  2016                   2017                   2018                   2019                   2020

 Notes: (1) ROCE stands for return on capital employed, and refers to Adjusted EBIT for the last twelve months divided by capital employed, which is defined as average equity plus average net debt for the last twelve months.

                                                                                                                                                                                                                                   15
Strategy unchanged
Focus on proven cornerstones of Aluflexpack’s business model

                Development &          Focus on           Deep integration      Leverage on
               manufacturing of        attractive              of the           economies of
               high value adding      end-markets           value chain        scale/operating
                   products                                                       leverage

               Ramp-up in SUP      Strengthen position     Leverage existing      Decrease of
Developments

               business; further   in Coffee & Tea, Pet       conversion       material costs and
    2020

                development of      food and Pharma           capacities,      personnel costs in
                coffee capsules        end-markets         announcement of       % of net sales
                   business                                  major on-site         achieved
                                                          expansion program

                                                                                                    16
Building blocks for accelerated growth

                                     Selected capacity
    Major on-site
                                        additions &      Value accretive
    expansion in
                                         efficiency       acquisitions
      Croatia
                                      improvements

                    Organic growth                        Bolt-on M&A
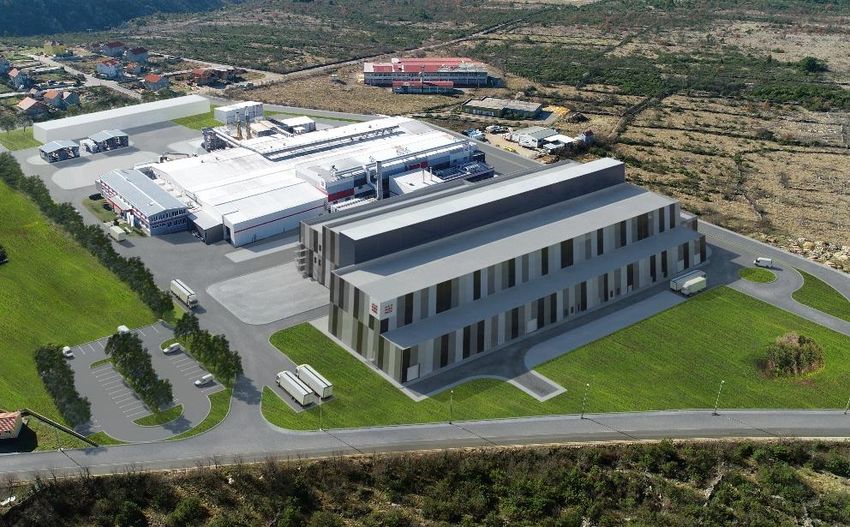
                                                                           17
Update on major on-site expansion program
Preparation for start of construction in full swing, focus of expansion in Drniš (Croatia)

-   Concentration of expansion in Drniš (Croatia)
    after thorough evaluation of options.

-   Orders and first down-payments for key
    machines placed.

-   Preparation for start of construction in H1 2021
    is in full swing.

-   Confirmed cornerstones of expansion:

      •   € 65m gross investment volume.

      •   Up to 30,000 mt of vertically integrated
                                                                   Value chain implications
          conversion capacities.
                                                          Pre-         Con-
      •   Start of industrial production by end of     treatment      version
                                                                                 Printing     Finishing
          2022, target of incremental sales of > €
                                                              Expansion                       Expansion
          100m by 2025.

                                                                                                          18
Outlook

 •   The Management Board affirms the validity of the Group’s net sales guidance of € 260-
     270m given in February 2021.

 •   At the EBITDA level, the Management Board anticipates a range from € 40m to € 43m
     before non-recurring effects for 2021, reflecting the tense situation on certain
     commodity markets for input materials used in plastic and liquid components.

 •   The Covid-19 pandemic adds an element of uncertainty that cannot be entirely
     assessed from today’s perspective.

                                                                                             19
Investor Relations

Contact Investor Relations                Financial Calendar 2021

                                           05.02.2021   FY 2020 Preliminary Sales Statement

Lukas Kothbauer                            19.03.2021   Publication of results for the full year ending 31 Dec 2020

Head of Investor Relations and M&A         07.05.2021   Q1 Sales Statement

Phone: +436648581124                       10.05.2021   Annual General Meeting

E-Mail: lukas.kothbauer@aluflexpack.com    23.08.2021   Publication of results for the half year ending 30 Jun 2021

                                           05.11.2021   Q3 Sales Statement

                                                                                                                      20
Appendix
Income statement

(in €m)                                    2020     2019
Gross Sales                                244.6    211.1
Sales deductions                             -5.2     -3.2
Net Sales                                  239.4    207.9
Change in finished and unfinished goods      5.2       0.7
Other operating income                       8.4      14.5
Cost of materials, supplies and services   -156.6   -138.7
Personnel expenses                          -31.8    -35.8
Other operating expenses                    -28.2    -29.5
EBITDA                                      36.4      19.2
Depreciation and amortisation               -19.0    -18.6
Operating Profit                            17.4       0.6
Interest income                              0.2       0.1
Interest expenses                            -2.2     -3.7
Other financial income                       1.7       3.4
Other financial expenses                     -4.9     -1.8
Financial result                             -5.2     -2.1
Result before tax                           12.2      -1.5
Tax expense/benefit                          -3.2     -2.0
Result for the period                        9.0      -3.4
Thereof attributable to:
    Owners of the company                   8.8      -3.5
    Non controlling interests               0.2      0.1

                                                             22
Balance Sheet – Assets

(in €m)                          31 Dec 2020   31 Dec 2019
ASSETS
Intangible assets and goodwill       38.6          29.9
Property, plant and equipment       106.7         102.2
Other receivables and assets          1.2           0.2
Deferred tax assets                   0.4           1.0
Non-current assets                  146.8         133.3

Inventories                          59.6          48.7
Trade receivables                    24.0          22.8
Other receivables and assets          8.0          10.7
Cash and cash equivalents            44.3          62.8
Current assets                      135.9         145.1

TOTAL ASSETS                        282.7         278.4

                                                             23
Balance Sheet – Equity and Liabilities

(in €m)                                               31 Dec 2020   31 Dec 2019
Capital stock                                             15.5          15.5
Capital reserves                                         135.9         135.9
Retained earnings                                         21.7          19.8
Equity attributable to owners of the Company             173.1         171.2
Non controlling interests                                  1.2           1.0
TOTAL EQUITY                                             174.3         172.2
Bank loans and borrowings                                 16.5          22.9
Other financial liabilities                               16.0          18.4
Deferred tax liabilities                                   4.4           4.5
Employee benefits                                          2.0           1.7
Other liabilities                                          0.4           0.6
Non-current liabilities                                   39.3          48.2
Bank loans and borrowings                                  7.1           6.1
Other financial liabilities                               10.8           3.4
Current tax liabilities                                    2.5           1.3
Provisions                                                 0.1           0.1
Employee benefits                                          2.4           1.5
Trade payables and advances received from customers       39.7          38.9
Accruals                                                   2.4           2.8
Other liabilities                                          4.2           4.0
Current liabilities                                       69.1          58.0
TOTAL LIABILITIES                                        108.4         106.2
TOTAL EQUITY AND LIABILITIES                             282.7         278.4

                                                                                  24
Cash flow statement

(in €m)                                                          2020    2019
Income/Loss before tax                                           12.2     -1.5
+/- Financial results excluding other financial income/expense    1.9      3.7
+/- Other non-cash expenses and income                            4.1     -3.9
+ Costs of initial public offering                                 0       2.8
+ Depreciation and amortisation                                  19.0     18.6
-/+ increase and decrease in inventories                         -11.1     0.7
-/+ Increase and decrease in current trade receivables            -1.5    -0.2
-/+ Increase and decrease in other assets                         1.5     -5.2
+/- Increase and decrease in trade payables                       0.8      3.3
+/- Increase and decrease in accruals                             -0.3     0.4
+/- Increase and decrease in other liabilities                    -0.2    -2.9
+/- Increase and decrease in provisions                           -0.1     0.1
+/- Increase and decrease in liabilities for employee benefits    1.3      0.8
-/+ Income taxes paid                                             -1.6    -1.1
Net cash from operating activities                               26.1     15.4
- Payments made for purchases of PPE and intangible assets       -20.5   -32.9
- Payments for acquisition of subsidiaries                       -12.6      0
+ Interest received                                               0.2      0.1
Net cash used in investing activities                            -32.9   -32.8
+ Proceeds from the issue of ordinary shares                       0     148.0
- Payments for costs of initial public offering                    0      -9.5
+ Contribution in kind                                             0       8.1
- Payments of lease liabilities                                   -4.1    -4.2
+ Issuances of financial liabilities (3rd parties)                0.3      5.2
- Repayments of financial liabilities (3rd parties)               -5.9   -17.3
- Repayments of financial liabilities (MTC group companies)        0     -67.8
- Interest paid                                                   -1.7    -2.5
Net cash from financing activities                               -11.5    60.1

                                                                                 25
Overview of earnings adjustments

  ADJUSTMENTS ON EBITDA LEVEL (in €m)                                                                                                                                2020                                        2019
  EBITDA - IFRS reported                                                                                                                                              36.4                                        19.2
  Cost for employee phantom stock program                                                                                                                              1.6
  Transaction costs1                                                                                                                                                   0.4                                         3.5
  Net income in relation to fire incident2                                                                                                                            -1.0                                         -1.7
  Other one-off personnel expenses3                                                                                                                                                                                8.5
  EBITDA - adjusted                                                                                                                                                    37.4                                        29.5

   ADJUSTMENTS ON EBIT LEVEL (in €m)                                                                                                                                 2020                                        2019
  EBIT (Operating Profit) - IFRS reported                                                                                                                             17.4                                        0.6
  Cost for employee phantom stock program                                                                                                                              1.6
  Transaction costs1                                                                                                                                                   0.4                                         3.5
  Net income in relation to fire incident2                                                                                                                            -1.0                                         -1.7
  Other one-off personnel expenses3                                                                                                                                                                                8.5
  Acquisition related amortisations                                                                                                                                     1.5                                        2.0
  Impairment in relation to fire incident                                                                                                                                                                          0.9
  EBIT - adjusted                                                                                                                                                      20.0                                        13.8

Notes: (1) Transaction costs in 2020 include advisory costs and financial transaction taxes in relation to the acquisition of Top System closed in September 2020 in the amount € 0.4m, whereas transaction costs in 2019 in the amount of € 3.5m pertain to
costs for listing on the stock exchange. (2) For both periods, the amount refers to net income from insurance reimbursements for tangible asset replacement, stock write-off and other expenses in relation to the fire incident that occurred at Eliopack in June
2019. (3) Other one-off personnel expenses in 2019 comprise € 8.1m of one-off bonus payments by the majority shareholder to the Management Board of Aluflexpack as well as € 0.4m of contractually due payments to former members of the Management                  26
Board.
You can also read