COMPANY RESULTS FULL YEAR 2017 - 23 August 2017 Woolworths Limited ABN 88 000 014 675
←
→
Page content transcription
If your browser does not render page correctly, please read the page content below

COMPANY
RESULTS
FULL YEAR 2017
23 August 2017

Woolworths Limited
ABN 88 000 014 675
Table of contents

 Key highlights, progress and outlook   Brad Banducci

 Financial results                      David Marr

 Business update                        Brad Banducci/David Walker

                                                                     2
Key highlights

•   Improved Customer, Team and Supplier Scores, especially in Australian Food

•   Strong sales momentum in Australian Food with FY17 comparable sales growth of 3.6%
    and Easter adjusted comparable sales growth in Q4’17 of 6.4%

•   WooliesX formed to accelerate growth in digital and national Pick up rollout well advanced

•   Endeavour Drinks delivered sales and EBIT growth in a competitive market

•   New BIG W turnaround plan and team in place with implementation underway

•   Exit of Home Improvement substantially finalised and sold EziBuy

•   Increase in final dividend of 17 cents, including the benefit from the Home Improvement
    exit, supported by strong increase in free cash flow and net debt reduction

                                                                                                 3
Progress against our                                               3       Evolving our Drinks business to provide
                                                                           even more value and convenience to customers

FIVE KEY PRIORITIES                                                •
                                                                   •
                                                                       Continued sales momentum from Dan Murphy’s and BWS
                                                                       Click & Collect rolled out to 1,240 BWS stores
                                                                   •   Langton’s integrated into Dan Murphy’s

1
                                                                   •   Strong double digit growth from Dan Murphy’s Online
     Building a customer and                                       •   My Dan Murphy’s now with 2.4 million members, BWS benefiting
     store-led culture and team                                        from Woolworths Rewards partnership

• Woolies Welcome for >500 support office team members
• 1.4m+ Food and Drinks customers provided direct feedback;
  27,000 call backs
• New incentives embedded and driving cultural change
                                                                   4       Empowering our portfolio businesses
                                                                           pursue strategies to deliver shareholder value

                                                                   •   Strong sales and EBIT growth from ALH Hotels
• 20%+ improvement in TRIFR
                                                                   •   Partnership with BP and sale of Petrol business announced
• Key new internal and external appointments
                                                                   •   Substantially finalised exit of Home Improvement and EziBuy sold
• WooliesX created to better service our connected customers
                                                                   •   New BIG W team and turnaround plan in place
• More to do on embedding our new Woolworths Ways-of-Working
                                                                   •   More to do on implementing BIG W plan and delivering sales
                                                                       momentum

2     Generating sustainable
      performance in Food
                                                                       5    Becoming a lean retailer through end-to-end
                                                                            process and systems excellence
• VOC and VOS significantly improved on the prior year
• 72 Renewals and 85 Upgrades completed                            • Customer-Led Rostering now live in all states for Woolworths
• Significant progress in Customer 1st Ranging and own brand         Supermarkets
  transition well underway                                         • Over 175,000 team members migrated to Success Factors Payroll
• Improved sales momentum in New Zealand Food                      • Building a customer 1st culture in Supply Chain
• More to do in improving customer experience, especially online   • Significant improvement in inventory days and availability
                                                                   • More work to do on transforming core end-to-end business processes

                                                                                                                                     4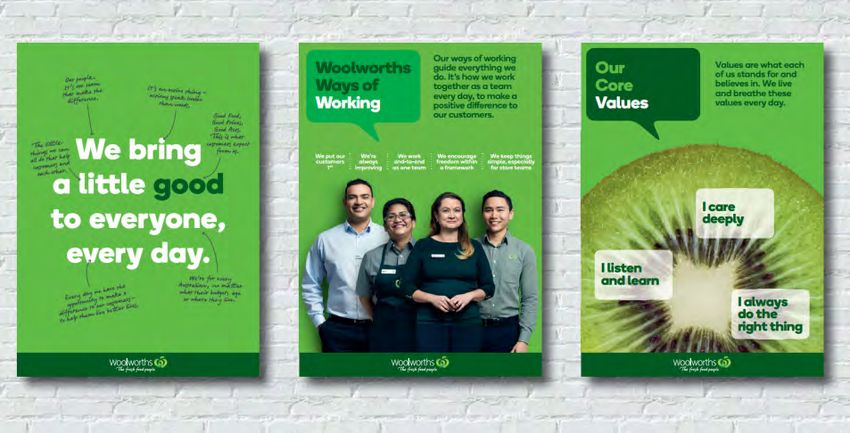
Woolworths Group FY18 priorities

                                                        6

                                       CUSTOMER 1ST TEAM AND CULTURE
Create competitive
advantage across                   CONNECTED, PERSONALISED AND CONVENIENT
                          5
Woolworths Group                   SHOPPING EXPERIENCES IN FOOD AND DRINKS

Innovate differentiated       TRANSFORM AUS         EVOLVE OUR        CREATE VALUE
customer propositions     2    AND NZ FOOD    3   DRINKS BUSINESS 4   IN PORTFOLIO

Engineer a lean                    E2E PROCESSES – ‘BETTER FOR CUSTOMERS’
operating model           1
                                          AND ‘SIMPLER FOR STORES’

  We create better experiences together
Outlook

•    FY18 focus will continue to be on our five key priorities
•    Emphasis moving from fixing the basics to leveraging team work, digital and insights
     to improve customer and team experiences while sustainably reducing CODB

•    In H1, we have a particular focus on improved team scheduling (right team member,
     right hours, right day), on-shelf availability and Store Pick up (for online orders)
•    In Australian Food, we don’t expect sales growth to continue at the same rate as
     achieved in Q4’17. Australian Food comp sales growth for the first eight weeks has
     been broadly in line with FY17 second half growth rate

•    We don’t expect an improvement in losses at BIG W in FY18. While we expect to see
     a positive customer response to lower prices, better product solutions and a better
     customer experience, it is still too soon to tell when this may translate into sales
     momentum and improved profitability

    Our Q1’18 sales release is currently
      scheduled for 31 October 2017

                                                                                            6
Contents

 Key highlights, progress and outlook   Brad Banducci

 Financial results                      David Marr
  Group financial results
  Key balance sheet metrics
  Cash flow summary
  Capital expenditure
  Capital management

 Business update                        Brad Banducci/David Walker

                                                                     7
FINANCIAL
RESULTS
Results – Full Year 2017

                                                  Continuing Operations                                               Total Group

Sales                                                    $55.5 bn                           3.7%                    $61.1 bn*          1.5%

EBIT                                                 $2,326.0 m                          (4.9)%                 $2,642.9 m*            n.m.

NPAT                                                 $1,422.1 m                          (3.6)%                   $1,533.5 m           n.m.

Earnings per share                                          110.8¢                       (5.1)%                          119.4¢        n.m.

Dividend per share                                                                                                            84¢      9.1%

Return on average
funds employed                                               22.3%                       61 bps                          25.0%         n.m.

Note: unless otherwise stated, all continuing operations results are compared to FY16 continuing operations before significant items
* Total Group sales and EBIT includes sales and EBIT from continuing and discontinued operations                                              9
n.m. not meaningful
Group EBIT

 $m                                            FY17       FY161    Change
 Continuing operations
 Australian Food                              1,603.1   1,642.0     (2.4)%
 Endeavour Drinks Group                        502.5      483.8      3.9%
 New Zealand Food (AUD)                        292.3      284.4      2.8%
       New Zealand Food (NZD)                  309.4      313.9     (1.4)%
 BIG W                                        (150.5)     (14.9)      n.m.
 Hotels                                        232.9      208.5     11.7%
 Central overheads                            (154.3)    (157.8)    (2.2)%

 EBIT continuing operations                   2,326.0   2,446.0     (4.9)%

 Discontinued operations – Home Improvement    159.0     (218.8)      n.m.
 Discontinued operations – Petrol              157.9      117.8     34.0%
 Group EBIT                                   2,642.9   2,345.0*    12.7%

* before significant items                                                   10
Key balance sheet metrics
Average inventory days ROFE
Days Percentage
Group ex Home Improvement and Petrol Group ex Home Improvement and Petrol
Group Group ex Home Improvement and Petrol – lease adjusted
41.3
22.3
40.8
21.7
40.4
39.9
39.3
39.0
38.3
38.0
13.3 13.1
36.6
36.4
FY13 FY14 FY15 FY16 FY17 FY16 FY17
Average inventory days from continuing operations Improvement in ROFE driven by working capital improvement
declined by 2.3 days during the year driven by despite marginally lower EBIT. Lease-adjusted ROFE
Australian and NZ Food and Endeavour Drinks marginally down (16bps) due to EBIT decline
Note: all numbers exclude significant items in FY16 11Strong improvement in free cash flow
Cash flow summary
$m FY17 FY16 Change
Operating activities before interest and tax 4,024.1 3,495.3 15.1%
Interest and tax (902.1) (1,137.8) (20.7)%
Operating activities 3,122.0 2,357.5 32.4%
Investing activities (1,431.4) (1,266.7) 13.0%
Financing activities - 107.9
Free cash flow before dividends and share issues 1,690.6 1,198.7 41.0%
Share issues/ other 55.5 -
Dividends (562.4) (1,217.2) (53.8)%
Free cash flow after dividends and share issues 1,183.7 (18.5) n.m.
Significant free cash flow improvement in FY17 due to
working capital and lower cash dividend payments
12FY17 Capital expenditure in line with guidance
$m FY17 FY16
Continuing operations
Operating capex 1,583 1,391
Property development 258 407
Gross capex 1,841 1,798
Property sales (273) (678)
Net capex 1,568 1,120
Discontinued operations – Home Improvement 23 108
Discontinued operations – Petrol 31 61
Group net capex 1,622 1,289
Operating capex – FY18E Operating capex – FY17 Operating capex – FY16
8% 9% 14%
24% 22%
28%
29%
$1.8 bn 34% $1.6 bn $1.4 bn
7% 27%
14%
13%
15% 9%
5% 16%
12% 14%
13Capital management
160 80 Dividend and DRP
Payout (%)
cents
Interim Final Payout (RHS)
140
• Full year dividend of 84 cps - a payout of
120 72 75
70.7% of Group NPAT attributable to
100
shareholders of Woolworths Limited
80 70
60 33 50
• H2’17 NPAT includes $134m for Home
40 65
Improvement which will not recur
67
20 44 34 • DRP discount of 1.5% retained for final dividend
0 60
FY15 FY16 FY17
Fixed charges cover ratio – continuing ops (x)
Debt and credit rating
3.1 2.4 2.4 • Reduction of $1.2bn in net repayable debt
• Discounted leasehold commitments unchanged
Net Debt $ bn
3.07 3.09 at ~$15bn
• FCCR for continuing operations unchanged
1.90 at 2.4x
• Remain committed to solid investment grade
credit rating
FY15 FY16 FY17
14Contents
Key highlights, progress and outlook Brad Banducci
Financial results David Marr
Business update Brad Banducci/David Walker
15BUSINESS UPDATE
Australian Food

                              FY17      FY161    Change
Sales ($m)                   36,371    34,798       4.5%

EBITDA ($m)                  2,164.7   2,165.6    (0.0)%

EBIT ($m)                    1,603.1   1,642.0    (2.4)%

Gross margin (%)              28.07     27.37     70 bps

Cost of doing business (%)    23.66     22.65    101 bps

EBIT to sales (%)              4.41      4.72    (31) bps

Sales per square metre ($)   16,213    16,000       1.3%

ROFE (%)                      166.1     133.4    32.7 pts

                                                            18
Our FY17 strategy was focused on having
customers put us 1st
6
CUSTOMER 1ST
TEAM AND CULTURE
Create the future 5 STEP-CHANGE STORE RENEWAL PROGRAM
Deliver on core
2 GOOD PRICES, 3 GREAT
4 BEST
customer offer RIGHT RANGE SERVICE FRESH
Fix the basics 1 SOLID AND EFFICIENT BUSINESS FOUNDATIONS
19Progress highlights
• Our purpose ‘We bring a little good to everyone, every day’ embedded within our team
Create the
• Around 600 support office team members attended our ‘Welcome to Woolies’ store induction program
future
• Opened 19 new Australian Supermarkets, renewed 72 existing stores and completed 85 upgrades
• Record Voice of Customer of 81 in June. Team sustainable engagement score of 82
• Metro and online experiencing high strong double digit growth rates
• Creation of WooliesX bringing our loyalty and digital teams together to provide a connected customer
experience
• Over 10 million Rewards members with dramatic improvements in program customer sentiment
Deliver on core • ‘That’s why I pick Woolies’ brand platform resonating with customers
customer offer • Strong progress on lowering shelf prices with over 3,500 SKU’s on Dropped & Always program
• A third of the way through Customer 1st ranging with positive customer feedback
• 27,000 team members completed service training, focusing on fast and warm checkout service
• Rebranding of own brand products as Essentials and Woolworths with launch of ‘Food, Glorious
Food’ campaign
• Over 2,000 of our own brand products now have a health star rating
• Substantial improvement in sustainable stockloss
Fix the basics
• Improvements in availability resulting in 1 million fewer gaps per week compared to FY16 but
more upside is possible
• Voice of Supplier metrics continuing to improve, with further opportunity
• Significant improvement in working capital days through better inventory management
• All 1,184 legacy v4 SCOs replaced
20Our success in FY17 has been underpinned by
improving our customer and team experiences
Overall Customer Satisfaction Voice of Team: sustainable engagement
% customers satisfied, 6 or 7 out of 7 % favourable scores, 6 or 7 out of 7
90 90 +5
+3 82
78 77
75
0 0
Jun-16 Jun-17 Jun-16 Jun-17
Queue wait times Availability Range of products
+7
80 79 80 +5 80 +4
75
75 72
75 73 75
71
70 70 68
70
0 0 0
Jun-16 Jun-17 Jun-16 Jun-17 Jun-16 Jun-17
21Sales momentum continues, with growth in visits
and more recently items per basket
Australian Food sales Comp transaction growth
(% year on year) (% year on year)
5.2
4.1
2.5 2.7
1.5
Q4 Q1 Q2 Q3* Q4*
7.2 FY16 FY17
5.6
4.0
Comp items per basket growth
1.7 (% year on year)
0.0
Q4 Q1 Q2 Q3* Q4* 0.8 0.6 0.4
FY16 FY17 (1.9) (2.0)
Comp Q4 Q1 Q2 Q3* Q4*
Sales (1.1) 0.7 3.1 4.5 6.4
(%) FY16 FY17
* Adjusted for the timing of Easter which fell in Q4’17 (Q3’16 LY)
22Brand platform ● An integrated brand platform launched in July 2017 ● Resonating with customers ● Emotional and rational reasons to Pick Woolies ● Building recognition ● Constantly evolving in line with customers’ needs
Our FY18 strategy:
From turnaround to transformation
                                                      6

                                               CUSTOMER 1ST
                                             TEAM AND CULTURE

  Scale-up the future
                               ACCELERATE RENEWAL AND EXTEND APPROACH TO
                        5
                                            ONLINE AND METRO

  Extend core
  customer offer                                 CONSISTENTLY
                            PRICES I TRUST
                                                    GREAT          FAMOUS
                        2   ON PRODUCTS      3                4
                                                   SHOPPING       FOR FRESH
                                I WANT
                                                  EXPERIENCE

  Excel on the basics
                             E2E PROCESSES THAT ARE ‘BETTER FOR CUSTOMERS’
                        1              AND ‘SIMPLER FOR STORES’

                                                                              24
Our culture is key to our future
25Endeavour Drinks
FY17 FY161 Change
Sales ($m) 7,913 7,589 4.3%
EBITDA ($m) 578.2 558.6 3.5%
EBIT ($m) 502.5 483.8 3.9%
Gross margin (%) 23.08 23.41 (33) bps
Cost of doing business (%) 16.73 17.03 (30) bps
EBIT to sales (%) 6.35 6.38 (3) bps
Sales per square metre ($) 18,039 17,943 0.5%
ROFE (%) 16.9 16.3 62 bps
27Dan Murphy’s maintained its leadership through
new stores and multi-channel innovations
FY17 highlights FY18 focus
12 net new stores opened, My Dan Murphy’s Click & Collect integration
bringing total fleet to 219 members now 2.4 million
Launch of talk show ‘At the Launch of high-end concept Next stage of Expand Dan Murphy’s
Cellar’ with Angela Pulvirenti cellar at original Prahran site My Dan Murphy’s Connections
Significant reduction in Successfully integrated 8 new store openings 40 refurbs planned
number of injuries Langton’s into Dan Murphy’s
Record NPS and VOC scores
28BWS investment in value and customer service
is resulting in strong convenience differentiation
FY17 highlights FY18 focus
Substantial improvement in Store network increased to Customer-led Ranging Partnering with Supermarkets
sales growth and comp sales 1,298 stores. Refurbished 173 and Woolworths Rewards
on FY16 stores (28 major, 145 minor)
Local craft beer range Click & Collect rolled out to
implemented in 550 stores 1,240 stores and local delivery
trialled in 50 stores
18 new store openings (gross) Digital retail, including
online delivery
Team engagement increased
to an all time high
Trained all 7,500 team
86
members on customer
experience and product
knowledge
Record VOC and NPS
29New Zealand Food
NZD FY17 FY161 Change
Sales ($m) 6,232 6,101 2.1%
EBITDA ($m) 426.8 429.9 (0.7)%
EBIT ($m) 309.4 313.9 (1.4)%
Gross margin (%) 24.00 23.58 42 bps
Cost of doing business (%) 19.04 18.44 60 bps
EBIT to sales (%) 4.96 5.14 (18) bps
Sales per square metre ($) 15,137 15,178 (0.3)%
ROFE (%) 10.5 10.3 21 bps
31New Zealand Food FY17 highlights and FY18 focus
FY17 highlights FY18 focus
Achieved new highs for Continued to deliver low Further enhance customer Continue focus on fresh food
team engagement and prices every day service experience including team knowledge
customer satisfaction and best practice
Store team
engagement 84%
Net Promoter Increased
+8 > 3,500 products
pts
Score
at low prices every day
Successfully launched new Rolled out tailored ranging Drive further online and Continue Customer-led
Onecard partnership with to meet local needs digital growth Ranging and focus capital
AA Smartfuel in October on store renewal
45 stores
completed to date
32PORTFOLIO BUSINESS
BIG W
FY17 FY161 Change
Sales ($m) 3,598 3,820 (5.8)%
(LBITDA)/ EBITDA ($m) (74.1) 68.2 n.m.
LBIT ($m) (150.5) (14.9) n.m.
Gross margin (%) 30.82 31.69 (87) bps
Cost of doing business (%) 35.00 32.08 292 bps
LBIT to sales (%) (4.18) (0.39) (379) bps
Sales per square metre ($) 3,396 3,602 (5.7)%
ROFE (%) (31.6) (2.3) (29.4) pts
34PORTFOLIO BUSINESS
We have put our customers at the heart of our planning process
Surveyed 5,000
customers and 10,000 Developed a clear Formulated a plan
team members on and simple to bring our CVP
what customers want customer value to life for
and how we can proposition (CVP) customers
do things better
Building the team with the experience and capability
to deliver on customer needs
35FY18 priorities: Building our team, regaining price trust
PORTFOLIO BUSINESS
CUSTOMERS AND TEAM COME FIRST
Win back trust for the
Our team and customers at the heart of everything we do
future
Listen to customers to refine
what we do and shape our UNIVERSES ALIGNED TO CORE CUSTOMER NEEDS
future Bring our universes to life in-store and revitalise our brand
Deliver what our
customers want (CVP) TRUSTED PRICES BETTER RANGE EASY EXPERIENCE
Give our customers more Lower prices across Brilliant basics, right Fresher stores,
reasons to come back the store without brands and quality better availability,
compromising product solutions service with a smile
on quality for customers
Fix the basics
Get the spine for our business DISCIPLINED WAYS OF WORKING
right – processes and training Stock availability, marketing process, direct sourcing critical path, online
improvement, labour rostering, streamline our reporting
36PORTFOLIO BUSINESS
Activate universes: Six universes aligned to core customer
needs
Multi-category solutions built around shopping themes
About About About About About About
Kids Home Everyday Him Her Leisure
The one-stop The essentials Low prices on Everyday Treat yourself For all your
shop for you need to your everyday essentials with the best off-duty
everything kids make your needs for men style essentials adventures
house a home and value
Destination Traffic driver Basket builder
37Better Range: Revised brand strategy and range architecture
PORTFOLIO BUSINESS
• Choice of brands and price points across all
Best customer universes with good-better-best
options where it matters most to customers
NATIONAL • National and exclusive brands/ranges to
BRANDS
NATIONA feature prominently in all universes
L
Better BRANDS
• Renewed focus on brilliant basics – quality
products at low prices across our entire range
EXCLUSIVE
BRANDS AND
RANGES • Customer First Ranging process to ensure
that brand strategy and range architecture for
Good each universe is mapped to customer needs
BRILLIANT BASICS
38We've started to make some changes…
PORTFOLIO BUSINESS
What we will do over the
What we have done so far
next 6 months
ü New BIG W leadership team in place Continue to reduce prices
ü Clear and simple plan agreed and shared Improve our online experience –
range, fulfilment
ü Prices taken down on more than 2,000 items
New in-store look – signage, key
ü Brand refresh started department relay
ü Value focused messages – in-store, catalogue Continue with brand refresh
ü Incremental changes in store
…But there is much
more to do
39Thank you
40Notes
1. Significant items in FY16 represent costs of $4,013.7m (before tax) or 2,627.8m (after tax and non controlling interests)
resulting from the write down of the Home Improvement business and certain significant expenses incurred outside the
ordinary course of our trading operations resulting from a Group wide review. There were no significant items in FY17.
41Disclaimer
This presentation contains summary information about Woolworths Limited (Woolworths) and its activities current as at the date
of this presentation. It should be read in conjunction with Woolworths’ other periodic and continuous disclosure announcements
filed with the Australian Securities Exchange, available at www.asx.com.au
This presentation has not been audited in accordance with Australian Auditing Standards.
This presentation contains certain non-IFRS measures that Woolworths believes are relevant and appropriate to understanding
its business. Refer to the Full Year Profit/(Loss) and Dividend Announcement for further details.
This presentation is for information purposes only and is not a prospectus or product disclosure statement, financial product or
investment advice or a recommendation to acquire Woolworths shares or other securities. It has been prepared without taking
into account the objectives, financial situation or needs of individuals. Before making an investment decision, prospective
investors should consider the appropriateness of the information having regard to their own objectives, financial situation and
needs and seek legal and taxation advice appropriate to their jurisdiction. Past performance is no guarantee of future
performance.
No representation or warranty, expressed or implied, is made as to the fairness, accuracy, completeness or correctness
of the information, opinions and conclusions contained in this presentation. To the maximum extent permitted by law,
none of Woolworths and its related bodies corporate, or their respective directors, employees or agents, nor any other person
accepts liability for any loss arising from the use of this presentation or its contents or otherwise arising in connection with it,
including, without limitation, any liability from fault or negligence.
This presentation may contain forward-looking statements including statements regarding our intent, belief or current
expectations with respect to Woolworths’ business and operations, market conditions, results of operations and financial
condition, specific provisions and risk management practices. When used in this presentation, the words ‘plan’, ‘will’,
'anticipate', 'expect', 'may', 'should' and similar expressions, as they relate to Woolworths and its management, are intended
to identify forward-looking statements.
Forward looking statements involve known and unknown risks, uncertainties and assumptions and other important factors that
could cause the actual results, performances or achievements of Woolworths to be materially different from future results,
performances or achievements expressed or implied by such statements. Readers are cautioned not to place undue reliance
on these forward-looking statements, which speak only as of the date thereof.
42
You can also read