Blueberries in the European Union - March 2016
←
→
Page content transcription
If your browser does not render page correctly, please read the page content below
MARKET ACCESS SECRETARIAT
Global Analysis Report

Blueberries
in the European Union

March 2016

EXECUTIVE SUMMARY                                                      CONTENTS
The market for fresh blueberries in the European Union (EU) is         Executive Summary ........................1
demonstrating strong growth in terms of imported products over the
last five years experiencing a compound annual growth rate             Trade Overview ...............................2
(CAGR) of 21.5% from 2010-14. Alongside rising disposable
incomes and health consciousness, the appeal of fresh blueberries          European Union Performance ...2
is quickly gaining ground.
                                                                              External European Union
In 2014, the EU imported US$285.3 million of fresh blueberries from           Trade .......................................2
the world, which was US$152.6 million more than the value
                                                                              Inter-European Union Trade ...3
recorded in 2010, representing significant growth. Although fresh
blueberry imports are on the rise and gaining market share, frozen         Canadian Performance ..............4
blueberries still accounted for over 60% of total EU blueberry
imports from the world with a value of US$431.5 million.               Blueberries in the European Union .5

Inter-EU trade of fresh and frozen blueberries in 2014 were            New Product Analysis .....................6
US$400.9 million and US$836.7 million, respectively. Both fresh
and frozen blueberries experience an increase in growth from           New Product Examples ...................8
2010-14 with CAGR’s of 20.4% and 6.9%, respectively.
                                                                       Standards ........................................9
Canada was the eight-largest non-EU supplier of fresh blueberries
with imports valued at US$2.6 million and the largest non-EU           For More Information .....................10
supplier of frozen blueberries with imports valued at
US$68.6 million to the EU in 2014.                                     Resources .....................................10

The European market saw the launch of 4,315 new products
containing blueberries within the 2011-2014 calendar years. An
additional 682 products with blueberries have already been
launched within the first eight months of 2015 across multiple
product categories.

The EU has a number of product specification standards for quality,
packaging and labelling that need to be met prior to importing fresh      Visit our online library of public
or frozen blueberries into the country.                                 reports for more information on this
                                                                                 and other markets.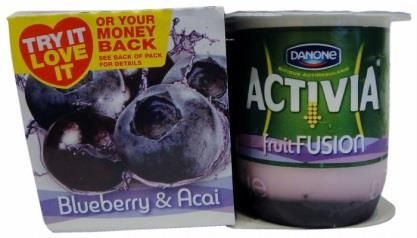
TRADE OVERVIEW
European Union Performance

External European Union Trade

The European Union (EU) is the second-largest importer, after the United States (U.S), of fresh
blueberries in the world. Their imports of fresh blueberries have seen steady growth over the last five
years reaching a value of US$282.3 million in 2014. EU imports of fresh blueberries increased by a
compound annual growth rate (CAGR) of 21.5% from 2010-14. In 2014, EU imports of fresh blueberries
came from only 30 countries signifying a very concentrated pool of suppliers. The top non-EU supplier
countries in 2014 were Chile with US$134.2 million or 47.5% of the market share, followed by Argentina
with US$54.8 million (19.4%), and Morocco with US$38.4 million (13.6%). Canada ranked as the EU’s
eight-largest supplier of fresh blueberries with US$2.6 million or 0.9% market share (Global Trade Atlas,
2015).

     EU Imports of Fresh Blueberries* from Top Ten Non-EU Supplying Countries, US$ Millions

                                                                                                                         CAGR %
Country                                       2010            2011           2012            2013           2014
                                                                                                                         2010-14
EU Total Fresh Blueberries                     129.67          166.74         188.09          206.88         282.30         21.47
1   Chile                                       51.62           62.68          82.61           96.00         134.18         26.98
2   Argentina                                   39.05           46.96          48.53           39.67          54.84          8.86
3   Morocco                                      9.53           15.66          20.02           24.28          38.46         41.76
4   South Africa                                 6.11            8.53          10.20           13.75          18.42         31.75
5   Peru                                         0.03            0.07           0.51            6.18          12.39        351.85
6   Uruguay                                     10.10           11.44          10.65           10.66          10.00         -0.25
7   United States                                5.84            5.57           6.46            7.09           4.73         -5.13
8   Canada                                       0.89            3.57           1.55            2.40           2.63         31.27
9   Mexico                                       0.08            0.03           1.02            0.86           2.19        127.03
10 Macedonia                                     0.55            0.41           0.17            0.52           1.10         18.80
Source: Global Trade Atlas, 2015                                       CAGR: Compound Annual Growth Rate
*Note: For the purposes of this report, the following HS code was used to define “fresh blueberries:” 081040. This includes fresh
cranberries as EU import data does not distinguish blueberries from cranberries.

In terms of imports of frozen fruit and nuts, which include blueberries, the EU was again the second-
largest importer in the world with $431.5 million, edged out slightly by the U.S. for the top spot. Their
supplier list is diversified with imports coming from 68 countries. The EU’s imports of frozen fruit and nuts
have experienced some fluctuation since 2011 where they peaked at over US$553.6 million. However,
since then, there has been a constant decline in imports which saw a decrease of 11.6% in 2014 over
2013 falling to just over US$431.4 million. Although the EU is experiencing a decline in their imports of
frozen fruit and nuts, Canada is still their top supplier and has been since 2011, with imports of
US$68.6 million or a market share of 15.9% in 2014. Other top non-EU suppliers of frozen fruit and nuts
were Serbia in second with imports valued at US$63.2 million, followed by Ukraine (US$50.2 million),
China ($35.6 million), and Chile (US$21.9 million). In 2014, the top five non-EU suppliers combined
accounted for over 55% of the available market share (Global Trade Atlas, 2015).

                                                                                                                         Page | 2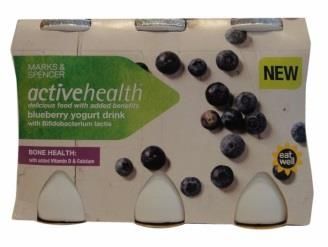
EU Imports of Frozen Blueberries* from Top Ten Non-EU Supplying Countries, US$ Millions

                                                                                                                          CAGR %
Country                                        2010           2011            2012           2013            2014
                                                                                                                          2010-14
EU Total Frozen Blueberries                    382.30          553.59         492.92          488.23          431.46          3.07
1   Canada                                      51.87           87.80          94.55           81.50           68.59          7.23
2   Serbia                                      60.37           82.99          71.89           77.87           63.18          1.15
3   Ukraine                                     52.34           67.38          51.30           46.01           50.20         -1.04
4   China                                       41.41           46.54          42.86           51.67           35.57         -3.73
5   Chile                                        9.80           20.24          21.14           24.57           21.91         22.28
6   Russia                                      10.61           35.70          23.86           17.32           21.20         18.90
7   Peru                                        10.33           13.54          17.73           14.68           17.40         13.92
8   Turkey                                      23.89           23.50          26.81           20.89           15.36        -10.46
9   India                                        7.37           10.64          11.02           11.89           14.14         17.71
10 Israel                                        7.56            6.59           9.39           11.38           14.12         16.92
Source: Global Trade Atlas, 2015                                        CAGR: Compound Annual Growth Rate
*Note: For the purposes of this report, the following HS code was used to define “frozen blueberries:” 081190. This includes all
frozen fruit as EU import data does not distinguish blueberries from other fruits.

Inter-European Union Trade
*This section will focus on inter-European Union (EU) trade for fresh and frozen blueberries. It is important to note that the numbers
in this section have the possibility of over representing the industry due to imports being double counted. This can occur when a
product is imported into a hub country— who initially records the imports— then the hub country send the product to another country
who then also records the product as an import.

In 2014, inter-EU trade for fresh blueberries was valued at just over US$400.0 million which was an
increase of almost US$150.0 million over 2013 alone. Over the 2010-14 period fresh blueberries grew by
a compound annual growth rate (CAGR) of 20.4%. The top three inter-EU importing countries were the
United Kingdom with 20.8% of total imports, followed by Germany with 17.2%, and the Netherlands with
13.7%. These three countries combined accounted for 51.8% of all inter-EU trade imports (Global Trade
Atlas, 2015).

     EU Imports of Fresh Blueberries* from Top Ten Inter-EU Supplying Countries, US$ Millions

                                                                                                                          CAGR %
Country                                        2010           2011            2012           2013            2014
                                                                                                                          2010-14
Total Fresh Blueberries                        191.01          258.11         290.61          354.85          400.92         20.37
1    United Kingdom                             60.26           85.57          96.30           90.01           83.47          8.48
2    Germany                                    26.04           40.68          41.88           62.99           68.97         27.57
3    Netherlands                                17.25           23.93          23.95           25.80           55.09         33.69
4    Italy                                      11.98           16.63          16.21           17.79           18.88         12.04
5    Lithuania                                   2.70            6.49          10.08           16.54           14.80         53.01
6    Belgium                                     6.65            8.70          11.60           15.43           19.07         30.15
7    France                                      6.30            9.91          10.49           14.70           15.82         25.90
8    Denmark                                    11.58           13.70          15.90           14.12           17.77         11.31
9    Sweden                                      5.88            9.24          10.67           11.71           15.88         28.20
10 Austria                                       4.30            5.36           4.20           10.41            7.34         14.32
Source: Global Trade Atlas, 2015                                       CAGR: Compound Annual Growth Rate
*Note: For the purposes of this report, the following HS code was used to define “fresh blueberries:” 081040. This includes fresh
cranberries as EU import data does not distinguish blueberries from cranberries.

                                                                                                                         Page | 3
Inter-EU trade of frozen blueberries was over double that of fresh blueberries each year from 2010-14,
although frozen blueberries experienced a decline in imports of US$38.2 million from 2013-14. This
decline could be a result of the increasing consumption trend towards fresh blueberries happening in the
EU. The top three inter-EU importing countries in 2014 were Germany with 19.8% of total imports,
followed by France with 13.1%, and Italy with 6.3%. In addition, the top five inter-EU countries combined
accounted for over 50% of the total market (Global Trade Atlas, 2015).
EU Imports of Frozen Blueberries* from Top Ten Inter-EU Supplying Countries, US$ Millions
CAGR %
Country 2010 2011 2012 2013 2014
2010-14
EU Total Frozen Blueberries 641.61 805.57 911.06 874.92 836.70 6.86
1 Germany 139.58 171.17 183.65 176.01 165.33 4.32
2 France 79.26 82.21 89.78 107.67 109.95 8.53
3 Italy 32.34 48.06 46.92 48.49 52.90 13.09
4 Belgium 38.31 50.26 57.04 56.34 51.26 7.55
5 Netherlands 42.00 55.20 58.25 47.40 40.99 -0.61
6 Sweden 33.12 39.59 38.77 41.18 35.06 1.43
7 United Kingdom 34.78 35.63 38.53 39.67 39.62 3.31
8 Austria 32.14 39.68 34.72 38.46 33.22 0.83
9 Poland 18.87 28.97 30.78 27.30 32.08 14.19
10 Finland 9.85 23.50 28.18 24.70 14.10 9.38
Source: Global Trade Atlas, 2015 CAGR: Compound Annual Growth Rate
*Note: For the purposes of this report, the following HS code was used to define “frozen blueberries:” 081190. This includes all
frozen fruit as EU import data does not distinguish blueberries from other fruits.
According to the Food and Agriculture Organization of the United Nations (FAOSTAT), in 2013 the
European Union’s (EU) production quantity for blueberries was 52,276 tonnes, while they imported over
263,000 tonnes of blueberries and exporting 85,460 tonnes in 2013 (Global Trade Atlas, 2015). This
means that, in 2013, the EU consumed roughly 229,830 tonnes of blueberries. The top five EU blueberry
producing countries in 2013 were Poland with 12,731 tonnes, followed by Germany (10,277 tonnes),
France (9,011 tonnes), the Netherlands (5,498 tonnes), and Spain (5,000 tonnes). These five countries
combined accounted for over 81% of the EU’s blueberry production (FAOSTAT, 2015). However, these
countries are not producing enough blueberries to fully meet the demands of EU consumers, resulting in
an increasing demand for imports from external EU countries.
Canadian Performance
*This section will focus on Canada’s exports of fresh and frozen blueberries to the EU as Canadian export data records export
values specifically for blueberries. As there are two different reporting sources used to gather EU imports (Eurostat) and Canada’s
(Stats Canada) exports there will be differences in values.
In 2014, Canada exported US$343.3 million worth of fresh and frozen blueberries to the world, with
68.2% going to the United States. The European Union (EU) was Canada’s second-largest export
destination, albeit with a significantly smaller proportion, receiving just 17.1% or US$58.8 million of fresh
and frozen blueberries exports, followed by Japan (7.9%). The top three EU countries that Canada
exported fresh and frozen blueberries to were Germany which received US$23.7 million, the Netherlands
(US$12.8 million), and France (US$8.3 million) (Global Trade Atlas, 2015).
The majority (98.9%) of blueberries exports to the EU from Canada were of the frozen variety. Canadian
frozen blueberry exports to the EU have experienced some wide fluctuations over the last few years, but
still managed to have a compound annual growth rate of 3.8% from 2010-14 (Global Trade Atlas, 2015).
Page | 4Canadian Exports of Fresh or Frozen Blueberries to the EU, US$ Millions
%
HS Code Description 2010 2011 2012 2013 2014 CAGR
2012-14
Total Fresh and Frozen Blueberries 51.63 88.75 87.27 59.67 58.81 3.31
Total Fresh Blueberries 0.99 2.53 0.30 1.63 0.02 -63.38
Fresh cultivated (highbush)
08104012 0.10 1.23 0.19 0.04 0.02 -36.07
blueberries
08104011 Fresh wild (lowbush) blueberries 0.89 1.29 0.11 1.60 0.00 -86.06
Total Frozen Blueberries 50.64 86.23 86.97 58.03 58.79 3.80
Frozen cultivated (highbush)
08119012 4.34 5.73 5.64 4.39 0.63 -38.25
blueberries
08119011 Frozen wild (lowbush) blueberries 46.31 80.50 81.33 53.65 58.16 5.86
Source: Global Trade Atlas, 2015
Canadian Exports of Fresh or Frozen Blueberries - Top Five EU Destination Countries,
US$ Millions
CAGR %
Country 2010 2011 2012 2013 2014
2010-14
EU Combined Total 51.63 88.75 87.27 59.67 58.81 3.31
Germany 20.38 33.10 33.07 23.94 23.67 3.82
Netherlands 10.75 21.14 18.05 10.78 12.83 4.52
United Kingdom 5.88 12.36 11.94 10.86 8.31 9.05
France 5.12 7.95 13.04 6.07 6.28 5.26
Belgium 5.94 7.03 5.37 3.97 4.14 -8.66
Source: Global Trade Atlas, 2015
An important factor that will positively impact Canadian blueberry exporters’ competitiveness is the EU is
the Canada-European Union Comprehensive Economic and Trade Agreement (CETA) which was
concluded in August 2014. Once CETA enters into force, (fresh/dried/sweetened/frozen) berries will see a
3.2% reduction in tariffs and will become duty-free. For more information on CETA, please visit the
following website: Canada-European Union Comprehensive Economic and Trade Agreement (CETA).
BLUEBERRIES IN THE EUROPEAN UNION
Blueberries in particular are native to North America and were only introduced into Europe in the 19th
century (BDN Maine, 2014). Blueberries can be categorized into one of two varieties: wild (lowbush) or
cultivated (highbush). The wild (lowbush) blueberry is one of just three commercially grown fruit crops
native to North America; the others being cranberries and Concord (American) grapes (BDN Maine,
2014).
Canada is one of the world’s largest producers of wild (lowbush) blueberries, which are mainly used for
processing and freezing, and is also a producer of cultivated (highbush) blueberries, which are usually
sold fresh because they are less perishable then their counterpart (AAFC, 2011). According to the Food
and Agriculture Organization of the United Nations (FAOSTAT), in 2013 the top three producing countries
of blueberries were the United States (239,071 tonnes), followed by Canada (109,007 tonnes) and the
European Union (52,276 tonnes).
Page | 5Wild (lowbush) blueberries have the highest antioxidant capacity per serving out of any widely available
cultivated fruits. United States Drug Administration (USDA) researchers found that a one-cup serving of
wild blueberries (85 calories) had more total antioxidant capacity than a serving of cranberries,
strawberries, plums, raspberries and even cultivated high bush blueberries (BDN Maine, 2014).
Blueberries are known as a “superfruit” because they possess certain characteristics that make them
superior to other types of fruits such as strawberries and raspberries. These characteristics include a long
shelf life, convenient, durable because they are not “squish prone” like strawberries and raspberries,
along with only needing minimal preparation—only washed—prior to consumption. Although blueberries
have achieved “superfruit” status, the price factor is stopping consumers from considering them as an
everyday fruit snack and they are only being viewed as a “treat”. This consumer view is expected to
reverse once blueberry production ramps up sufficiently to meet demand (Euromonitor International,
2014).
In terms of the EU, experts are predicting that demand and consumption of blueberries will see a
significant increase over the coming years as consumers begin to see the health benefits and
improvements in the quality and taste of blueberries (EUROFRUIT, 2014). The appeal of blueberries to
health-conscious consumers is tied to their extremely rich antioxidants properties, low calorie intake, high
in fibre and nutrient content, and that blueberries may contribute to heart health since they appear to act
as an anti-inflammatory and may also reduce blood cholesterol levels (AAFC, 2011). A trend in the EU
also affecting demand, in particular in the United Kingdom (UK) is the switch from blueberries being seen
as seasonal to being viewed as a year-round fruit (EUROFRUIT, 2014). Euromonitor is predicting that
fresh blueberry consumption in Western Europe is going to increase by a further 25% between 2015 and
2019, resulting in an increasing demand (Euromonitor International, 2014).
According to Euromonitor, in 2014, blueberries delivered double-digit volume growth in a number of
Western European markets, including Switzerland, Finland, the Netherlands, Denmark, Germany,
Norway, Sweden, the UK and Ireland. In order to meet European demands for blueberries, imports from
opposite hemispheres are needed to keep a stable supply throughout the year (Euromonitor International,
2014).
th
Of all the EU countries, the UK, despite already having a considerable blueberry market (the 10 -largest
globally), is expected to grow in volume by 76% through 2018. This substantial growth will be driven by
the UK consumers’ high level of openness to the “superfruit” message and the all-important factor of
convenience. While the UK’s volume consumption of blueberries continues to grow, there are a number
of EU countries, such as Spain, France and Italy, whose volume sales are still on the low side
(Euromonitor International, 2014). Canadian exporters could potentially take advantage of this by
increasing their exports to these countries.
NEW PRODUCT ANALYSIS
According to the Mintel Global New Products Database, there were 4,997 new food and drink product
launches in the European Union market containing blueberries between January 2011 and August 2015.
Germany, France and the United Kingdom were the most popular countries for products to be launched in
over the January 2011 to August 2015 period and saw 45.5% of the total launches. Almost half (44.7%) of
the launches were completely new products and 38.2% were new varieties or range extensions. The
most commonly used claim was “no additives or preservatives,” which appeared on 22% of the total
launches, followed by “organic” with 15.8% and “ethical – environmentally friendly packaging” with 15.2%.
Approximately 13% of the total launches were in the spoonable yogurt product subcategory and 7.3%
were confiture and fruit spreads. Over half of the product launches fell within the US$0.12-US$4.38 price
range.
Page | 6Number of New Product Launches Containing blueberries in the EU*, by Year and Feature
August
Feature** 2011 2012 2013 2014**
2015
Total launches 1,099 1,285 1,017 914 682
Top 5 countries
Germany 174 221 177 157 134
France 82 126 113 119 84
United Kingdom 184 322 168 102 107
Italy 101 97 86 60 65
Poland 51 38 45 60 23
Top 3 launch types
New variety/range extension 385 483 375 389 275
New product 586 588 438 348 274
New packaging 91 184 132 132 90
Top 5 claims
No additives/preservatives 279 257 237 188 140
Ethical: environmentally friendly packaging 154 146 168 166 124
Organic 203 157 147 148 136
Low/no/reduced allergen 133 133 130 123 107
Gluten-free 104 73 102 96 86
Top 5 subcategories
Spoonable yogurt 150 148 132 122 80
Tea 61 19 61 56 32
Juice 51 56 38 54 40
Confiture and fruit spreads 110 119 59 47 31
Dairy-based frozen products 53 33 46 40 37
Top 5 companies
Lidl 15 30 34 41 21
Danone 32 35 28 23 14
Marks & Spencer 4 23 17 23 12
Nestlé 12 19 11 17 10
Unilever 14 13 27 16 10
Price range in US dollars
$0.15 - $2.26 167 238 361 348 256
$2.27 - $4.38 240 254 305 322 227
$4.39 - $6.50 66 81 113 141 97
*Note: EU includes all but the following countries Bulgaria, Cyprus, Estonia, Latvia, Lithuania, Luxembourg, Malta, and Slovenia
because data is not collect from these countries.
**Note: The features analyzed above were ranked based on 2014 data.
Page | 7NEW PRODUCT EXAMPLES, 2015
Blueberry Acai Yogurt
Company: Danone
Brand: Danone Activia Fruit Fusion
Subcategory: Dairy
Launch type: New product
Price in US$: 3.35
Claims: Vegetarian, ethical - environmentally friendly package,
social media
Description: Danone Activia Fruit Fusion Blueberry & Acai Yogurt
comprises a layer of mouth-watering fruit combinations
topped with creamy yogurt. This vegetarian product
contains Bifidus ActiRegularis, a unique blend of five live
cultures, and is made with high quality milk. It retails in a
500g recyclable pack with 4 x 125g pots
Cheesecake with Blueberries
Company: Lidl
Brand: McEnnedy American Way
Subcategory: Chilled Desserts
Launch type: New product
Price in US$: 2.14
Claims: N/A
Description: McEnnedy American Way (Cheesecakes with
Blueberries) are layered with blueberry sauce, cream
cheese and biscuit crumbs. The product retails in a 200g
pack of 2 x 100g units.
Blueberry Yogurt Drink
Company: Marks & Spencer
Brand: Marks & Spencer Active Health
Subcategory: Drinking Yogurt & Liquid Cultured Milk
Launch type: New variety/range extension
Price in US$: 4.00
Claims: Added calcium, low/no/reduced fat, vegetarian,
vitamin/mineral fortified, bone health, ethical -
environmentally friendly package, weight and muscle
gain
Description:
Marks & Spencer Active Health Blueberry Yogurt Drink is
enriched with calcium and vitamin D and provides a
source of protein, which is needed to maintain growth in
muscles. Vitamin D helps the body to absorb calcium and
phosphorus, needed for building bones. This vegetarian,
fat free product is made with British milk and contains
Bifidobacterium lactis. It retails in a 600ml recyclable
pack containing six 100ml recyclable bottles.
Source for all: Mintel, 2015
Page | 8STANDARDS
Prior to exporting blueberries to the European Union (EU), exporters should consult the following
resources:
Quality
The quality of blueberries being exported to the EU, at a bare minimum, should be uniform in colour, have
similar varietal characteristics, be clean and free of vegetable material and have practically no unripe
berries. Fresh blueberry imports, in the EU, must comply with the marketing or equivalent standards (CBI,
2013). Please consult the below links for further information on the acceptable quality for blueberry
exports to the EU:
UNECE standards for berry fruits
General Marketing Standards of Regulations (EU) 543/2011
Codex Alimentarius ('Food code' of WHO and FAO)
Packaging
When packaging their product for export to the EU, exporters need to ensure that the packaging will
protect the blueberries from contamination, leakage, and dehydration (CBI, 2013). Consult the below link
for further packaging specifications:
FAO - packaging and transport of tropical fresh fruit and vegetables
Labelling
Consumer package labelling must comply with the rules and regulations applied in the EU and European
Free Trade Association (EFTA) market. A label cannot contain any toxic ink or glue and the following
items should be on the label of (pre-packed) fresh fruits (CBI, 2013 and Regulation (EU) No 1169/2011):
The name of the food;
List of ingredients;
Any ingredient or processing aid listed in Annex II or derived from a substance or product listed in
Annex II causing allergies or intolerances used in the manufacture or preparation of a food and
still present in the finished product, even if in an altered form;
The quantity of certain ingredients or categories of ingredients;
The net quantity of the food;
The date of minimum durability or the ‘use by’ date;
Any special storage conditions and/or conditions of use;
The name or business name and address of the food business operator;
The country of origin or place of provenance;
Instructions for use where it would be difficult to make appropriate use of the food in the absence
of such instructions;
With respect to beverages containing more than 1,2 % by volume of alcohol, the actual alcoholic
strength by volume;
A nutrition declaration.
In the case of frozen products the term “frozen” or “solid frozen” has to appear on the label; and
Any certification logo or retailer logo, in the case of private label products, should be on the label.
Consult the following links, for more detailed information on labelling requirements in the EU:
EU Directive 2000/13/EC replace by Regulation (EU) No 1169/2011 as of December 31, 2014.
This new regulation establishes the general principles, requirements and responsibilities
governing food information, and in particular food labelling (CBI, 2013).
Page | 9FOR MORE INFORMATION
International Trade Commissioners can provide Canadian industry with on-the-ground expertise
regarding market potential, current conditions and local business contacts, and are an excellent point of
contact for export advice.
Overview of Trade Commissioner Services in Brussels
http://www.tradecommissioner.gc.ca/eng/office.jsp?oid=140&cid=111
Find a Trade Commissioner
www.tradecommissioner.gc.ca/eng/find-trade-contacts.jsp
For additional intelligence on this and other markets, the complete library of Global Analysis reports can
be found under Statistics and Market Information at the following link, arranged by sector and region of
interest:
ats-sea.agr.gc.ca
For additional information on ANUGA 2015, please contact:
Ben Berry, Deputy Director
Trade Show Strategy and Delivery
Agriculture and Agri-Food Canada
ben.berry@agr.gc.ca
RESOURCES
Agriculture and Agri-Food Canada (AAFC): “Canadian Blueberries”, retrieved July 30, 2015 from:
http://www.agr.gc.ca/eng/industry-markets-and-trade/exporting-importing-and-buying-assistance/buy-
from-canada/canadian-blueberries/?id=1426167712421
BDN Maine Living: “Ten things you might not know about blueberries” – reprinted from Bangor Daily
News article on May 8, 2014, retrieved on July 30, 2015 from: http://bangordailynews.com/2014/08/05/
living/ten-things-you-might-not-know-about-blueberries/
CBI (2013) “Product Factsheet: Fresh berries in the European Market”, retrieved Aug 31, 2015 from:
http://www.cbi.eu/system/files/marketintel_documents/2013_pfs_fresh_berries_-_ffv.pdf
EUROFRUIT: “Blueberry demand rising in Europe”, retrieved July 30, 2015 from:
http://www.fruitnet.com/eurofruit/article/160963/blueberry-demand-taking-off-in-europe
Euromonitor International, March 2014: “Blueberries the Most Dynamic Fruit in 2013”
Euromonitor International, May 2015: “If Blueberries Can’t Be Seasonal and Local, They Must At Least
Be Ethical”
Food and Agriculture Organization of the United Nations (FAOSTAT) Statistics Division, Blueberry
production statistics, retrieved July 2015
Global Trade Atlas, July 2015
Mintel (2015) Global New Products Database
Page | 10Blueberries in the European Union
Global Analysis Report
Prepared by: Stephanie Clarke, Market Analyst
© Her Majesty the Queen in Right of Canada,
represented by the Minister of Agriculture and Agri-Food (2015).
Photo Credits
All photographs reproduced in this publication are used by permission of the rights holders.
All images, unless otherwise noted, are copyright Her Majesty the Queen in Right of Canada.
For additional copies, to request an alternate format, and for all other inquiries regarding this publication,
please contact:
Agriculture and Agri-Food Canada, Global Analysis
rd
1341 Baseline Road, Tower 5, 3 floor
Ottawa, ON
Canada, K1A 0C5
E-mail: infoservice@agr.gc.ca
The Government of Canada has prepared this report based on primary and secondary sources of
information. Although every effort has been made to ensure that the information is accurate, Agriculture
and Agri-Food Canada (AAFC) assumes no liability for any actions taken based on the information
contained herein.
Reproduction or redistribution of this document, in whole or in part, must include acknowledgement of
Agriculture and Agri-Food Canada as the owner of the copyright in the document, through a reference
citing AAFC, the title of the document and the year. Where the reproduction or redistribution includes data
from this document, it must also include an acknowledgement of the specific data source(s), as noted in
this document.
Agriculture and Agri-Food Canada provides this document and other report services to agriculture and
food industry clients free of charge.
Page | 11You can also read