2018 OMNICHANNEL BUYING REPORT - BIGCOMMERCE
←
→
Page content transcription
If your browser does not render page correctly, please read the page content below
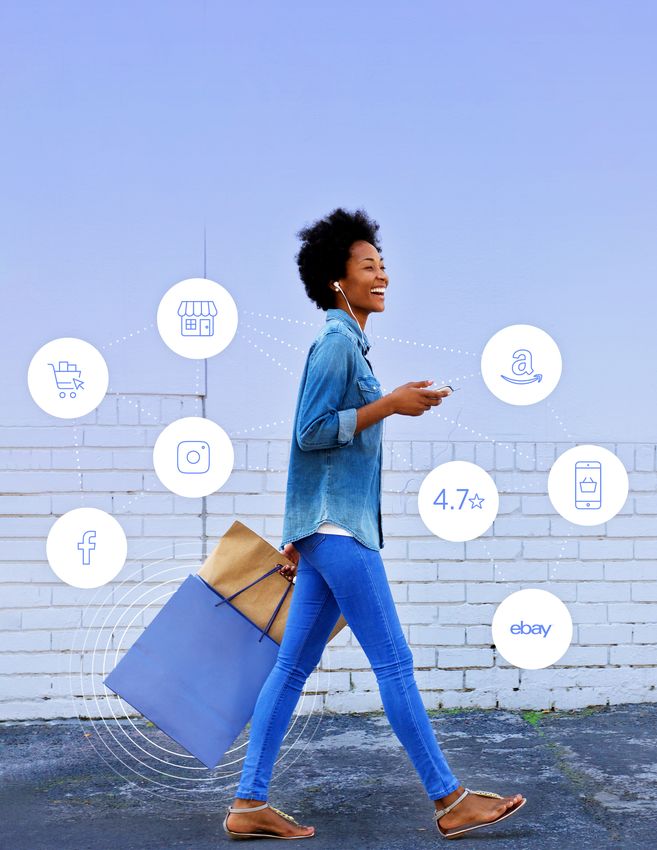
2018 Omnichannel
  Buying Report
How We Buy in 2018                                                                   Fast Facts

As the traditional consumer purchase journey continues to evolve, so
too should the way merchants think about their sales opportunities.
But where should merchants invest to take the most advantage of their
                                                                                One of every three dollars
consumers’ evolving buying preferences? BigCommerce conducted a                 of monthly discretionary
global survey of nearly 3,000 digital consumers to find out.                     income is spent online

Though respondents vary by age, income and region, one thing is for
certain: omnichannel retail, or the process of selling across multiple
physical and digital channels, is the new reality retailers must face.
Merchants need to take advantage of that growing opportunity or risk
being left behind.
                                                                                 Reading reviews is the #1
                                                                               behavior consumers engage
                                                                               in before making purchases
The consumer purchase decision journey is more                                           in store
omnichannel than ever
Recent reports indicate that 87% of all consumer spending in the U.S.
still occurs offline, but when you dig a little deeper, a more nuanced
story unfolds. Offline commerce may still dominate, but digital plays an
important role in consumers’ offline purchase decisions. Specifically,         The highest amount people
when asked about their shopping behaviors prior to making a purchase in        are willing to spend online,
                                                                                        on average
a physical retail store, 39% of digital consumers visited a brand’s website,
36% read customer reviews, 33% attempted to price match the product
online, with 32% finding the brand on Amazon.

How then do retailers effectively reach these hyper-connected consumers
in an increasingly competitive industry?

In short, by having an omnichannel sales strategy. Regardless of where
a final purchase occurs, it’s clear brands must now have a strategy that        53% of shoppers expect
                                                                                to return 1 out of every 4
                                                                                    online purchases

2    2018 Omnichannel Buying Report
encompasses an ever-expanding range of physical and digital channels where their consumers are shopping. Moreover, brands must now factor how their digital presence — including their website, content and social channels — serve to influence potential customers, even those shopping on marketplaces like Amazon. Does the brand website convey the product value and offer detailed reviews and product descriptions; is the brand’s social media presence compelling and does it offer high-quality lifestyle imagery; can the brand’s products (or similar products from a competitor) be purchased on Amazon; does it rank highly in search results? The answers to all of these questions influence where and how consumers ultimately choose to purchase. Remember, every interaction with a consumer is another opportunity to create brand awareness, and making the product available across all avenues of the shopping journey – from discovery to research to purchase – helps increase the likelihood that a consumer will buy no matter where they ultimately make the decision to do so. Need further proof? In the last six months, 78% of global respondents to BigCommerce’s survey made a purchase on Amazon, 65% in a physical store, 45% on a branded online store, 34% on eBay and another 11% Facebook. More than ever, consumers are shopping in a number of different places simultaneously, and brands need to adjust their digital strategy in tandem. Where Have Global Consumers Purchased From In The Last Six Months? 3 2018 Omnichannel Buying Report
Amazon and online stores are complementary channels
Pundits and consumers alike talk about the dominant role Amazon has
claimed within today’s retail landscape. And it’s true. With a market cap
nearing $1 trillion, Amazon owns a staggering 49% of online spend in the
U.S. –– roughly 5% of all U.S. retail sales.

In the last six months, 83% of U.S. consumers made a purchase on                 Percent of online spend
Amazon. Look specifically at the digital-first millennial generation in the      in the U.S. is owned by
                                                                                         Amazon
U.S., and that number jumps to 90%. There’s no denying: Amazon is an
integral part of all consumers’ shopping journeys.

Despite that, its non-stop growth doesn’t spell doom for other sellers; in
fact, it presents a significant opportunity.

Merchants that choose to treat Amazon as a sales channel are thriving.
According to the company’s 2018 Small Business Impact Report, 50% of
the items purchased on Amazon’s marketplace come from its third-party
sellers, more than 20,000 of whom surpassed $1 million in sales on the
platform last year.                                                             Percent of U.S. Millennials
                                                                              that have made a purchase on
                                                                              Amazon in the last six months
Consumers flock to Amazon as a destination to discover new products,
and in fact, 30% of consumers saw a brand on Amazon before ultimately
purchasing it on a brand’s website. Conversely, 22% of consumers visited
a brand site before purchasing it on Amazon, highlighting the complex
relationship Amazon sellers have with the marketplace and the constant
need to balance Amazon’s massive reach with the desire to elevate their
own brand presence in consumers’ consciousness.

Brands would be remiss to ignore the obvious connection between the
two. Increasingly, Amazon and a branded site work in tandem to ease a
consumer through their purchase decision journey, and brands should be
                                                                               Percent of items purchased
mindful of the role each play in the ultimate decision process – and use it      on Amazon come from
to their advantage by selling in both channels.                                    third-party sellers

4     2018 Omnichannel Buying Report
Conveying value alters price hurdles
Part of Amazon’s meteoric rise stems from the mentality that the marketplace
often provides the lowest-priced option for a given item. But the tables have
turned. Survey respondents no longer view price as the primary reason to
purchase on Amazon. For 28% of respondents, convenience reigns. Amazon
has become so good at creating a simple, frictionless purchase experience
that it no longer has to compete in a race to the bottom on price.
Interestingly enough, price did play an increasingly important
role in the consumer purchase decision elsewhere.
One-quarter of survey respondents listed price as the The #1 reason consumers
primary reason they choose to buy directly from a brand’s shop on Amazon is
site – a notable revelation given that, as a whole, brand sites
convenience,
do not maintain the same reputation as the low-price leader.
not price.
What is it about a brand’s website that encourages
consumers to see price as a differentiator?
Unlike third-party marketplaces or store shelves where products can be lost
amongst competitive noise, a brand controls the entire message on its own
site. This gives them an uninterrupted opportunity to use targeted product
imagery, descriptions, customer reviews and other complementary details to
better articulate product value, which plays an important role in a consumer’s
perception of price. A consumer that can see value clearly outlined is more
likely to view price as a positive, even when it is not the lowest option.
The ability to articulate value also comes into play when discussing returns.
Seventeen percent of survey respondents noted the bulk of their online
returns stem from the item they received not matching its original product
description. For retailers, particularly those offering free shipping and/or
free returns, a customer’s dissatisfaction with a product impacts the bottom
line. To decrease the percentage of returns that arise from unmatched
expectations, brands should provide clear product descriptions, imagery and
sizing guidelines to ensure customers understand exactly what they will be
5 2018 Omnichannel Buying Reportreceiving. It’s also worth considering the addition of customer reviews directly on the product detail
page to incorporate yet another opportunity for customers to get a true depiction of their potential
purchase.
While more work upfront, the ability to clearly articulate both product and brand value will pay
dividends down the road, as customers will be willing to pay for that value and less likely to go
through the effort of returns.
Amazon Prime nails it: why people pay annual fees
In its 2018 letter to shareholders, Amazon announced there are now more than 100 million Amazon
Prime members globally. The service, which offers myriad subscriber benefits for a seemingly
reasonable price of $120/year, has rapidly become a vital component of Amazon’s total brand
promise, providing unparalleled convenience and a host of value-add features for power shoppers.
Even more impressive than its rapidly-growing number of subscribers, Prime has completely
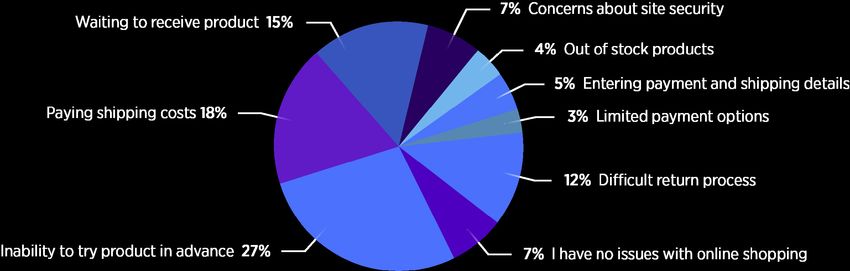
changed expectations of online shopping. Eighteen percent of survey respondents now cite
shipping costs as their least favorite aspect of online shopping, second only to an inability to touch
or try on an item before purchase (27%). Another 15% identify waiting for the shipment to arrive as
the worst part of the online shopping process.
What is your least favorite thing about making a purchase online?
6 2018 Omnichannel Buying ReportThis suggests that as Amazon Prime has grown in popularity, consumers have become
accustomed to its accompanying benefits, namely free and fast shipping, indicating
consumers increasingly expect all retailers – not just those selling through Amazon’s
marketplace – to offer similar benefits or risk losing sales.
The study findings also point out that in order to differentiate and avoid being displaced
by competitors, retailers are facing increased pressure to deliver Amazon-like experiences
to their consumers, specifically fast and/or free shipping. Given the high perceived value
digital consumers place on free and fast fulfillment, retailers will be best positioned by
investing in meeting this expectation, which in turn will reduce friction from the purchase
experience, as well as the likelihood consumers will look for alternatives.
Data collection concerns everyone – but convenience trumps privacy
With retailers now having the ability to measure more than ever before, data has
become the currency du jour of the digital economy. Its value to retailers has been well
documented, but there continues to be a relative lack of understanding of consumers’
perception of retailers’ attempts to measure and monitor their behaviors online.
The majority of survey respondents assume data collection is an expected part of the
online shopping experience, as evidenced by the fact three-quarters believe retailers
are collecting email addresses (82%), physical addresses (75%) and phone numbers
(74%). Another 56% believe online browsing history falls into the scope of a retailer’s
data collection and 25% of respondents believe retailers collect information on salary,
relationship status and profession.
Despite an awareness of these existing practices,
consumers are largely opposed to them. If given the
option, seven out of 10 consumers would opt out
7 out of 10
of sharing their data with retailers, even if it meant consumers would opt out
they could no longer receive special offers tailored to of sharing their data with
their specific interests. retailers if given the option.
This preference holds true regardless of age or household earnings.
7 2018 Omnichannel Buying ReportWhat does change when looking at generational differences is the role that incentives play in
consumers’ willingness to share data. Not surprisingly, 54% of Seniors (aged 73+) and 46% of Baby
Boomers (aged 54-72) would not share personal data with retailers regardless of the incentive
offered.
Gen X (aged 38-53), Millennials (aged 22-37), and Gen Z (aged 18-21), however, have a more
collaborative view. All three generations expressed a willingness to share personal data with
merchants in exchange for free shipping and/or product discounts.
If we think back to the previous section, both free shipping and product discounts harken back to
the ecommerce experience popularized by Amazon. Younger generations, those who grew up in
the Digital Age, value privacy – but not at the expense of convenience.
Armed with this knowledge, merchants should aim to incorporate elements of the Amazon
experience directly on site in an effort to appeal to a consumer’s preferences.
What Incentivizes Each Generation To Share Data With A Retailer?
Gen Z: 53% Free shipping
Millennial: 52% Product discounts & free shipping
Gen X: 48% Product discounts
Baby Boomer: 46% Nothing, I am not interested in sharing my data with a retailer
Seniors: 50% Nothing, I am not interested in sharing my data with a retailer
8 2018 Omnichannel Buying ReportCapitalizing on the in-store advantage
Omnipresent in all discussions of ecommerce growth is the concern of a pending “retail
apocalypse.” The ongoing closures of legacy big-box retailers generated increased
concern for many brick-and-mortar businesses.
That said, the physical store remains an important channel despite a visible growth in
ecommerce. On average, survey respondents still spend 69% of their discretionary
income each month in-store.
As we know, the inability to touch or try on an item prior
to purchase remains one of the primary reasons that The ability to try items in-store is
3x more
consumers dislike online shopping. Furthermore, the
ability to touch and try on items is 3x more influential
than other options in a consumer’s decision to make a
influential than other in-store
purchase in a physical store.
purchase considerations.
Moreover, merchants with both an online store and a
brick-and-mortar presence have a major opportunity to advance the sale. When it comes
to returning items purchased online, 50% of consumers mail the item back. But, when
consumers go into the store to return an item that was originally purchased online, 67%
browse or shop in that store afterwards. This is a major opportunity for brick-and-mortar
businesses to reclaim a portion of their lost sale – one that online-only brands do not have.
Brands should invest resources in further monetizing this opportunity. Updating marketing
materials within product packaging to tout a brick-and-mortar presence should returns be
needed, or using collateral surrounding the in-store returns area are both strong ways to
further encourage the customer to continue interacting with the brand in-store.
9 2018 Omnichannel Buying ReportGen Z shops differently, but not by much
Each time a new generation hits spending maturity, discussions ensue about their buying habits.
This holds especially true with those generations that came of age in a digital-first world, namely
Millennials and Gen Z. As it turns out, Gen Z shopping habits do have some unique characteristics
defined by their age – but as a whole, their behavior doesn’t differ that much from the rest of
consumers.
When it comes to making purchases, Gen Z respondents spend 8% more of their discretionary
income each month online than the global average – and tend to prefer online purchases to those
made offline. Only 56% of Gen Z consumers made a purchase in a physical store in the last six
months compared to 65% of all respondents.
Where it really gets interesting is when you look at the role social media played in Gen Z’s buying
behavior. Respondents from this generation were 2X more likely than the average consumer to
make a purchase on Instagram over the last six months, and 3X more likely to buy on Snapchat.
Taken a step further, Gen Z buyers, much like global consumers, sought recommendations from
friends and family prior to making a purchase in a physical store; unlike global consumers, 30%
of Gen Z buyers saw an ad about the product on social media, and 22% visited at least one of the
brand’s social channels prior to making an in-store purchase. Those behaviors were consistent prior
to purchasing on a brand’s website and Amazon.
Digital Influences of a Gen Z Shopper
The top 5 things that occurred prior to making an in-store purchase
35%
30%
25%
30% 34% 34% 36% 37%
Saw an ad on Attempted to Read customer Saw the brand Visited the
social media price match reviews on Amazon brand's website
10 2018 Omnichannel Buying Report
channels onlineThe online payment methods that matter
Today’s consumers have dozens of different payment methods at their fingertips, yet the bulk of
online shoppers stick to traditional payment methods like debit or credit cards. Even digital wallets,
which launched to great acclaim, have not taken off as anticipated – a mere 6% of online shoppers
prefer mobile wallets over other forms of payment. The tide could be turning, however, as younger
generations reach spending maturity. According to our survey respondents, Gen Z shoppers are
2X more likely to complete an online purchase using a mobile wallet like Apple Pay, Amazon Pay or
Google Pay than the average global consumer.
One method that has picked up steam is the idea of financing – often colloquially known as Buy
Now, Pay Later – which gives consumers the ability to pay for larger purchases over time rather
than all at once. Forty-five percent of global survey respondents indicated that the ability to
finance a purchase would influence their ultimate decision. For 36% of respondents, financing
enabled them to buy a more expensive option than they were previously considering, and another
31% of consumers would not have made the purchase otherwise.
Not surprisingly, Gen Z shoppers were 8% more likely than other respondents to be influenced by
the availability of financing, given that they likely have lower incomes to support their spending.
On the other end of the spectrum, only one-quarter (27%) of Baby Boomers or Seniors see the
availability of financing as influential.
All this goes to show that, while consumers do have payment preferences, maintaining a variety
of payment options still matters and failing to do so puts retailers at risk of alienating important
subsets of their audience.
How Does Financing Influence Your Decision To Buy?
40%
35%
30%
25%
29% 31% 36%
I bought more I would not have made I bought a more
than I would have a purchase otherwise expensive option
11 2018 Omnichannel Buying ReportOmnichannel What Is The Highest
Amount You Would
Around the World Spend On A Single
Online Purchase?
As expected, when looking across countries, consumers exhibit some
regional differences in the ways that they shop. As part of this survey,
BigCommerce explored the omnichannel shopping behaviors of digital
consumers in both the United Kingdom and Australia to see how they
United States
compared globally.
The State of UK Retail
Survey respondents in the UK demonstrated a similar desire to engage in
omnichannel buying behaviors, but vary in the channels of importance.
eBay remains a valuable purchase destination in the UK, with more than
half (57%) of survey respondents making a purchase on its marketplace United Kingdom
over the course of the past six months. Also noteworthy is the fact that
2X as many UK respondents made a purchase on Instagram as global
respondents, despite its shopping functionality only becoming available on
an international level this past March.
When it comes to making purchases on brand websites, convenience barely
beats out price as a primary influencer for UK buyers, at 26% and 24%
Australia
respectively. This compared to global results, where price proved slightly
more meaningful than convenience – 23% vs. 21%, respectively.
Unlike global consumers who disliked the inability to try a product in
advance, UK respondents believed paying for shipping costs to be the
worst part of online shopping (24%), followed by waiting to receive the
product (17%) and, finally, an inability to touch or try on the product (16%).
On a global level, survey respondents overwhelmingly preferred using
credit cards to pay for large online purchases, but when looking specifically
12 2018 Omnichannel Buying Reportat the UK, respondents confessed to using PayPal at nearly the same rate as
a credit card (40% to 41%, respectively).
Data privacy and the rights of UK consumers have been a central
conversation amongst UK residents and businesses alike, spurring the
creation of GDPR, or the General Data Protection Regulation, which
regulates the way in which businesses can use the data of UK residents.
of UK respondents are
Eighty percent of UK survey respondents expressed familiarity with GDPR, familiar with GDPR
though since being enacted in May 2018, only 23% have requested that
retailers remove their data from records.
All in all, UK consumers feel optimistic about the connection between
retailers and data – 69% of respondents believe that retailers are
respecting their right to privacy – and 45% of UK respondents would be
amenable to sharing personal data with retailers in exchange for
product discounts.
The State of Retail in Australia
Though Australian consumers still shop online, they do so at a lower rate
than the global average. In a typical month, Australian respondents spend of UK respondents have
requested retailers delete
approximately 26% of their discretionary income on online purchases – their data
five percentage points lower than the global average, and the lowest rate
of online spending of all three countries surveyed. Taken a step further,
Australian respondents said, on average, they would cap online spending at
$473, compared to a max of $922 in the UK and $798 in the U.S.
When they do make online purchases, respondents indicated that they
shop on mobile (39%) nearly as frequently as they shop on a desktop (41%),
and that they prefer PayPal to a credit card when making an expensive
purchase online, 54% to 28%.
While still a growing component of the overall buying mix, Australian
of UK respondents
consumers rely heavily on digital tools to aid their decision process. Nearly believe retailers respect
half (48%) of Australian respondents visited a brand’s website before their right to privacy
making a purchase in store, and another 28% read customer reviews about
the brand or product.
13 2018 Omnichannel Buying ReportInterestingly, TV plays a larger role in Australia than it does globally, with 31% of Australian respondents seeing a commercial about a brand prior to purchasing in store (compared to 25% globally). In contrast, price matching does not play as significant a role for Australian consumers. Regardless of channel, Australian respondents price matched at a lower overall rate than their global counterparts. Furthermore, Amazon, which only officially launched in Australia last November, doesn’t have nearly the same influence regionally as other sales channels – only 24% of Australian respondents made a purchase there in the last six months. eBay, on the other hand, is thriving in Australia. Sixty-three percent of local respondents made a purchase on the marketplace in the last six months, only two percent lower than the number of respondents that made a purchase in a physical store. Anecdotally, some Australian retailers have expressed concerns about the impact that the arrival of global brands like H&M and Zara are having on their consumer’s desire to purchase, but as it turns out, the fear is slightly overblown. Fifty-seven percent of Australian respondents do not think the presence of more global retailers will impact their decision to buy from local merchants. Though Australian consumers are aware retailers are collecting personal data, they seem less bothered by the practice. Only 58% of survey respondents indicated they would opt out of sharing data with retailers if given the option. This is nearly 12 percentage points lower than the global average. Similarly to other countries, Australian respondents view product discounts and free shipping as the best ways to incentivize data sharing. Where Have Australian Consumers Purchased From In The Last Six Months? 14 2018 Omnichannel Buying Report
Anecdotally, some Australian retailers have expressed concerns about the impact that
the arrival of global brands like H&M and Zara are having on their consumer’s desire
to purchase, but as it turns out, the fear is slightly overblown. Fifty-seven percent of
Australian respondents do not think the presence of more global retailers will impact their
decision to buy from local merchants.

Though Australian consumers are aware retailers are collecting personal data, they seem
less bothered by the practice. Only 58% of survey respondents indicated they would opt
out of sharing data with retailers if given the option. This is nearly 12 percentage points
lower than the global average. Similarly to other countries, Australian respondents view
product discounts and free shipping as the best ways to incentivize data sharing.

Adapting to new buyer behavior
Shifting buyer behaviors don’t have to be cumbersome for
merchants to adapt to, given their ecommerce provider
can support the payment gateways and omnichannel
                                                                       It’s important for merchants’
capabilities shoppers expect. As traditional consumer
                                                                       ecommerce tools to have
purchase journeys will continue to evolve, it’s important
                                                                       the ability to evolve.
for merchants’ ecommerce tools to have the ability to
evolve too. The key is to stay abreast of customer needs,
and be strategic about where to invest to make the most
out of today’s buying preferences.

Survey Methodology
This survey was conducted between August 2 – August 5, 2018 and was distributed to
online consumers at least 18 years of age via SurveyMonkey. Responses were collected
from 2,959 individuals living in Australia, the United Kingdom or the United States.

15   2018 Omnichannel Buying Report
For more insights and statistics
from the 2018 Omnichannel Study,
visit the BigCommerce blog.
16 2018 Omnichannel Buying ReportYou can also read