Nanoform Management Presentation - Online presentation and conference call

Page created by Alvin Wong
 
CONTINUE READING
Nanoform Management Presentation - Online presentation and conference call
Nanoform Management Presentation
Online presentation and conference call

August 26th - 2021, 15.00 Helsinki time

Nanoform is an innovative nanoparticle medicine enabling company. Nanoform
works together with pharma and biotech partners globally to provide hope for
patients in developing new and improved medicines utilizing Nanoform’s
platform technologies. The company focuses on reducing clinical attrition and on
enhancing drug molecules’ performance through its nanoforming technologies
and formulation services. Nanoform’s capabilities include GMP manufacturing,
and its services span the small to large molecule development space with a
focus on solving key issues in drug solubility and bioavailability and on enabling
novel drug delivery applications. Nanoform’s shares are listed on the Premier-
segment of Nasdaq First North Growth Market in Helsinki (ticker: NANOFH) and
Stockholm (ticker: NANOFS). Certified Adviser: Danske Bank A/S, Finland
Branch. For more information please visit http://www.nanoform.com
Nanoform Management Presentation - Online presentation and conference call
Disclaimer

Forward-Looking Statements

This presentation may contain forward-looking statements, including, without limitation, statements regarding Nanoform’s
strategy, business plans and focus. The words “may,” “will,” “could,” “would,” “should,” “expect,” “plan,” “anticipate,”
“intend,” “believe,” “estimate,” “predict,” “project,” “potential,” “continue,” “target” and similar expressions are intended to
identify forward-looking statements, although not all forward-looking statements contain these identifying words. Any
forward-looking statements in this presentation are based on management’s current expectations and beliefs and are
subject to a number of risks, uncertainties and important factors that may cause actual events or results to differ
materially from those expressed or implied by any forward-looking statements contained in this presentation, including,
without limitation, any related to Nanoform’s business, operations, clinical trials, supply chain, strategy, goals and
anticipated timelines, competition from other companies, and other risks specified in Nanoform’s prospectus published (on
May 22, 2020) in connection with Nanoform’s initial public offering (the “Prospectus”) under “Risk Factors” and in our other
filings or documents furnished to the Finnish Financial Supervisory Authority in connection with the Prospectus. Nanoform
cautions you not to place undue reliance on any forward-looking statements, which speak only as of the date they are
made. Nanoform disclaims any obligation to publicly update or revise any such statements to reflect any change in
expectations or in events, conditions or circumstances on which any such statements may be based, or that may affect the
likelihood that actual results will differ from those set forth in the forward-looking statements. Any forward-looking
statements contained in this presentation represent Nanoform’s views only as of the date hereof and should not be relied
upon as representing its views as of any subsequent date.

                                                                                                                                   2
Nanoform Management Presentation - Online presentation and conference call
Short introduction to Nanoform

                                 3
Nanoform Management Presentation - Online presentation and conference call
Nanoform in a Snapshot

                                                 Nanoform                                       Platform Technology
          The Share
                                  ➢ Global experts in Bulk
                                                      nanotechnology and                  ➢ CESS® technology for small
 ➢ Listed June 4th, 2020 on         drug particle engineering                               molecules (chemical
   Nasdaq First North Premier                      API                                      compounds) discovered in
   Growth Market in Helsinki                                                                2012
   and Stockholm                  ➢ ~110 employees and growing, 37 with
                                    PhD degree and 25 nationalities
                                                                                          ➢ Technology for large molecules
 ➢ Tickers: NANOFH and                                                                      (biological compounds)
   NANOFS                         ➢ Headquartered in Finland with additional                launched in 2020
                                    senior staff and board members in
                                    Denmark, Portugal, Sweden, UK and US
 ➢ Significant Nordic, European
   and US institutional                                                                   ➢ Nanoform’s clinical results
   ownership                      ➢ >3000m2 manufacturing site in Helsinki                  confirm value proposition to
                                    for nanoforming API’s                                   the pharma industry
 ➢ All press releases:
   https://nanoform.com/en/s      ➢ Strong balance sheet, EUR 88m in cash,
   ection/media/press-              no debt
   releases/

                                                     API = Active Pharmaceutical Ingredient
                                                     CESS® = Controlled Expansion of Supercritical Solutions                 4
                                                     GMP = Good Manufacturing Practice
Nanoform Management Presentation - Online presentation and conference call
Low bioavailability is the key issue

Poor bioavailability and low efficacy most common reasons for drug failure                  Majority of new drugs suffer from poor solubility
                                                                                                                                Solubility
Reasons for drug failure in pre-clinical trials (share of molecules)

                                                                                                                     High                         Low
45%

40%

35%                                                                                                                  Class I1                 Class II1
                                                                                                                  On market: 35%             On market: 30%

                                                                                                           High
30%
                                                                                                                  New drugs: 5-10%       New drugs: 60-70%

25%

                                                                                                                                                                  70-90%

                                                                                            Permeability
20%         39%
                                                                                                                                                                     of new drugs
15%                          30%                                                                                                                                      are poorly
                                                                                                                                                                        soluble
10%
                                                                                                                    Class III1                Class IV1
                                             11%

                                                                                                           Low
 5%                                                           10%          10%                                    On market: 25%             On market: 10%
                                                                                                                  New drugs: 5-10%       New drugs: 10-20%
 0%
            Poor          Low efficacy   High toxicity   Adverse effects   Others
        bioavailability

 ➢ Nanoform can enhance the pharma industry output by targeting poorly soluble drugs

                                                                           Source: GlobalData 2009, Cutting Edge Water-based Nanotechnology in Drug Development (Reasons for drug
                                                                           failure); Nikolakakis & Partheniadis (2017), Self-Emulsifying Granules and Pellets: Composition and Formation
                                                                           Mechanisms for Instant or Controlled Release (Share of poorly soluble drugs)
                                                                                                                                                                                           5
                                                                           1) Classification of drug substance according to Biopharmaceutics Classification System (BCS)
Nanoform Management Presentation - Online presentation and conference call
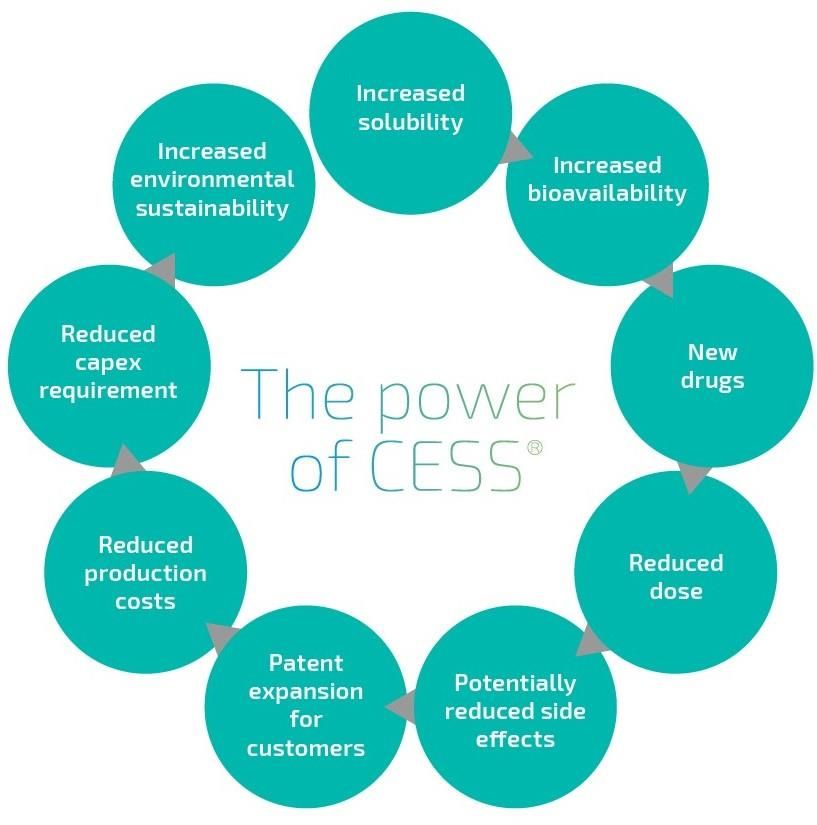
Nanoform is here to fill the gap

        The solution to low bioavailability is to decrease the particle size of the
                        Active Pharmaceutical Ingredient (API)

          Giving
       unsuccessful
     drug candidates                     Improving                                     Enabling new
     a second chance                   existing drugs                                     drugs

      >58 000 failed                      >5 800                                    >18 000 drugs in
     drugs in the last                existing drugs*                                development*
        40 years*

       Nanoform’s CESS® is the only technology that can manufacture nanoparticles
             without solvents, excipients and complex production processes

                                  API = Active Pharmaceutical Ingredient
                                  CESS® = Controlled Expansion of Supercritical Solutions              6
                                  *Source: Nanoform and Pharmaprojects® | Informa, 2021
Nanoform Management Presentation - Online presentation and conference call
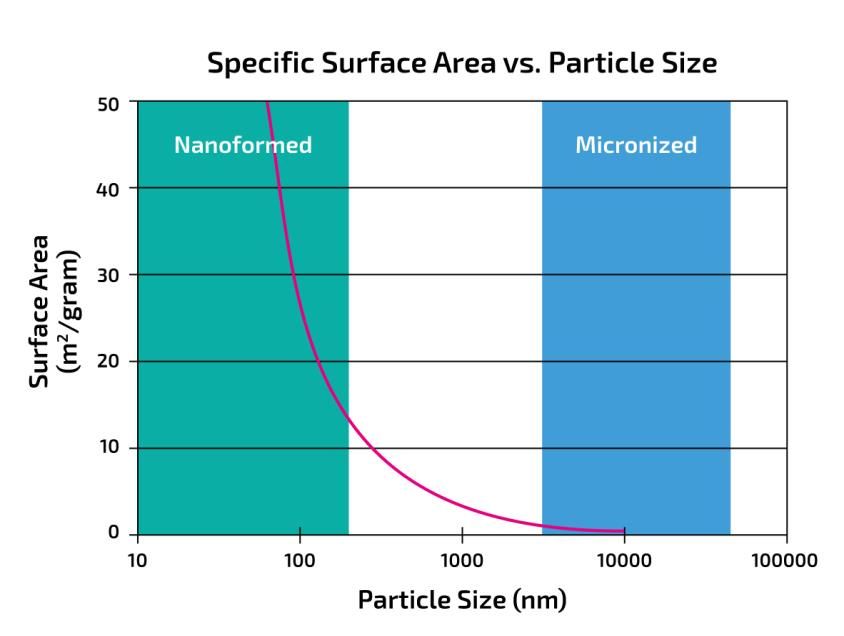
Particle size is key

Smaller particle size can improve a drug’s bioavailability

                                                                                       Pre-nanoforming                      Post-nanoforming

                                                                               ➢ Smaller particles have a larger surface area
                                                                               ➢ Larger surface area of particles enables better bioavailability of a
                                                                                 drug
➢ The surface area increases 30 fold from a 10 micron1 sized particle          ➢ Improved bioavailability implies better absorption of a drug by the
  once the particle size is reduced to 100nm                                     body’s circular system
➢ Reduction of particle size down to 50nm increases the surface area by        ➢ CESS® can produce API with large surface areas which can
  1,000 fold                                                                     significantly improve the bioavailability of drugs

                   ➢ CESS® produced nanoparticles have a larger surface area and as such improved bioavailability

                                                       Source: Company information
                                                                                                                                                        7
                                                       1) 1 micron = 1,000nm
Nanoform Management Presentation - Online presentation and conference call
Small is powerful®

                     CESS® = Controlled Expansion of Supercritical Solutions   8
Nanoform Management Presentation - Online presentation and conference call
Nanoforming a potential game-changer in Biologics too

                                     Drug
            Improving                                   Tailored
                                   loading
             delivery                                   release
                                 capacity in
              route                                     profiles
                                formulations

                                                      Implementing
                                Enabling new              lighter
            Improving
                                    drug              infrastructure
             uptake             combinations             for drug
                                                         logistics

                        Source: Company information                    9
Nanoform Management Presentation - Online presentation and conference call
Nanoform the stars that will shine
the brightest with…

 ➢   Enables in silico experiments in large
     quantities, creating fast predictions of
     which molecules should be nanoformed

 ➢   Helps pharma partners to pick suitable
     drug candidates for further development
     from their large libraries

 ➢   Applicability in drug discovery,
     development and in lifecycle management
     for existing marketed drugs

                                                10
Logarithmic growth

                                   1 Million
                                  evaluations
                                   per week
                                                 Expert knowledge +
                 1000
                                                 Artificial Intelligence
              evaluations                                    ↓
               per week
                                                         Growth
              Starmap2.0
               launched
    10
evaluations
 per week

   2020         2021                2025

                                                                           11
Market overview

                  12
Global pharma market projected to reach USD 1.6tn by 2025

 Global medicine spending 2010-2025E (USDtn)                            Global prescription drug sales from top 100 products (USDbn)

  1.8
                                                            $1.6tn
                                                                         400
  1.6
                                                                                                                         357
  1.4                                                                    350
                                                                                                                 306
  1.2                                                                    300
        $0.9tn                                                                          262
  1.0                                                                    250

  0.8                                                                    200

  0.6                                                                    150

  0.4                                                                    100

  0.2                                                                     50

  0.0                                                                      0
                                                                                        2010                     2018   2024E

  ➢ Significant market potential in improving the properties of existing drugs

                                                Source: IQVIA Institute for Human Data Science; EvaluatePharma                         13
The structural pharma R&D problem

Less than 50 drugs approved in the US annually on average…                                  …while the global pharma industry R&D expenditure exceeds $180B

Annual number of novel drug approvals by FDA 2010-2020                                       Global pharmaceutical R&D spending 2010-2026E (USDbn)
                                 Chemical              Biologics
60                                                                                             250
                                                                                                                                                                                            233
                                                                                                                                                                                      227
                                                                                                                                                                                221
                                                                                                                                                                          211
50                                                                  17                                                                                              202
                                                                                                                                                              195
                                                                                               200                                                      188
                                                                                                                                                181 186
                                                                           10     20                                                      168
40                                                        12                                                                        160
                                            12
                                                                                                                          145 150
                    6             11                                                           150          137 136 138
                                                                                                      129
30
             6             2
                                                                                               100
20                                                                  42
      6                                           7                        38
                    33                      33            34                      33
                                  30
             24            25                                                                   50
10
      15                                          15

 0                                                                                                0
     2010   2011   2012   2013   2014   2015     2016    2017      2018   2019   2020

➢ A game changer in particle design is needed to improve R&D yield

                                                                    Source: U.S. Food and Drug Administration (FDA); IQVIA Institute for Human Data Science                                  14
Global drug R&D pipeline size and growth

                                                                                                                                                                                        18,582
                                                                                                                                                                                         drugs
             20,000
                                                                                                                                                          2016-2021 growth
                                                                                                                                                           36% (6.3% p.a.)
                                                                                                                                                                                    17,737
             17,500
                                                                                                                                                                           16,181

                                                                                                                                                                  15,267
                                                                                                                    2011-2016 growth                     14,872
             15,000                                                                                                  41% (7.1% p.a.)
Drug count

                                                                                                                                                13,713

                                                                                                                                       12,300
             12,500                                                           2006-2011 growth
                                                                               31% (5.6% p.a.)                                11,307
                                                                                                              10,452 10,479
                                      2001-2006 growth                                        9,737   9,713
             10,000                                                                   9,605
                                       24% (4.3% p.a.)                        9,217

                                                                      7,737
                                                      7,360   7,406
              7,500                           6,994
                                      6,416
                      5,995   6,198

              5,000
                       2001 2002 2003 2004 2005 2006 2007 2008 2009 2010 2011 2012 2013 2014 2015 2016 2017 2018 2019 2020 2021
                                                                                                      Year

                                                                                                                                         Source: Pharmaprojects® | Informa, 2021                 15
Global number of companies with active pipelines

                                                                                                                                                                                       5,099
                6,000                                                                                                                                                                companies

                                                                                                                                                            2016-2021 growth
                                                                                                                                                             38% (6.7% p.a.)
                5,000                                                                                                                                                             4,816

                                                                                                                                                                          4,323
Company count

                                                                                                                                                                  4,134
                                                                                                                         2011-2016 growth                 4,003
                4,000                                                                                                     51% (9.1% p.a.)
                                                                                                                                                  3,687

                                                                                                                                          3,286
                                                                                2006-2011 growth
                                                                                 46% (7.9% p.a.)                                  2,984
                3,000
                                                                                                                 2,705    2,745
                                    2001-2006 growth
                                                                                                         2,387
                                     36% (4% p.a.)
                                                                                                 2,207
                                                                                         2,084
                                                                                 1,965
                2,000                                                   1,769
                                                1,576   1,620   1,633
                                        1,503
                        1,198   1,313

                1,000
                         2001 2002 2003 2004 2005 2006 2007 2008 2009 2010 2011 2012 2013 2014 2015 2016 2017 2018 2019 2020 2021

                                                                                                                                          Source: Pharmaprojects® | Informa, 2021            16
Global drug development by phase, 2021

                              Other* 10%

            Phase III 6%

       Phase II 15%
                                                                                  Preclinical 55%

           Phase I 14%

                *Launched and in development (7%), Pre-registered (1%), Registered (1%) and Suspended & N/A (1%)

                                                                                         Source: Pharmaprojects® | Informa, 2021   17
Global clinical drug development phase trends, 2007-2021
                                          152%

             12000

                            +182%          10738

             10000

              8000
Drug Count

              6000

                     3803
                                                        +152%                           +102%
              4000

                                                                      2676                                2747

              2000                                                         1360
                                                                                                                          +131%
                                                 1060
                                                                                                                                              1029
                                                                                                                 446

                 0
                            Preclinical                 Phase I                          Phase II                            Phase III

                                                                  2007-2021 per phase

                                                                                                    Source: Pharmaprojects® | Informa, 2021     18
Distribution of R&D companies by HQ country/region, 2021

                                                Germany 2%
                                    France 3%
                                                             C & S America/Africa 1%
                               Japan 3%
                          Canada 4%
                        UK 5%

                 China 9%
                                                                          USA 46%

         Rest of Asia Pacific 13%

                        Rest of Europe 14%

                                                                         Source: Pharmaprojects® | Informa, 2021   19
Share of pipeline contributed by top 10 companies, top 25 companies and
companies with just 1 or 2 two drugs, 2011-2021

                                             Top 10             Top 25              Cos with 1 or 2 drugs
                        25

                        23

                        21
                                                                19.61    19.6    19.74
                                                                                           19.26       19.38                   19.36
                                                18.32   18.96                                                       18.7
  % of total pipeline

                        19   18.33   18.33

                        17                              16.48
                                     17.9      17.93            15.72
                             14.77                                       14.89
                        15
                             13.38                                               13.5
                        13                      12.14                                      11.95
                                     11.49              11.42
                                                                                                       11.01
                        11                                       10
                                                                          9.6                                       9.47        9.36
                        9                                                        8.22
                                                                                            7.21
                        7                                                                              6.45
                                                                                                                    5.4         5.27
                        5
                             2011    2012       2013    2014    2015     2016    2017      2018        2019        2020         2021

                                                                                            Source: Pharmaprojects® | Informa, 2021    20
Nanoform Business Model

                          21
Simplified value chain

High level overview of Nanoform’s value chain and business model

                                                                        Bulk
                                                                        API

                                                              Launch of new drugs,
                                                           improving existing drugs &
                                                            reducing clinical attrition

                  Clients                                                                                                   Revenue
         ➢ Global large pharma                                     Nanoformed                                        ➢ Fixed fee’s per project
         ➢ Mid-sized and specialty
           pharma                                                     API                                            ➢ Royalty as a % based on
                                                                                                                       drug sales or supply price
                                                                                                                       per kg
         ➢ Biotech

                ➢ Nanoform nanoforms APIs for the pharma and biotech industry using its patented CESS ® technology

                                                           API = Active Pharmaceutical Ingredient
                                                           CESS® = Controlled Expansion of Supercritical Solutions                                  22
                                                           GMP = Good Manufacturing Practice
Revenue drivers and industry attrition rates

 Nanoform pre-clinical and clinical revenue drivers                                                Global Pharmaceutical industry’s pre-clinical and clinical success rates

                                                                                                                                           NME                    Biologic                Non-NME    1)
                 Non-GMP                                    GMP
                                                                                                            100%
                                                                                                                                                                                                90%
                                                                                                                                                                                             88%
                                                      > Attrition between previous                           90%
                                                        and current phase
                                                                                                                                                                                        78%
                                                                                                             80%
                                                      > Price per phase per API                                                                                                  74%
                                                                                                                                             70%
             > Total # of active                      > Time lag between                                     70%                          66%
  Proof of     customers                                previous and current                                                           61%
                                           Phase I,
  Concept                                               phase                                                60%                                                             57%
             > # of APIs per customer      II & III
   (PoC)                                              > # of customers with
             > Price per PoC per API                                                                                                                              48%   49%
                                                        505(b)(2) strategy                                   50%
                                                      > Proportion of new drug
                                                                                                             40%          37%
                                                        candidates and 505(b)(2)                                                                           34%
                                                        APIs
                                                                                                             30%      25%                              26%
                                                                                                                                                                                                                  23%
                                                                                                             20%

                                                      > # of drugs on the market
                                                                                                             10%                                                                                               4%
                                                        using CESS®                                                                                                                                       2%
                                                      > License fee & royalty level                           0%
             > Attrition between PoC and                per drug                                                     Pre-clinical to    Phase I to      Phase II to      Phase III to    NDA/BLA to       Initial phase
  Proof of     PoP                         Drugs on   > Net revenues per drug                                           Phase I 2)       Phase II        Phase III        NDA/BLA         Approval        to Approval
  Process    > Price per PoP per API         the      > Time lag Phase II and
   (PoP)     > Time lag between PoC and     market      market (505b2)
               PoP                                    > Time lag Phase III and
                                                                                                    Timeline
                                                        market                                      (years)          Pre-clinical       Phase I          Phase II        Phase III        Approval           Total
                                                      > Speed of uptake on                          New drugs             ~1-4              ~2               ~2              ~3-4             ~1             ~9-13
                                                        market
                                                                                                    Existing drugs          -          Clinical development for 505(b)(2) ~2-5                ~1              ~3-6

                                                        Source: Company information; Takebe, Imai & Ono (2018), Clinical and Translational Science (11) (Pre-clinical to Phase I); Biotechnology Innovation Organization,
                                                        Biomedtracker and Amplion, Clinical Development Success Rates 2006-2015 (Clinical success rates); Kaur, Sharma & Sharma (2014), Journal of Drug Delivery and
                                                        & Therapeutics (4) (Timeline); The Pharmaceutical Journal, Drug Development: The Journey of a Medicine from Lab to Shelf (Timeline); Camargo Pharmaceutical         23
                                                        Services, Understanding the 505(b)(2) Approval Pathway (Timeline); 1) Non-NMEs often use 505(b)(2) pathway to gain FDA approval, source: Biotechnology
                                                        Innovation Organization, Biomedtracker and Amplion 2) Academic drug discovery, NME consisting only of small molecules
Nanoform - Attractive revenue model

 Predictable revenue streams through capitalizing the entire pharmaceuticals value chain

     Phase            Proof of Concept / Proof of Process                       Phase I – III trials                          Drugs on the market

 Certification                     Non-GMP                                            GMP                                             GMP

                 ➢ Proof of concept study - assessment of the    ➢ API for clinical trials are manufactured in   ➢ Drugs that have passed the trials and
                   possibility to nanoform a specific API          Nanoforms GMP facility                          reached commercialization

                 ➢ Proof of process study - definition of        ➢ Supply of material for customers’ Phase I,    ➢ In practice, if a company has taken its drug
                   parameters to establish the optimal process     II and III trials                               through Phase II trials, it is difficult to
  Description      and controls for a specific API                                                                 switch manufacturer
                                                                   ➢ Nanoform gets paid regardless of the
                                                                     outcome of the trials
                                                                                                                 ➢ Significant potential from patent extension
                                                                                                                   (505b2 projects) of drugs already on the
                                                                                                                   market offering near-term revenues

                            Fixed fee per project                            Fixed fee per project                 Royalty as a % based on drug sales or
   Revenue
                       Estimated project fee of EUR 50-500k            Estimated project fee of EUR 0.5-10m                 supply price per kg
    model                       per API per project                             per API per phase                         Estimated royalty fee of 1-20%

  ➢ Attractive business model with diversified risk profile due to not having to carry the cost & risk of drug development or being
    dependent on a single drug

                                                                                                                                                                  24
Highlights

       KPI’s and Financials

Near and mid-term business targets

                                     25
Nanoform highlights year-to-date (2021)

                                     Letter of intent for the development,
                                                                                                7 new clients
              Strong                manufacturing, and commercialization
                                                                                            3 new collaborations
         clinical results         of a by nanoforming improved version of a
                                                                                           1 new co-development
                                        current blockbuster drug signed

                                                                                            4 new non-GMP lines
 Q2 gross margin jumped to 95%              8 new customer PoC
                                                                                            commissioned in 1H
  as revenue grew by 185 % p.a.           projects started in 1H21
                                                                                              taking total to 12

                                           New raised 'mid-term
                                                                                          Headcount increased
        STARMAP® v2.0                    business targets for 2025’
                                                                                        from 74 to 106 during 1H
           launched                    announced in conjunction with
                                                                                     (37 PhD’s and 25 nationalities)
                                             CMD June 4, 2021

                                                                                          Capital raise for Biologics
     2 'near-term business               Commercial team expanded
                                                                                             Strong balance sheet
        targets achieved'                    in US and Europe
                                                                                            (€88m cash, no debt)

                                                      PoC = Proof of Concept
                                                                                                                        26
                                                      GMP = Good Manufacturing Practice
                                                      CMD = Capital Markets Day
2021 YTD Key milestones
        Nanoform set a new near-term business target for 2021: “At least 12
                                                                                March   Dr Chris Worrall appointed VP Business Development US (San Diego)
 Jan    new non-GMP customer projects and at least one new GMP customer
        project in 2021”
                                                                                        Near-term business target “At least 3 new non-GMP lines in 2021”
                                                                                March
 Jan    Nanoform’s clinical study indicates positive interim results                    achieved in Q1

                                                                                        Nanoform and Aprecia collaborate to advance 3D printed
        Herantis Pharma signed as a client for Biologics Proof of Concept       April
                                                                                        Nanomedicines
 Feb    projects and near-term target “First commercial Biologics PoC project
        signed in 2021” achieved
                                                                                        Nanoform’s final clinical results (Unicorn study) confirm value
                                                                                May
                                                                                        proposition to the pharma industry
 Feb    East Coast US Biotech client signed
                                                                                        Nanoform and a US listed metabolic pharmaceutical company
                                                                                May     collaboration signed
 Feb    Additional positive interim results from Nanoform’s Clinical Study

                                                                                May     Nanoform and Celanese explore ways to enhance drug delivery

 Feb    Dr Jamie Unwin appointed Commercial Insights Officer (Oxford)

                                                                                May     US biotech client signed
        Nanoform sets a new near-term business target: “At least 3 new non-
 Feb
        GMP lines in 2021 and 2 new GMP lines in 2022”
                                                                                June    Nanoform raised its mid-term business targets for 2025
        Nanoform and Nacuity Pharmaceuticals Sign Technology Proof of
March
        Concept (“PoC”) Agreement for Two Ophthalmic Drug Candidates
                                                                                        Letter of intent signed with a European headquartered international
                                                                                June    company for the development, manufacturing, and commercialization
March   European biotech client signed                                                  of a by nanoforming improved version of a current blockbuster drug

        Nanoform launches next-generation STARMAP® v2.0, the AI-based           July    Global major pharma client signed
March
        drug candidate selection tool for CESS®

March   Nanoform raised additional funds for accelerated growth                 July    Master Services Agreement signed with Boehringer Ingelheim

                                                                                                                                                              27
Clients, Collaborations and Co-developments

 Client announced 2019                                                                                                 Nanoform targets to achieve scale in APIs

 Client announced 2020                                                                                                    1     Global large pharma
                                    UK                          Tier 2 – Mid-sized
                                respiratory
                                                                  and specialty
 Client announced 2021
                                  biotech
                                                               pharma and biotech                                              ✓ Financially stable organizations
                                                                                                                               ✓ Broad pipeline of APIs in development
                                                                                              UK
                                                                                                                                Mid-sized and specialty pharma
 Collaboration
 announced 2021
                                        US Major
                                        Pharma
                                                                                            biotech
                                                                                                                          2     and biotech companies
                      Orion
                                                             Tier 1 – Global                              West

 Co-development
                                                              large pharma                                Coast
                                                                                                           US                  ✓ Ability to add more significant value
 announced 2021
                                               Astra
                                              Zeneca
                                                                              Global
                                                                              Major
                                                                                                         biotech
                                                                                                                               ✓ Fast supplier approval process
                                                                             Pharma
                                                                                                                       Technology added value to clients and collaborations
      Herantis                                                                                           European
      Pharma                                                                                           International
                                                                                                         company
                               Global
                               Major
                              Pharma
                                                    Global
                                                    Major
                                                                     Boehringer                                         ✓      Enabling new products
                                                                     Ingelheim
                                                   Pharma              (MSA)
         East Coast                                                                                           US
         US Biotech                                                                       Celanese          biotech
                                                                                         Corporation
                                                                                                                        ✓     Addressing solubility & bioavailability challenges

                          Nacuity
                         Pharmac.                                            US listed
                                                                             metabolic
                                          European
                                           Biotech             Aprecia
                                                                              pharma
                                                                                                                        ✓     Broadening & deepening the customer’s pipeline

                                                                                                                                                                              28
Nanoform Q2 2021 KPI’s

Financial    KPI’s
   Financial KPIs                                                                                   Operational KPI’s
EUR thousand                4-6/2021    4-6/2020    1-6/2021    1-6/2020    1-12/2020   1-12/2019                               4-6/2021       4-6/2020 1-6/2021       1-6/2020       1-12/2020 1-12/2019

Revenue                          546         191         824         342         687          49
                                                                                                    Number of new projects
                                                                                                    started during the period
Gross profit                     518         159         761         262         497        -323

Gross margin                    95%         83%         92%         77%         72%         neg.
                                                                                                      Non-GMP                              2          1            8              5        10         2

EBITDA                        -4,358       -6,348     -8,283     -10,485     -18,196      -6,900
                                                                                                      GMP                                  0          0            0              0         0         0
Operating loss                -4,841       -6,622     -9,203     -10,987     -19,423      -7,344

Loss for the period           -5,340       -6,758     -9,610     -11,345     -19,441      -7,554

Basic EPS (EUR)                 -0.07       -0.14       -0.14       -0.23       -0.35      -0.19    Number of lines (end of
                                                                                                    the period)
Net debt                     -82,563     -69,751     -82,563     -69,751     -54,156      -3,640
                                                                                                      Non-GMP                         12              7        12                 7         8         4
Net debt excluding lease
                             -88,120     -74,101     -88,120     -74,101     -59,977      -6,626
liabilities
                                                                                                      GMP                                  1          1            1              1         1         0
Investments in property,
                              -1,798        -514      -2,658        -838       -2,336     -1,804
plant and equipment

Operative free cash flow      -6,156       -6,863    -10,941     -11,322     -20,532      -8,704

Cash and cash equivalents                                                                           Number of employees (end
                              88,120      75,155      88,120      75,155      61,025       7,303                                     106             55       106            55            74       43
(end of period)                                                                                     of the period)
Nanoform Q2 2021 Income Statement

Consolidated    statement
Consolidated statement      of comprehensive
                       of comprehensive income income                                      1-6/2021 comments
EUR thousand               4-6/2021 4-6/2020 1-6/2021 1-6/2020 1-12/2020 1-12/2019
                                                                                           ➢ Revenue stemmed from 16 different customer projects in 1H21 (7 projects in
Revenue                        546      191       824      342       687           49       1H20). Revenues are recognized over the lifetime of the projects, based on
                                                                                            hours worked. In 1H21 revenue grew 141% compared with 1H20.

Other operating income                    14                27         27        231       ➢ The gross profit and margin jumped to EUR 761 thousand and 92% in 1H21
                                                                                            compared with EUR 262 thousand and 77% in 1H20. The operating loss
                                                                                            improved to EUR -9.2m from EUR –11.0m (1H20 included 4.6m in IPO related
                                                                                            costs). Financial costs in Q2 includes EUR 0.3m from repayments of BF loans.
Materials and services          -28      -47      -63     -107      -216        -603
Employee benefits           -3,693    -4,609   -6,453   -7,551 -12,526       -4,359        ➢ Headcount increased to 106 (55 end of 2Q20).
Depreciation,
amortization and                                                                           ➢ Cash position was EUR 88.1 million (EUR 75.2 million).
                              -483     -274      -920     -502   -1,226         -444
impairment losses

Other operating                                                                            Other operating expenses
                            -1,183    -1,898   -2,591   -3,195   -6,168      -2,218
expenses
                                                                                                                        4-6/2021 4-6/2020 1-6/2021 1-6/2020 1-12/2020 1-12/2019

                                                                                             Premises expenses               31       14        52       28      106       66
Operating loss              -4,841    -6,622   -9,203 -10,987 -19,423        -7,344
                                                                                             IT expenses                    152       77      234       140      309      202
                                                                                             Marketing and
Total finance income and                                                                                                    136       55      290       137      427      312
                              -498     -135      -405     -358        -15       -209         communication expenses
expenses
                                                                                             Consultant and
                                                                                                                            272    1,124      624     1,898    2,884      858
                                                                                             professional fees
Loss before tax             -5,339    -6,758   -9,609 -11,345 -19,438        -7,554          Travel expenses                 18         8       37       65      100      269
                                                                                             Voluntary personnel
                                                                                                                            149      128      384       205      532      304
                                                                                             related expenses
Income tax                       -1                -1                  -4
                                                                                             R&D expenses - external        169      430      539       614    1,357       28
                                                                                             Other expenses                 256       63      439       107      453      180
Loss for the period         -5,340    -6,758   -9,610 -11,345 -19,441        -7,554          Total                        1,183    1,898     2,591    3,195    6,168    2,218

                                                             Source: Company information
                                                                                                                                                                             30
Number of non-GMP lines and started customer PoC projects

                                                                                                                                                  ">70 new API's
                                                                        20                                                                           per year"
 20        Number of new Proof of Concept (PoC)                                             Number of non-GMP manufacturing lines by
           customer projects started - per quarter                                          end of period (cumulative)
                                                                                   70
                                                             18
           Number of new Proof of Concept (PoC)                                             New Proof of Concept (PoC) customer
           customer projetcs started - cumulative                                           projects (FY/H1)
                                                                                   60
                                                                                                                                                  "21-28
                                                                                                                                                    non-
 15
                                                                                                                                                    GMP
                                                                                   50                                                              lines"
                                                                                                                                      "At least
                                                   12                                                                                  12 new
                                                                                                                                      API’s in
                                                                                   40                                                  2021"
                                                                                                                           “At least 3
 10                                                                                                                        more non-
                                         9
                                                                                   30                                     GMP lines in
                                                                                                                             2021”
                               7                                                                                          (11 or more
                                                                                                                            in total)
                     6                                   6                         20

 5                                                                                                                  12
                 4                                                                                          10
                                                                                   10                   8                 8
                                               3
                                                                                           4
       2   2                         2                              2                           2
                           1                                                        0
                                                                                          FY 2019      FY 2020      H1 2021         Near-term       Mid-term
 0                                                                                                                                   business       business
      Q4 2019   Q1 2020   Q2 2020   Q3 2020   Q4 2020   Q1 2021    Q2 2021                                                        targets (2021) targets (2025)

                                                                  GMP = Good Manufacturing Practice                                                                31
Nanoform near-term business targets (re-iterated)
           Topic                                Target                                           Status

      GMP Approval           “GMP approval expected no later than Q3 2020”                Achieved - GMP certificate
                                                                                             awarded April 2020             ✓
  Ongoing Client Intake
                          “For 2020, our ambition is to accelerate our growth by
                               winning more new customers than in 2019”
                                                                                        Achieved – 4 new customers
                                                                                               by July 2020                 ✓
    First GMP Project        “Start of first GMP project before year end 2020”
                                                                                    Achieved – First GMP campaign started
                                                                                               in October 2020              ✓
      Clinical Trials                “First dosing in humans in 2021”
                                                                                      Achieved – First dosing in humans
                                                                                         announced December 2020            ✓
        Biologics         “First commercial Biologics PoC project signed in 2021”
                                                                                       Achieved – First Biologics PoC
                                                                                      agreement signed February 2021        ✓
  Non-GMP Line Capacity           “At least 3 new non-GMP lines in 2021”
                                                                                    Achieved – 3 new non-GMP lines ready
                                                                                                 in Q1 2021                 ✓
                          “At least 12 new non-GMP customer projects
   Customer Projects       and at least one new GMP project in 2021”
                                                                                           New target - Jan 4

   GMP Line Capacity                 “2 new GMP lines in 2022”                            New target – Feb 26

                                       GMP = Good Manufacturing Practice                                                        32
                                       PoC = Proof of Concept
Nanoform mid-term business targets 2025 (re-iterated)
- New raised targets were announced June 2th, 2021

                                   35 lines
    >70                             of which
  new APIs                          7-14 are
                                                                             200-250
                                                                              employees
  per year                            GMP
                                   compliant

                    >90%                             Cash flow
                     gross                            positive
                    margin

                                                        API = Active Pharmaceutical Ingredient   33
                                                        GMP = Good Manufacturing Practice
A Selection of Nanoform Institutional Shareholders1

                       1) Latest ownerhsip data can be found at https://nanoform.com/en/ownership-structure/   34
Q&A

                               www.nanoform.com

San Diego - Chicago - New York - Lisbon - Oxford - Cambridge - Stockholm - Helsinki

                                                                                      35
FURTHER ENQUIRIES

CFO Albert Hæggström
albert.haeggstrom@nanoform.com
+358 29 370 0150

Director of Investor Relations Henri von Haartman
hvh@nanoform.com
+46 7686 650 11

FINANCIAL CALENDAR

November 25, 2021 - Interim Report for January-September 2021
February 22, 2022 – Full Year 2021 Report
You can also read