Investor and Analyst H1 2012 Conference Call - Essen, 14 August 2012 Peter Terium Chief Executive Officer Rolf Pohlig Chief Financial Officer - RWE AG
←
→
Page content transcription
If your browser does not render page correctly, please read the page content below

Investor and Analyst
H1 2012 Conference Call

Essen, 14 August 2012

Peter Terium            Rolf Pohlig       Stephan Lowis
Chief Executive         Chief Financial   Vice President
Officer                 Officer           Investor Relations

Forward Looking Statement
This presentation contains certain forward-looking statements within the meaning of the US federal securities laws. Especially all of the
following statements:
Projections of revenues, income, earnings per share, capital expenditures, dividends, capital structure or other financial items;
Statements of plans or objectives for future operations or of future competitive position;
Expectations of future economic performance; and
Statements of assumptions underlying several of the foregoing types of statements
are forward-looking statements. Also words such as “anticipate”, “believe”, “estimate”, “intend”, “may”, “will”, “expect”, “plan”, “project”
“should” and similar expressions are intended to identify forward-looking statements. The forward-looking statements reflect the
judgement of RWE’s management based on factors currently known to it. No assurances can be given that these forward-looking
statements will prove accurate and correct, or that anticipated, projected future results will be achieved. All forward-looking statements
are subject to various risks and uncertainties that could cause actual results to differ materially from expectations. Such risks and
uncertainties include, but are not limited to, changes in general economic and social environment, business, political and legal
conditions, fluctuating currency exchange rates and interest rates, price and sales risks associated with a market environment in the
throes of deregulation and subject to intense competition, changes in the price and availability of raw materials, risks associated with
energy trading (e.g. risks of loss in the case of unexpected, extreme market price fluctuations and credit risks resulting in the event that
trading partners do not meet their contractual obligations), actions by competitors, application of new or changed accounting standards
or other government agency regulations, changes in, or the failure to comply with, laws or regulations, particularly those affecting the
environment and water quality (e.g. introduction of a price regulation system for the use of power grid, creating a regulation agency for
electricity and gas or introduction of trading in greenhouse gas emissions), changing governmental policies and regulatory actions with
respect to the acquisition, disposal, depreciation and amortisation of assets and facilities, operation and construction of plant facilities,
production disruption or interruption due to accidents or other unforeseen events, delays in the construction of facilities, the inability to
obtain or to obtain on acceptable terms necessary regulatory approvals regarding future transactions, the inability to integrate
successfully new companies within the RWE Group to realise synergies from such integration and finally potential liability for remedial
actions under existing or future environmental regulations and potential liability resulting from pending or future litigation. Any forward-
looking statement speaks only as of the date on which it is made. RWE neither intends to nor assumes any obligation to update these
forward-looking statements. For additional information regarding risks, investors are referred to RWE’s latest annual report and to other
most recent reports filed with Frankfurt Stock Exchange and to all additional information published on RWE's Internet Web site.
RWE AG | H1 2012 Conference Call | 14 August 2012 22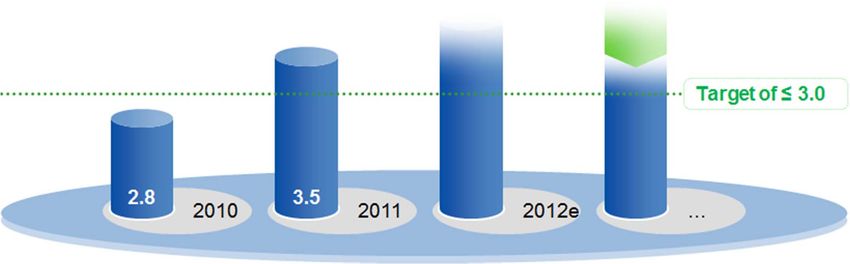
Today’s Agenda

A
    Peter Terium
    Strategy update, H1 2012 highlights and group outlook 2012

B
    Rolf Pohlig
    H1 2012 group results, divisional performance and outlook 2012

                                                  RWE AG | H1 2012 Conference Call | 14 August 2012   333
Main messages

   H1 2012 operating performance: EBITDA +9%, operating result +9%,
   recurrent net income on last year’s level

   Completion of hybrid bond programme – € 2 billion in total volume (in several
   currencies) achieved

   Confirmation of A3 (negative outlook) by Moody‘s; downgrade to BBB+
   (stable outlook) by Standard & Poor’s

   Successful settlement of gas price review with Statoil

   Sale of 24.95% stake in Berliner Wasserbetriebe for € 618 million

   Confirmation of guidance for FY 2012

                                                        RWE AG | H1 2012 Conference Call | 14 August 2012   44
Key priorities for next 12 – 24 months
Disposal Gas supply Efficiency
programme contracts enhancement
> Divestments of up to > Completion of > 2012 programme on
€ 7 billion by the end gas price reviews track to be completed
of 2013 envisaged for 2013 > Measures of new
> Majority of sales at the latest programme fully
processes underway > Structural solutions identified
> Disposal of 19% in to eliminate gas-to-oil > “RWE 2015” is laying
VSE (GER) closed spread the foundation for
> Agreement for sale of > Renegotiations further efficiencies
Berliner Wasserbe- continue for remaining post 2014
triebe signed contracts with
combined volume
of 11 bcm
RWE AG | H1 2012 Conference Call | 14 August 2012 55RWE’s journey over the next 5 years
> Cornerstones of strategy remain
> Adjust execution of strategy to changing
framework conditions
No further nuclear ambitions with
existing operations phasing out
Continued expansion of renewables
including position in photovoltaic
> Increasing partnerships to reduce risks and
leverage capital base
> Disciplined investment approach: operating
cash flow to cover dividends and capex by
2014/15 at the latest
RWE AG | H1 2012 Conference Call | 14 August 2012 66RWE 2015 – four action fields to align RWE with
changing market environment
Strategy > Identify opportunities of energy market transformation
> Align execution of strategy to changing market
environment
Structures/ > Eliminate structural and operational duplications and clarify
Roles interfaces
> Establish European generation company
Functional > Drive efficiency enhancements and operational excellence
Excellence > Realise efficiencies of € 1 bn by 2014 compared to 2012
Cultural > Align management and employees across all parts of RWE
Change > Foster high performance culture
RWE AG | H1 2012 Conference Call | 14 August 2012 77Efficiency programme well on track and stepped up
Cumulative operating result contribution of the programme compared to 2006
In € million Upgrade August 2011
1,500
of € 100 million
> 900
700 Upgrade February 2011
450 of € 200 million
100 200 Original programme
2006 – 2012
of € 1,200 million
2007 2008 2009 2010 2011 2012
> Efficiency programme of € 1.2 billion 2006 to 2012 stepped up by € 200 million in February 2011
and another € 100 million in August 2011 to a total of € 1.5 billion
> Additional efficiency measures by optimising cost for services and materials in our overhead
functions and project costs. Introduction of new IT systems in UK
> Fully accretive to operating result (i.e. post cost inflation and one-off cost of programme)
RWE AG | H1 2012 Conference Call | 14 August 2012 88Further efficiency enhancements of € 1 bn initiated
In € million € 1 bn programme now
backed bottom-up by
operational measures
1,000 Several hundred individual
~250 measures across the whole
250 RWE group
750
Reduced IT-spending
Programme includes
~300 c. € 300 m from workforce
Staff reduction reduction in 2013/14
Fully accretive to operating
~450 result (i.e. post cost inflation
Other cost reductions and one-off cost of
and efficiency improvements programme)
2013 2014 Total
RWE AG | H1 2012 Conference Call | 14 August 2012 99Outlook for 2012 confirmed
In € million
8,460 In the order of 2011
EBITDA
5,814 In the order of 2011
Operating
result
Recurrent 2,479 In the order of 2011
net income
2011 2012e
After further disposals1
Dividend € 2.00/share Pay out ratio of 50% – 60% of recurrent net income
1 No major earnings dilution effect for 2012 expected.
RWE AG | H1 2012 Conference Call | 14 August 2012 910
10Today’s Agenda
A
Peter Terium
Strategy update, H1 2012 highlights and group outlook 2012
B
Rolf Pohlig
H1 2012 group results, divisional performance and outlook 2012
RWE AG | H1 2012 Conference Call | 14 August 2012 113
11RWE Group key performance indicators
January – June Change
€ million 2012 2011 in %
External revenue 27,090 27,457 -1.3
Cash flows from operating activities 1,371 3,139 -56.3
EBITDA 5,040 4,622 9.0
Operating result 3,642 3,341 9.0
Non-operating result -142 -210 32.4
Financial result -857 -706 -21.4
Taxes on income -879 -643 -36.7
Minorities 137 162 -15.4
Hybrid investors’ interest 43 30 43.3
Net income 1,584 1,590 -0.4
Recurrent net income 1,665 1,667 -0.1
RWE AG | H1 2012 Conference Call | 14 August 2012 12
12Operating Result by Division (in € million)
+33%
1,691 H1 2011 H1 2012
1,268
-7%
943 -17%
876
691
+27%
-9% 575
425
-13% 352 319 +10% 334
187 162
89 98 +43%
-340
-598
Power Sales / NL/B UK CEE/SEE Renewables Upstream Trading/Gas
Generation Distribution Gas&Oil Midstream
Networks
Germany
RWE AG | H1 2012 Conference Call | 14 August 2012 13
13Further reduction of the gas-to-oil-spread exposure
bcm p.a. RWE’s long-term oil-indexed gas purchase portfolio at the end of the relevant year
30 Already achieved reduction of the oil-indexed share of RWE’s gas purchase portfolio
25
20
15
10
contract reviews initiated 2011
5
contract reviews initiated 2010
0
2009 2012 2015 2018 2021 2024 2027 2030 2033 2036
> RWE and Statoil have reached an agreement on the outstanding gas contracts including a gradual
adjustment of the contract price towards the prevailing market conditions and compensation for the
historic period since the start of the renegotiations
> Including the settlement with Statoil in June 2012 we have renegotiated more than 50% of our
oil-indexed contract volumes since 2009. We are still in the price review process with 2 gas
suppliers with a total volume of approx. 11 bcm p.a.
RWE AG | H1 2012 Conference Call | 14 August 2012 14
14Continued execution of measures to support
financial strength
Expected development of leverage factor (Net debt1/EBITDA)
Measures to improve financial headroom
Capital Divestments Focused long-term Efficiency
measures capex programme programme
up to €7bn by 2013 €4 – 5 bn/a €1bn by 2014
completed progressing from 2013 identified
1 Net debt = net financial debt + pension, mining and nuclear provisions + 50% of hybrid capital; (at year end).
RWE AG | H1 2012 Conference Call | 14 August 2012 15
15Development of net debt influenced by increase in
provisions due to low interest environment
€ billion Capex Dividends Acquisitions/ Cash flows Others Change Hybrid
divestiture/ from including in pension,
disposals/ operating f/x effects nuclear,
(de)consoli- activities mining
dation provisions
36 +2.0 34.0
+1.5
+2.1 +0.7
32 -0.2 -0.6
29.9
-1.4
28
24
0
Net debt Net debt
31 Dec 2011 30 Jun 2012
RWE AG | H1 2012 Conference Call | 14 August 2012 16
16Divisional outlook for the operating result
€ million 2011 actual 2012 forecast versus 2011
Germany 4,205 Above last year’s level
Power Generation 2,700 Above last year’s level
Sales/Distribution networks 1,505 In the order of last year’s level
Netherlands/Belgium 245 Below last year’s level
United Kingdom 357 Above last year’s level
Central Eastern and South Eastern Europe 1,109 Below last year’s level
Renewables 181 Above last year’s level
Upstream Gas & Oil 558 Significantly above last year’s level
Trading/Gas Midstream -800 In the order of last year’s level
RWE AG | H1 2012 Conference Call | 14 August 2012 17
17Back-up Charts
RWE AG | H1 2012 Conference Call | 14 August 2012 18Performance of the Germany Division (I)
Power Generation Business Area (RWE Power)
January – June: operating result: +33.4%
€ million
1,691
+ Absence of one-off burdens from new German energy policy in 2011
1,268 + Lower realised electricity prices offset by higher volumes (c. +€30m),
(including positive effects from the trial run of the new lignite-fired power
plant BoA 2&3)
- Higher fuel costs (c. -€160m) – including nuclear fuel tax – partly offset by
lower costs associated with CO2 certificates (c. +€70m)
2011 2012
+ Lower fixed operating and maintenance costs (c. +€230m)
+ Impact from change in nuclear and mining provisions (c. +€100m)
Guidance for fiscal year 2012: above last year
€ million + Absence of one-off burdens from new German energy policy in 2011
+ Start of commercial operation of new lignite-fired power plant BoA 2&3
2,700
+ Lower fixed operating and maintenance costs
+ Impact from change in nuclear and mining provisions
+ Lower CO2 costs
2011 2012 - Lower realised electricity prices and higher fuel costs (incl. nuclear fuel tax)
RWE AG | H1 2012 Conference Call | 14 August 2012 19
19Forward selling1 by RWE Power in the German market
(Base-load & peak-load forwards in €/MWh)
100
2012 forward
80
60
40
> 30% > 35% > 50% > 80% > 90%
100
2013 forward
80
60
40
> 10% > 30% > 50% > 80%
100
2014 forward
80
60
40
> 20% > 40%
01/01/2010 01/07/2010 01/01/2011 01/07/2011 01/01/2012 01/07/2012 01/01/2013
Base-load electricity forward in €/MWh Peak-load electricity forward in €/MWh > x%
1 Hedge ratio in % of full year production
(prices until 31 July 2012) (prices until 31 July 2012) (as of end of June 2012)
(Average realised price for 2011: €63/MWh (2010: €67/MWh)).
RWE AG | H1 2012 Conference Call | 14 August 2012 20
20Germany: Clean Dark and Spark Spreads (CDS/CSS)
2011 forward 2012 forward 2013 forward
Ø 14.88 Ø 9.78
Ø 7.74
Ø 6.16
Ø 4.93
Ø -0.45
Trading year 2010 Trading year 2011 Trading year 2012
CDS Cal 2011–13 Base load (€/MWh) Average CDS CSS Cal 2011–13 Peak load (€/MWh) Average CSS
(assumed thermal efficiency: 36%) Cal 2011–13 (assumed thermal efficiency: 49%) Cal 2011–13
Source: RWE Supply & Trading, prices until 31 July 2012.
RWE AG | H1 2012 Conference Call | 14 August 2012 21
21Performance of the Germany Division (II)
Sales/Distribution Networks Business Area
January – June: operating result: -7.1%
€ million
- Absence of positive one-off items compared to 2011
943 876
Sales
- Lower margins in electricity sales
Distribution networks
2011 2012
+ Improved efficiency enhancement
+ Income from sale of distribution networks due to loss of concession rights
Guidance for fiscal year 2012: in the order of last year’s level
€ million
- Absence of positive one-off items compared to 2011
1,505
+ Improved efficiency enhancement
- Lower income from investments from participations
2011 2012
RWE AG | H1 2012 Conference Call | 14 August 2012 22
22Performance of the Netherlands/Belgium Division
(Essent)
January – June: operating result: -13.4%
€ million
- Lower electricity generation spreads
+ Start of commercial operation of new gas-fired power plants Claus C and
187
162 Moerdijk 2
- Higher depreciation
+ Improved margins in the sales business due to cost cutting and gas
sourcing optimisation
2011 2012
Guidance for fiscal year 2012: below last year
€ million
- Lower electricity generation spreads
- Higher depreciation
245 + Better retail margins
+ Efficiency improvements and synergies
2011 2012
RWE AG | H1 2012 Conference Call | 14 August 2012 23
23Performance of the United Kingdom Division
(RWE npower)
January – June: operating result: -9.4 %
€ million - Absence of non-recurrent item relating to settlement of claims in 2011
Power generation
352 - Significantly lower margins
319
- Fire at biomass power plant in Tilbury
Retail
+ Improved commodity cost management
+ Higher sales volumes due to higher customer numbers and cold weather
2011 2012 - Lower margins in business segment
Guidance for fiscal year 2012: above last year
€ million + Further cost reductions / efficiency improvements
357 + Positive f/x effects
Power generation
- Further decline of spreads
+ Earnings contribution from Tilbury biomass
+ Commissioning of gas-fired power plant at Pembroke
2011 2012 Retail
+ Progress on squeezed domestic margins
RWE AG | H1 2012 Conference Call | 14 August 2012 24
24UK: Clean Dark and Spark Spreads (CDS/CSS)
2011 forward 2012 forward 2013 forward
Ø 21.05
Ø 13.78
Ø 8.19
Ø 3.55
Ø 6.70
Ø 3.43
Trading year 2010 Trading year 2011 Trading year 2012
CDS Cal 2011–13 Base load (€/MWh) Average CDS CSS Cal 2011–13 Base load (€/MWh) Average CSS
(assumed thermal efficiency: 36%) Cal 2011–13 (assumed thermal efficiency: 49%) Cal 2011–13
Source: RWE Supply & Trading, prices until 31 July 2012.
RWE AG | H1 2012 Conference Call | 14 August 2012 25
25Performance of the Central Eastern and South Eastern
Europe Division
January – June: operating result: -16.8%
€ million
- Negative f/x-effects
691 Czech Republic:
575
- Lower gas retail and distribution margins
Hungary:
- Lower electricity generation and retail margins
2011 2012
Guidance for fiscal year 2012: below last year
€ million Czech Republic:
1,109 - Lower distribution network margins
Stable gas transport and retail businesses
- Hungary: Lower electricity margins
Poland: Stable earnings contribution
2011 2012
RWE AG | H1 2012 Conference Call | 14 August 2012 26
26Performance of the Renewables Division (RWE Innogy)
January – June: operating result: +10.1%
€ million
+ Increased generation volumes (partly driven by improved wind
98 conditions and growth investments)
89
+ Improved electricity wholesale prices
- Absence of positive one-off in 2011 relating to liquidated damages
2011 2012
Guidance for fiscal year 2012: above last year
€ million
+ Commissioning of new projects
181 + Normalised weather conditions assumed
- Absence of positive one-off in 2011 relating to liquidated damages
- Upfront costs of large investment programme including higher staff
costs
2011 2012
RWE AG | H1 2012 Conference Call | 14 August 2012 27
27Performance of the Upstream Gas & Oil Division
(RWE Dea)
January – June: operating result: +27.2%
€ million
+ Higher realised oil and gas prices
425
334 + Positive f/x effects
- Higher depreciation
- Higher royalties
2011 2012
Guidance for fiscal year 2012: significantly above last year
€ million + Higher gas prices
558 + Positive f/x effects
+ Slightly lower exploration expenditures
+ Start of production in new gas fields
- Higher depreciation
2011 2012 - Increased cost of production and higher royalties
RWE AG | H1 2012 Conference Call | 14 August 2012 28
28Performance of the Trading/Gas Midstream Division
(RWE Supply & Trading)
January – June: operating result: +43.1%
€ million Trading
+ Improved performance in the energy trading business
Supply
-340
- Burdens from long-term oil-indexed gas contracts
+ Compensation from commercial settlements
-598
2011 2012
Guidance for fiscal year 2012: in the order of last year’s level
€ million Trading
+ Improved performance compared to weak previous year
Supply
- Burdens from long-term oil-indexed gas contracts
-800
2011 2012
RWE AG | H1 2012 Conference Call | 14 August 2012 29
29Development of TTF gas price and brent oil price
Forward for delivery Forward for delivery Forward for delivery Forward for delivery
in 2010 in 2011 in 2012 in 2013
€/MWh €/MWh
50 80
40 60
30 40
20 20
10 0
0 -20
Trading year 2009 Trading year 2010 Trading year 2011 Trading year 2012
Spread (right axis) TTF Natural Gas (left axis) Brent Crude(indexed to TTF, left axis)
Data until 31 July 2012
Relative development of the TTF and brent forwards for the years 2010, 2011, 2012 and 2013 since January
1st, 2009. To compare both, the brent oil price is based to the TTF gas price as of January 1st, 2009. The
curves simply illustrate the development of the market prices which should give a rough indication on the
gas-to-oil-spread situation. The real gas-to-oil-spread exposure depends on the individual contract details
and will deviate from this slide.
RWE AG | H1 2012 Conference Call | 14 August 2012 30
30Cash flow statement
January – June Change
€ million 2012 2011 (absolute)
Funds from operations (FFO) 2,451 2,984 -533
Change in working capital -1,080 155 -1,235
of which variation margins 232 -570 +802
Cash flows from operating activities 1,371 3,139 -1,768
Minus capex on fixed assets -2,111 -2,709 +598
Free cash flow -740 430 -1,170
FFO – among other things:
> Higher tax expenses and absence of Amprion FFO
Change in working capital – among other things:
> Absence of a temporary liquidity effect at Amprion
> Increase in accounts payable of our German Sales and Distribution Network Business Unit against Amprion
> Fluctuation in payments in connection with purchases and sales at our trading business
Capex on fixed assets – among other things:
> Extension and modernisation of our generation fleet
RWE AG | H1 2012 Conference Call | 14 August 2012 31
31RWE Group electricity production
(by geographic regions)
January – June Other Total Total
in TWh Germany UK NL/BE Internat. 2012 2011
Lignite 39.2 2.5 41.7 36.1
Nuclear 14.7 14.7 19.1
Hard coal 17.1 8.8 3.4 0.2 29.5 23.8
thereof contracts 10.6 10.6 10.5
Gas 4.3 11.9 3.1 0.1 19.4 19.9
Renewables 2.4 1.5 1.0 0.9 5.8 4.5
thereof contracts 0.3 0.6 0.9 0.5
Pumped storage, oil, other 1.4 1.4 0.9
thereof contracts 1.1 1.1 0.6
Subtotal 79.1 22.2 7.5 3.7 112.5 104.3
Electricity purchases1 39.1 59.1
Total 151.6 163.4
1 Net, excluding trading. Purchases for physical deliveries to customers only.
RWE AG | H1 2012 Conference Call | 14 August 2012 32
32RWE Group electricity sales volume
(by geographic regions)
January – June Total Total
in TWh Germany UK NL/BE Poland Hungary Other 2012 2011
Residential and commercial
13.2 9.2 5.6 1.2 2.7 0.2 32.1 32.3
customers
Industrial and corporate
27.8 16.0 7.5 1.8 2.3 0.4 55.8 57.9
customers
Distributors 42.2 2.9 0.9 46.0 52.0
Electricity trading1 7.8 7.8 11.8
Total 91.0 25.2 13.1 3.0 7.9 1.5 141.72 154.02
1 Net of electricity purchased from third parties.
2 Difference between electricity production and electricity sales volume due to grid losses, operating consumption
by lignite production and pumped-storage power plants.
RWE AG | H1 2012 Conference Call | 14 August 2012 33
33RWE Group gas sales volume
(by geographic regions)
January – June Czech Total Total
in TWh Germany Rep. NL UK Other 2012 2011
Residential and commercial
17.1 11.9 21.1 24.5 1.7 76.3 76.9
customers
Industrial and corporate
14.9 9.3 24.1 1.4 6.3 56.0 68.6
customers
Distributors1 23.2 8.9 0.0 0.4 0.5 33.0 39.8
Total 55.2 30.1 45.2 26.3 8.5 165.3 185.3
1 Includes gas trading in 2011.
RWE AG | H1 2012 Conference Call | 14 August 2012 34
34Financial liabilities and assets
(excluding hybrid capital, as of 30 June 2012)
Financial liabilities Financial assets Split of
in billion euros in billion euros securities
25 10
21.3 17,4 %
1.6 8
20 1.4 7.3
0.3 6.6 1.0
15.8
1.0 0.7
15 6
1.1 2.2
2.2
10 4 0.8
18.0 0.8
5.5 13.7
0.3
5 0.3 0.6 2
2.9 3.3
0.3 0.7
4.3
0.4
0 0 82,6 %
Short term Long term Total Short term Long term Total
(≤ 12 months) (> 12 months) (≤ 12 months) (> 12 months)
Bonds, incl. Collateral, margin payments1 Securities Collateral, margin payments1 Interest bearing Equities
other notes instruments
payable Other: including CP of € 1.1 Other: other financial receiv-
bn, finance leasing, financial ables, financial receivables
Loans with liabilities with non consolidated Cash/cash with non consolidated compa- Real estate Alternative
banks companies, other financial equivalents nies, other loans receivable (0%) investments (0%)
liabilities
1 Excluding variation margins which are netted against the fair values of the respective derivatives.
RWE AG | H1 2012 Conference Call | 14 August 2012 35
35Capital market debt maturities and sources
of financing
Capital market debt maturities1 Strong sources of financing
in € bn Fully committed
for liquidity
syndicated loan
2,5 20 back-up
(€ 4.0 bn up to Nov. 2015)
€ 0.0 bn
2,0 16
1,5 12
Commercial paper
$ 1.4 bn ($ 5.0 bn)
(up to 1 year)
1,0 8
€ 1.1 bn (30 June 2012)
0,5 4
0,0 0 MTN programme
2012
2016
2020
2024
2028
2032
2036
2040
€ 30 bn
(up to 30 years)
€ 15.9 bn (30 June 2012)2
Maturities of debt issued Hybrid (first call date)
Accumulated outstanding debt (incl. hybrid)
Balanced profile with limited maturities
up to end of 2014 (~€ 4.3 billion)
2 Bonds outstanding under the MTN-programme,
1 RWE AG and RWE Finance B.V., as of 30 June 2012 i.e. excluding hybrids. Including hybrids: € 19.7 bn
(incl. USD and CHF hybrid, issued 21st and 28th of June)
RWE AG | H1 2012 Conference Call | 14 August 2012 36
36Capital market debt currency and interest exposure
(as of 30 June 2012)
18%
33%
1
€ 19.7 bn € 20.5 bn2
67%
82%
€ £ Interest rate fixing expiry > 1 year
Interest rate fixing expiry < 1 year
1 Capital market debt = bonds of € 15.9 bn and hybrids of € 3.8 bn; split into currencies includes cross-currency swaps
2 Capital market debt plus other interest rate-related positions such as commercial paper and cash; including interest and cross-currency swaps
RWE AG | H1 2012 Conference Call | 14 August 2012 37
37Conventional power plant new build programme
€ bn1 2005 2006 2007 2008 2009 2010 2011 2012 2013 2014
Lingen
0.5
(Gas, 876 MW, 100%)
BoA 2&3, Neurath
2.6 Units G F
(Lignite, 2,100 MW, 100%)
Hamm
2.4 Units D E
(Hard coal, 1,528 MW, 77%)
Staythorpe
0.8 Units 1 -4
(Gas, 1,650 MW, 100%)
Pembroke
1.2 Units 1 -5
(Gas, 2,188 MW, 100%)
Moerdijk 2
0.4
(Gas, 426 MW, 100%)
Claus C
1.1
(Gas, 1,304 MW, 100%)
Eemshaven
2.9 Units A B
(Hard coal/biomass, 1,560 MW, 100%)
Denizli
0.5
(Gas, 775 MW, 70%)
1 Capex at 100% share
RWE AG | H1 2012 Conference Call | 14 August 2012 38
38RWE Dea's largest field developments
RWE Capex 1
Production start
share (€ bn) 2011 2012 2013 2014 2015 2016 2017 2018
West Nile Delta (Egypt) NA 40%
2.9
WMDW 20%
100%
Disouq (Egypt) 2 0.2
(Operator)
70%
Breagh Phase 1 (GB) 0.4
(Operator)
Reggane (Algeria) 19,5% 0.4
Edvard Grieg (Norway) 3 20% 0.6
4 10% 0.2
Knarr (Norway)
100%
NC 193 / 195 (Libya) 0.5
(Operator)
1 RWE‘s share in capex.
2 Budget “doubling” mainly due to rounding.
3 Formerly “Luno”.
4 Formerly “Jordbær”.
Bars indicate start of production.
RWE AG | H1 2012 Conference Call | 14 August 2012 39
39RWE Innogy major projects under construction
€ bn1 2008 2009 2010 2011 2012 2013 2014 2015 2016 2017
Gwynt y Môr
2.4
(Wind offshore, 576 MW, 60%)
Greater Gabbard
1.9
(Wind offshore, 504 MW, 50%)
Markinch (Biomass CHP,
0.3
45 MWe, 88 MWth, 100%)
Nordsee Ost2
0.9
(Wind offshore, 295 MW, 100%)
Capacity and earnings target for RWE Innogy until 2014 is mainly driven by 4 major projects
Large scale projects, especially in offshore wind, play a vital role in achieving European renewable targets as
growth potentials in other areas are limited
Utilities like RWE have a competitive advantage in these large-scale projects as we can build
on expert knowledge gained in our other large projects
1 Capex at 100% share; UK offshore includes investment for grid connection.
2 The construction schedule had to be revised in 2012 due to the delay in the offshore grid connection. In light of latest statements by
grid operator TenneT there is a risk of even further delays.
RWE AG | H1 2012 Conference Call | 14 August 2012 40
40Always be informed about RWE…
To always be up-to-date, please have a look at our website
www.rwe.com/ir
Calendar
http://www.rwe.com/web/cms/en/110614/rwe/investor-relations/calendar/
Annual and Interim Reports
http://www.rwe.com/web/cms/en/110822/rwe/investor-relations/financial-reports/
Results and Roadshow Presentations
http://www.rwe.com/web/cms/en/213092/rwe/investor-relations/events-presentations/archive/
Facts & Figures - The Guide to RWE and the Utility Sector – as well as various Factbook specials
http://www.rwe.com/web/cms/en/114404/rwe/investor-relations/events-presentations/factbook/
RWE as seen by analysts (overview of latest analyst earnings estimates and ratings)
http://www.rwe.com/web/cms/en/109506/rwe/investor-relations/shares/rwe-as-seen-by-analysts/
RWE bonds as seen by analysts (overview of latest analyst ratings)
http://www.rwe.com/web/cms/en/113984/rwe/investor-relations/bonds/credit-analysts-who-follow-rwe/
RWE AG | H1 2012 Conference Call | 14 August 2012 41
41You can also read