Electric Insights Quarterly - January to March 2020 - Drax

 
CONTINUE READING
Electric Insights Quarterly - January to March 2020 - Drax
January to March 2020
Electric Insights
Quarterly

Dr Iain Staffell, Professor Richard Green, Dr Rob Gross and Professor Tim Green
Imperial College London

Luke Clark
RenewableUK
Drax Electric Insights Quarterly – Q1 2020

                         Contents
                         1.      Headlines                                                                3

                         2.      Under lockdown, every day is a Sunday                                    4

                         3.      A final fling with coal power                                            6

                         4.      Wind power surges to new records                                         7

                         5.      Demand-side response to the rescue                                       8

                         6.      Capacity and production statistics                                       9

                         7.      Power system records                                                    10

                         Electric Insights was established by Drax to help inform and enlighten the debate
                         on Britain’s electricity. It is delivered independently by a team of academics from
                         Imperial College London. Data courtesy of Elexon, National Grid and Sheffield Solar.

                                                                                                                2
Drax Electric Insights Quarterly – Q1 2020

 1. Headlines
 2020 has got off to a pretty poor start. Britain was                         Britain moved ever closer to a complete phase-out of coal
 battered by storms throughout January and February.                          power. Two coal plants retired at the end of the quarter
 Unprecedented rainfall flooded thousands of homes, but                       as they were no longer profitable. Before shutting, they
 the accompanying gales sent wind power to new records.                       burnt through their remaining stockpiles of fuel, running
                                                                              continuously for 117 days over winter. National output from
 Then in March, the coronavirus pandemic took hold in                         coal over the quarter was up for the first time in eight years.
 the UK. Social distancing was followed by a full lockdown.
 Businesses closed and people stayed home, sending                            With record wind output and depressed demand, electricity
 electricity demand down to levels not seen since the                         generation from fossil fuels was down 25% on this quarter
 1980s, and power prices to a 12-year low. Day-ahead prices                   last year, the largest fall on record. This also gave one of the
 averaged just £28/MWh during March, a fall of one-third                      lowest quarterly carbon intensities on record. With an average
 over the last year.                                                          of 173 g/kWh, emissions were down 20% on this time last year.

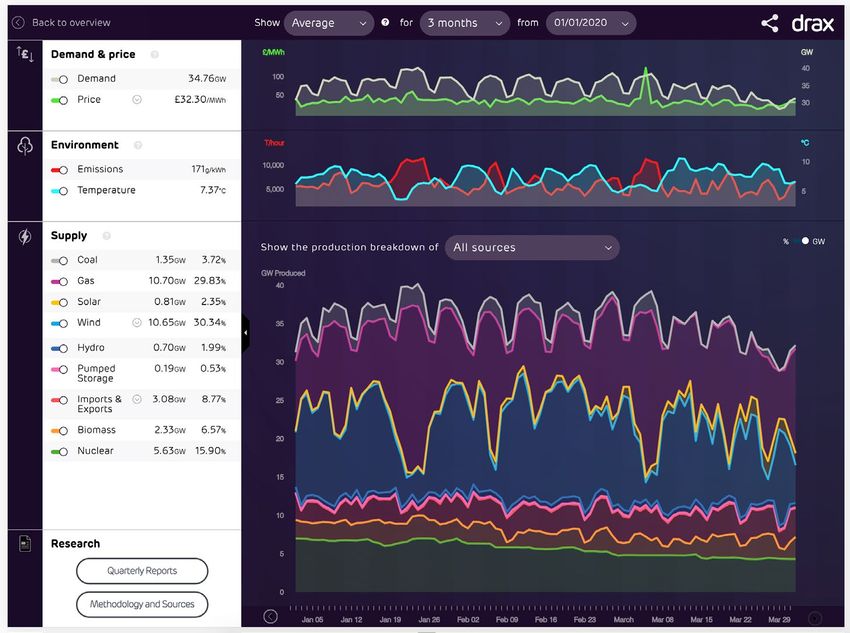
 The daily average electricity generation mix (top) and day-ahead power price (bottom), illustrating the major events over the last quarter

 GW                                                 Coal has an unbroken run generating for 117 days                        Lockdown radically
 40                                                                                                                         alters and reduces
                                                                                                                            electricity demand

 35

 30

 25
                                                                                                                                           Coal

 20                                                                                                                                        Gas
                                                           Wind capacity factors
                                                          exceed 55% in February                                                           Solar
  15
                                                                                                                                           Wind

                                                                                                                                           Hydro
  10
                                                                                                                                           Imports

  5                                                                                                                                        Biomass

                                                                                                                                           Nuclear
  0
                                                                                                                                           Exports
                       January                                     February                                  March
 –5

                                    Demand-side response
                                    helped the system during a                                   …but not during a second
£/MWh                               cold, calm spell in January…                                 one in early March
£125

£100

 £75
                                                                                                                                        Daily price
£50
                                                                                                                                           Max
£25                                                                                                                                        Average
                                                                                                                                           Min
 £0
                       January                                     February                                  March
–£25

                                                                                                                                                   3
Drax Electric Insights Quarterly – Q1 2020

2. Under lockdown, every day
   is a Sunday

On March 23rd the UK took an unprecedented move to                        drawing power. Electric rail, tram and tube systems are
tackle the coronavirus. Most business that had not already                also running a reduced service. On the contrary, with more
closed moved online, with millions of people now working                  people at home, household electricity consumption has
from home. This had a huge impact on electricity demand:                  increased. Octopus Energy estimate that during social
consumption on weekdays fell by 13% to its lowest levels                  distancing (before the stricter lockdown came into effect)
since 1982 – a time when there were 10 million fewer people               homes were consuming up to a third more electricity,
in the country, and GDP was a third lower than today.                     adding £20 per month to the typical bill.

Other regions have seen a similar collapse in electricity                 The impact of lockdown on Britain’s electricity demand is
demand. Spain, Italy and France have all seen electricity                 much like living through a month of Sundays. The average
demand fall by 10–15% according to analysis by Ember. Across              profile for a March weekend day in previous years looks
the Atlantic, New York City has seen similar reductions.                  very similar to the daily profile for weekdays since lockdown
                                                                          begun – both in the amount of electricity consumed and
Demand has fallen for a simple reason: with schools and                   the structure. Post-lockdown weekends have even lower
workplaces now closed or running with a greatly reduced                   demand, tracking 11% below weekday demand.
staff – machinery, computers, lights and heaters are not

Daily average electricity demand in Britain across all working days in March

GW
50
                                                                                                        2013: Worst snow storm
                                                                                                        for 30 years
                                                                                                                      2018: Beast
                                                                                                                      from the East
45

40

                                                                                                                              2020:
                                                                                                                              Before
                                                                                                                              lockdown
35

                                                                                                                              2020:
                                                                                                                              coronavirus
30                                                                                                                            lockdown

                          1982: Fallout from the year-long recession

25
     1975         1980         1985          1990         1995         2000      2005         2010        2015         2020

                                                                                                                                         4
Drax Electric Insights Quarterly – Q1 2020

Average daily electricity demand profiles during March and April,
comparing normal years (2015–19) with the current lockdown

GW
40

35

30

25

20                                                                          Normal Mon–Fri         Lockdown Mon–Fri

15                                                                          Normal Sat/Sun         Lockdown Sat/Sun

10

 5

 0
     00:00      02:00      04:00      06:00   08:00    10:00        12:00        14:00     16:00     18:00     20:00     22:00     00:00

People no longer have to get up at the crack of dawn for                    However, as lockdown continued into April and May,
work. On a typical weekday morning, demand would rise by                    emissions from power production in Britain have fallen
10 GW over two hours from 5:30 to 7:30 AM. Now it takes                     by 35% on the same period last year. The effect is slightly
more than twice as long – until midday – for this rise to                   stronger across Europe, with carbon emissions falling
occur. At the other end of the day, there would normally be                 almost 40% as dirtier coal and lignite power stations are
a small peak in demand around 8 PM from people gathering                    being turned down.
in pubs and restaurants up and down the country. Both
on weekdays and weekends, demand begins falling earlier                     Will some of these effects persist after lockdown
in the evening as the sofa has become the only available                    restrictions are eased? It is too early to tell, as it depends
social venue.                                                               on what long-lasting economic and behavioural changes
                                                                            occur. Electricity demand is linked with the country’s GDP,
With lower demand comes lower power prices. Wholesale                       which is set to face the largest downturn in three centuries.
electricity prices are typically 7% lower on Sundays than                   Whether the economy bounces back, or is afflicted with
on weekdays for this reason. March saw the lowest                           a lasting depression will be key to future electricity
monthly-average power price in 12 years, down one-third                     demand. It will also depend on behavioural shifts. People
on this month last year. Prices were already heading                        are of course craving their lost freedoms, but many may
downwards because of the falling price of gas, but the                      appreciate not going back to a lengthy daily commute –
lockdown has amplified this, and negative prices have                       and the rise of video conferencing and collaboration apps
become commonplace during the middle of the day. There                      has shown that remote working may finally have come of
was not a visible impact on carbon emissions during the                     age. With even a small share of the population continuing
first quarter of the year, as only the last week of March                   to work from home on some days, there could be a lasting
was affected.                                                               impact on electricity demand for years to come.

                                                                                                                                             5
Drax Electric Insights Quarterly – Q1 2020

3. A final fling with coal power
Two of Britain’s oldest coal power stations closed on                                                              Rather than go out with a whimper, these stations increased
March 31 , leaving just three left on the mainland. But
                st
                                                                                                                   their output over winter. Coal power generation was up 3%
before shutting down they burnt through their remaining                                                            on the same quarter last year. While absolute output was
stockpiles of fuel, pushing up Britain’s coal consumption                                                          small (4% of electricity consumed over the quarter), this
for the first time since 2012.                                                                                     was the first year-on-year rise in eight years. For the first
                                                                                                                   time since 2017, there was not a single hour with zero coal
Coal phase-out took another huge step this quarter. 3.5 GW                                                         generation over the majority of winter. Coal continued
of capacity was retired, leaving just over 5 GW – a far cry from                                                   generating without pause for 117 days straight, from
the 28 GW that were operating just 10 years ago. 80% of the                                                        November 12th through to March 8th. The previous winter
coal power stations once operating in Britain have now fallen                                                      saw almost 400 coal-free hours during the same period.
silent, with capacity halving over the last twelve months.
                                                                                                                   It appears these plants ran consistently whether or
Installed coal power station capacity over the last decade                                                         not they could make a profit from selling power. During
                                                                                                                   the winter (October 2019 to March 2020), coal plants
GW
                                                                                                                   continued producing 750 MW all the way down to prices
30
                                                                                                                   of –£75/MWh. The winter before that, coal plants almost
25                                                                                                                 never ran when power prices fell below £45/MWh.

20
                                                                                                                   Why might they have been willing to pay handsomely to dispose
                                                                                         –80%
15
                                                                                                                   of their electricity? Coal stockpiles must be actively managed
                                                                                                                   to prevent uncontrolled fires. Coal power stations can sit on
10                                                                                                                 several months’ worth of fuel, and there are relatively few
                                                                                                                   buyers of coal left in the country. Generating power (even at
    5
                                                                                                                   times of low or negative power prices) may have proven less
    0                                                                                                              costly than safe disposal of fuel after the plants had shut.
         2010            2012             2014              2016              2018             2020

                                                                                                                   Going forwards, coal generation is likely to be lower than ever.
Fiddler’s Ferry in Cheshire and Aberthaw B in south                                                                With reduced demand and growing renewable output, Britain
Wales were built in the late 1960s and early 1970s, and                                                            had already gone 35 days without any coal generation at the
had operated for nearly 50 years. Both closures were                                                               time of going to press. Of the three remaining coal stations,
announced last summer on financial grounds, as the UK’s                                                            Drax’s coal units will cease operating in March 2021. The
strong carbon price1 meant they could no longer compete                                                            other stations may well retire before the government’s
with the lower cost of gas and renewables.                                                                         2025 deadline; marking the end of an era.

Average coal generation over winter months at times of different power prices

GW                                                                             Day-ahead price (£/MWh)                                Oct 2018 — Mar 2019      Oct 2019 — Mar 2020
6

5

4
                      21 GWh generated from coal during
3                     the winter months of 2019/20 while
                      prices were negative
2

1

0
        –£75                      –£50                           –£25                          £0                     £25                £50                £75               £100

1   The carbon price paid by British power stations averaged £37.60 per tonne of CO2, averaged over the quarter.

                                                                                                                                                                                     6
Drax Electric Insights Quarterly – Q1 2020

4. Wind power surges to new records
Britain’s wind farms had a bumper quarter, with output                   went fully operational in December, but suffered an
up 40% on this time last year. A succession of severe                    unplanned outage between 10th January and 8th February
winter storms battered the country, giving the wettest and               which impacted around 2.2 GW of wind farms, or 10% the
windiest February since records began. This helped make                  UK’s wind capacity. Ofgem is currently investigating the
February the first month on record when more electricity                 performance of the cable, which should help to alleviate
was produced by wind farms than gas-fired power stations                 constraints that force Scottish wind farms to turn off
across the country.                                                      when their output cannot be transported down to the
                                                                         rest of the country.
The two were neck and neck over the whole quarter: wind
supplied 30.5% of Britain’s electricity, versus 30.6% from gas.          Britain’s wind farms ran at all-time high capacity factors, in
This pushed the supply from all renewables to over 40% of                February averaging 50% for onshore and 60% for offshore
electricity consumed, overtaking output from fossil fuels for            wind farms. This was significantly higher than fossil-fuelled
the first time. The exceptional output was driven for a large            power stations (34% for gas and just 17% for coal), and
part by extreme weather. Storm Ciara hit in early February,              higher even than the country’s nuclear reactor fleet (59%).
and was followed just days after by Storm Dennis, one of
the most intense ever recorded in the UK. Together these                 Looking ahead, wind generation records will continue
killed eight people, left half a million without power and               being broken as two major offshore wind farms are due
brought devastating flooding across Wales, the Midlands,                 to come online later this year. Hornsea One (1,218 MW)
Cumbria and Yorkshire.                                                   and East Anglia One (714 MW) will both dwarf the world’s
                                                                         largest operating wind farm (Walney Extension, also in
The contribution of wind would have been even higher if the              the UK). Together they will power over 1.5 million homes,
Western Link (which connects Scotland, Wales and England)                and bring the UK’s total offshore wind capacity to over
had been functioning normally. The £1.3bn subsea cable                   10 GW – the largest fleet in the world.

The share of electricity supplied by renewables and fossil fuels each quarter over the past decade

80%

70%

60%

50%

                                                                                                                         Renewables
40%

                                                                                                                         Fossil
30%

20%

                                                                                                                           Wind
10%                                                                                                                        Solar
                                                                                                                           Biomass

 0%                                                                                                                        Hydro
         2010         2011        2012       2013     2014        2015      2016        2017         2018      2019

                                                                                                                                      7
Drax Electric Insights Quarterly – Q1 2020

5. Demand-side response
   to the rescue

Two cold, calm spells punctuated the record wind output                                                              The ‘loss of load probability’ rose to 37%, meaning a one-
last quarter. Demand-side response operated full force                                                               in-three chance of widespread blackouts as supply and
to help during the first event in January. It was much less                                                          demand were cutting close. There was just 0.2 GW of spare
prominent during the second event in March, giving very                                                              capacity available on the evening of the 4th, compared to
different consequences for the power system.                                                                         over 4 GW the next day. This sent the balancing price to a
                                                                                                                     high of £2,234/MWh – numbers not seen for over a decade.
The first spell happened in mid-January. Wind output
fell to a low of 2.6 GW across Wednesday 22nd. One week                                                              Demand-side response had not activated to such an
either side of this it was five times higher at over 14 GW.                                                          extent on the evening peaks. Between November and
Gas and coal output increased to fill the void, but also the                                                         February, large consumers can save money by avoiding
evening peak in demand disappeared.                                                                                  power consumption during ‘the triads’ – the three half-
                                                                                                                     hour periods of the year with the highest system demand.
At that time of year, demand typically rises 5–6 GW between                                                          Avoiding these triads reduces their network charge for the
2:30 and 5:30 PM, but on these days the rise was less than                                                           coming year, which can be a significant portion of their
half of this. Factories, supermarkets and a host of other                                                            total bill. As this financial incentive to avoid peaks doesn’t
consumers automatically reduced their demand during the                                                              exist in March, facilities kept on running – at the risk of
peak hours. This prevented demand on the transmission                                                                creating power outages.
system (the thick line in the chart below) from going above
47.5 GW, and meant that day-ahead power prices remained                                                              The triads will be phased out two years from now, pushing
normal – peaking at just £86/MWh on the 22 .                                   nd
                                                                                                                     up energy costs for large electricity consumers such as
                                                                                                                     industry, water treatment and supermarkets. New markets
The second event came on Wednesday the 4th of March.                                                                 for flexibility will be required if we wish for these firms
Again, wind output fell to just 2.2 GW, from highs of 14                                                             to continue contributing towards security at times of
GW a few days either side. And although it was a couple                                                              peak demand.
of degrees warmer and demand was lower, the system
became extremely stressed in the late evening.

The half-hourly electricity supply mix during the two cold-calm spells this quarter

                                    DSR: our estimate of the supply that wasn’t                                          Coal               Gas                   Solar                   Wind
GW                                  needed because of demand-side response1                                              Hydro              Imports               Biomass                 Nuclear
50

40

30

20

10

    0
        Jan 18th 19th        20th      21st      22nd      23rd      24th      25th      26th      27 th             Feb 29th Mar 1st       2nd       3rd       4th       5th       6th       7 th      8 th        9th

1   Electricity which was not consumed due to triad avoidance is not recorded and so must be estimated. We used the typical daily profile for each day of the week from recent years with similar temperatures to
    reconstruct a demand estimate.

                                                                                                                                                                                                                          8
Drax Electric Insights Quarterly – Q1 2020

6. Capacity and production statistics
This quarter saw wind come within striking distance of beating gas                                                                         Britain’s electricity supply mix in the first quarter
for the first time ever – with just 0.1 TWh separating them. Wind farm                                                                     of 2020
capacity factors averaged nearly 50% over the quarter, well above their
long-run average of 30% (26% for onshore and 37% for offshore).

Electricity generation from fossil fuels was down an incredible 25%
on this quarter last year – the largest single fall on record. Gas-
fired power stations ran at an average of just 38% of their installed
capacity over the quarter – a lower utilisation than onshore wind                                                                                                    76.3 TWh
farms. However, at their peak, fossil fuel plants needed to run at                                                                                                    supplied
near-full capacity at some point during the quarter (96% for gas,
83% for coal). This shows there is still a need to keep these assets
around for times when demand is high and renewable output is
low, at least until other flexible technologies can take their place.

Year-on-year change in electricity generation from fossil fuels
                                                                                                                                                                                                     Share of the mix
    20%
                                                                                                                                           Gas                                                                          30.6%
    10%                                                                                                                                    Wind                                                                         30.5%

    0%                                                                                                                                     Nuclear                                                                      16.1%
                                                                                                                                           Imports                                                                       7.6%
–10%
                                                                                                                                           Biomass                                                                       6.7%
–20%                                                                                                                                       Coal                                                                          3.9%
                                                                                                                                           Solar                                                                         2.6%
–30%
            2010       2011      2012      2013       2014      2015      2016        2017     2018      2019        2020                  Hydro                                                                         2.0%

Installed capacity and electricity produced by each technology 1 2

                                                Installed Capacity (GW)                                          Energy Output (TWh)                                        Utilisation / Capacity Factor

                                          2020 Q1                    Annual change                        2020 Q1                    Annual change                        Average                        Maximum

Nuclear                                       9.5                               ~                            12.3                       –0.8 (–6%)                           60%                             73%

Biomass                                       3.2                               ~                             5.1                       +1.0 (+24%)                          69%                            100%

Hydro                                          1.1                              ~                             1.5                       +0.4 (+37%)                          64%                             97%

Wind                                          21.9                       +1.2 (+6%)                          23.3                       +6.7 (+41%)                          49%                             77%
– of which Onshore                            13.2                       +0.5       (+4%)                     13.1                       +4.0 (+45%)                          46%                            79%

– of which Offshore                            9.1                       +0.7       (+8%)                     10.1                       +2.7   (+36%)                        51%                             81%

Solar                                         13.2                       +0.1 (+1%)                           2.0                       +0.0 (+2%)                            7%                             68%

Gas                                           28.1                              ~                            23.4                       –8.8 (–27%)                          38%                             96%

Coal                                          5.3                       –5.2 (–50%)                           3.0                       +0.1 (+4%)                           16%                             83%

Imports                                                                                                       6.7                       –0.3 (–5%)                           64%                             97%
                                              5.0                               ~
Exports                                                                                                       0.8                       +0.0 (+4%)                            8%                             64%

Storage discharge                                                                                             0.4                       –0.1 (–24%)                           6%                             61%
                                               3.1                              ~
Storage recharge                                                                                              0.5                       –0.1 (–23%)                           7%                             61%

1    Other sources give different values because of the types of plant they consider. For example, BEIS Energy Trends records an additional 0.7 GW of hydro, 0.6 GW of biomass and 3 GW of waste-to-energy plants.
     These plants and their output are not visible to the electricity transmission system and so cannot be reported on here.
2    We include an estimate of the installed capacity of smaller storage devices which are not monitored by the electricity market operator. Britain’s storage capacity is made up of 2.9 GW of pumped hydro storage,
     0.6 GW of lithium-ion batteries, 0.4 GW of flywheels and 0.3 GW of compressed air.

                                                                                                                                                                                                                           9
Drax Electric Insights Quarterly – Q1 2020

7. Power system records
This was a record-breaking quarter for renewables and low-carbon
power sources. Britain’s wind farms broke all records, most notably
by supplying an average of 12.3 GW through February, smashing
previous record of 9.3 GW set back in December 2019.

Biomass supplied more than a tenth of electricity over a day for the
first time on 27 th March. Instantaneous output from all renewables
exceeded 25 GW for the first time ever for a period on 12th March, up
11% on the previous record set one year ago.

March saw the lowest monthly-average power prices for more than
a decade. The impact of the coronavirus lockdown is not yet breaking
all-time record lows for demand, as these tend to happen in summer
when people are away on holidays.

The tables below look over the past decade (2009 to 2020) and
report the record output and share of electricity generation, plus
sustained averages over a day, a month and a calendar year. Cells
highlighted in blue are records that were broken in the first quarter
of 2020. Each number links to the date it occurred on the Electric
Insights website, allowing these records to be explored visually.

                               Wind – Maximum                                               Solar – Maximum
                         Output (MW)         Share (%)                                 Output (MW)     Share (%)

   Instantaneous            16,962            58.8%                   Instantaneous       9,550         29.4%

    Daily average           15,962            47.2%                    Daily average      3,386          12.0%

   Month average            12,346            34.1%                  Month average        2,464          8.1%

    Year average            6,682             20.1%                    Year average       1,331          4.0%

                             Biomass – Maximum                                         All Renewables – Maximum
                         Output (MW)         Share (%)                                 Output (MW)     Share (%)

   Instantaneous            3,452              13.0%                  Instantaneous      25,225         68.0%

    Daily average           3,298              10.1%                   Daily average     19,700          57.2%

   Month average            2,839              7.9%                  Month average       16,030         44.3%

    Year average            2,053              6.2%                    Year average      10,475          31.5%

                                                                                                                   10
Drax Electric Insights Quarterly – Q1 2020

                                 Gross demand                                       Demand (net of wind and solar)
                       Maximum (MW)           Minimum (MW)                           Maximum (MW)      Minimum (MW)

   Instantaneous            60,070               18,214          Instantaneous          59,563             8,118

    Daily average           49,203               24,704          Daily average          48,823            12,308

   Month average            45,003               28,592          Month average          43,767            20,212

       Year average         37,736               32,659              Year average       36,579            24,646

                         Day ahead wholesale price                                          Carbon intensity
  £                   Maximum (£/MWh)        Minimum (£/MWh)
                                                               CO2
                                                                                    Maximum (g/kWh)   Minimum (g/kWh)

   Instantaneous            792.21               –72.84          Instantaneous           704                43

    Daily average           197.45                –4.62          Daily average            633               76

   Month average             63.17                28.50          Month average            591               157

       Year average         56.82                 36.91              Year average        508                192

                         All low carbon – Maximum                                     All low carbon – Minimum
 CO2                                                           CO2
                         Output (MW)            Share (%)                             Output (MW)        Share (%)

   Instantaneous            32,688                89.0%          Instantaneous           3,395             8.3%

    Daily average           27,282                79.3%          Daily average           5,007             10.8%

   Month average            23,276                64.3%          Month average           6,885             16.7%

       Year average         17,902                53.4%              Year average        8,412             21.6%

                         All fossil fuels – Maximum                                    All fossil fuels – Minimum
                         Output (MW)            Share (%)                             Output (MW)        Share (%)

   Instantaneous            49,307               88.0%           Instantaneous           2,421             9.1%

    Daily average           43,085                86.4%          Daily average           3,921             14.9%

   Month average           36,466                 81.2%          Month average          10,020             30.3%

       Year average         29,709                76.3%              Year average        13,756            41.3%

                             Nuclear – Maximum                                            Nuclear – Minimum
                         Output (MW)            Share (%)                             Output (MW)        Share (%)

   Instantaneous            9,342                 42.8%          Instantaneous           3,705             8.7%

    Daily average           9,320                 32.0%          Daily average           3,754             10.3%

   Month average            8,649                 26.5%          Month average           4,446             12.9%

       Year average         7,604                 22.0%              Year average        6,023             17.2%

                                                                                                                        11
Drax Electric Insights Quarterly – Q1 2020

                                                 Coal – Maximum                                                                                                     Coal – Minimum
                                       Output (MW)                        Share (%)                                                                       Output (MW)                        Share (%)

      Instantaneous                        26,044                            61.4%                                       Instantaneous                            0                             0.0%

      Daily average                        24,589                            52.0%                                       Daily average                            0                             0.0%

     Month average                         20,746                           48.0%                                       Month average                             28                             0.1%

       Year average                         15,628                          42.0%                                         Year average                           678                             2.0%

                                                 Gas – Maximum                                                                                                        Gas – Minimum
                                       Output (MW)                        Share (%)                                                                       Output (MW)                        Share (%)

      Instantaneous                          27,131                         66.3%                                        Instantaneous                          1,556                           4.9%

      Daily average                         24,210                           59.6%                                       Daily average                          3,071                            9.5%

     Month average                         20,828                           54.8%                                       Month average                           6,775                           19.9%

       Year average                         17,930                          46.0%                                         Year average                          9,159                           24.6%

                                              Imports – Maximum                                                                                                 Exports – Maximum
                                       Output (MW)                        Share (%)                                                                       Output (MW)                        Share (%)

      Instantaneous                         4,884                            18.3%                                      Instantaneous                         −3,870                           −11.8%

      Daily average                         4,490                            14.3%                                       Daily average                         –2,748                           –6.1%

     Month average                          3,796                            10.6%                                      Month average                          –1,690                           –3.8%

       Year average                         2,850                            8.6%                                         Year average                          –731                            –1.9%

                                     Pumped storage – Maximum 1                                                                                         Pumped storage – Minimum 1
                                       Output (MW)                        Share (%)                                                                       Output (MW)                        Share (%)

      Instantaneous                         2,660                            6.0%                                       Instantaneous                          –2,782                          –10.8%

      Daily average                           362                             1.2%                                       Daily average                          –622                            –1.7%

1   Note that Britain has no inter-seasonal electricity storage, so we only report on half-hourly and daily records. Elexon and National Grid only report the output of large pumped hydro storage plants.
    The operation of battery, flywheel and other storage sites is not publicly available.

                                                                                                                                                                                                             12
Drax Group plc                                        Imperial Consultants
Drax Power Station, Selby, North Yorkshire, YO8 8PH   58 Prince’s Gate, Exhibition Road, London, SW7 2PG
www.drax.com                                          www.imperial-consultants.co.uk
@Draxnews                                             @ConsultImperial
You can also read