Monthly Market Synopsis - We are Property People who are passionate about Performance and Progression - ARK Consultancy
←
→
Page content transcription
If your browser does not render page correctly, please read the page content below
ARK CONSULTANCY | MARKET SYNOPSIS

We are Property People who
are passionate about
Performance and Progression.

Monthly Market
Synopsis
COVERING THE PERIOD END TO APRIL 2021
ARK CONSULTANCY | MARKET SYNOPSIS

01        COMMENTARY
      Welcome to the latest edition of ARK’s market synopsis report
      covering market outcomes to the end of April and with Rightmove
      picking up reporting for May

1.1   The reports continue the themes that have emerged over the last few months. London
      is reporting weaker growth than most of the UK. Wales, the North West (including
      Liverpool and Manchester) and Yorkshire and Humber show strong property price
      inflation providing, we argue, supporting evidence of an ongoing “drive to the
      countryside”.

1.2   The “race for space” is still a key driver with demand for traditional 3-bed type family
      homes remaining strong, in most locations demand for these homes is outstripping
      supply.

1.3   We have a sense that the commentators are becoming more optimistic about the later
      part of the year, they expect that unemployment increases will dampen demand but
      reading through the commentaries we have a sense that they seem to feel that market
      will be more sustainable than has been reflected in previous reports.

02        HIGHLIGHTS
2.1   Halifax marked in annual house price at 8.2% in April, making it the highest annual
      growth rate in 5 years. The average property now stands at £258,204 which is up 1.4%
      on a month-on-month basis. In the short term, the ‘search for space’ and government
      initiatives will continue as market drivers, this is an emerging theme coming through
      this month’s reporting.

2.2   Annual house price for Nationwide comes in at 7.1% for April - up from 5.7% in March.
      On a month-on-month basis, house price inflation stands at 2.1%. There remains
      caution for the end-of-year outlook at it is expected that unemployment will rise which
      will slow down market activity. However, housing preferences may continue to support
      market activity despite the weakening of the labour market.

2.3   One benefit of the pandemic has been the rise in savings. Traditionally, commentators
      are concerned that the UK public hold very little in the way of savings but in April’s
      reporting, Nationwide notes a rise in household deposits since the start of the
      pandemic “in the 12 months to February 2021, household deposits increased by £196
      billion, equivalent to around £7,000 per household, and almost three times the amount
      accumulated in the same period the previous year.”

2.4   In the RICS reporting, new buyer demand seems to be pretty much the same as the
      previous month with a headline net balance of +44% in April (+43% in March).

2.5   The RICS saw a rise in newly agreed sales this was evidenced by a net balance of +34%
      of respondents noting an increase.

2.6   In regard to the twelve-month outlook, contributors anticipate a cooling in sales
      growth, with the headline net balance at +12%.

PAGE 2
ARK CONSULTANCY | MARKET SYNOPSIS

2.7       Another emerging trend from this month’s reporting is demand not being able to keep
          up with supply, the following commentators cite:

      •    “The number of fresh listings arriving on the market is insufficient to match the
           current levels of demand. Indeed, the net balance for new instructions fell to -4% in
           the latest results, down from +21% previously.” – RICS

      •    “Prices are being underpinned by demand from buyers continuing to outstrip supply.”
           – Hometrack

      •    “demand continues to massively exceed supply, especially in northern regions… it is
           the north that is seeing the greater imbalance between demand and supply and this is
           one of the main factors driving prices to new records in all regions except the capital.
           This supply shortage is particularly marked for typical family homes with three
           bedrooms or more, with available stock for sale on agents’ books in April down by an
           average of 50% on the same period in 2019” - Rightmove

2.8       Looking at Hometrack reporting, it is expected that total sales completions this year will
          be 1.52 million, marking the year as “one of the most active sales markets since the
          global financial crisis, and as one of the top ten busiest years since 1959.”

2.9       At regional level, Wales, Yorkshire & the Humber and the North West are registering
          the highest price growth. At city level, Liverpool (+6.9%) and Manchester (+6.8%)
          registered the highest price growth – this is the fifth consecutive month this has been
          the case.

2.10 On the flip side, London registered price growth at 1.9% - the slowest regional rate of
     growth across the UK for the sixth consecutive month. Annual price growth for London
     is at +0.3%. Four central London boroughs are registering price falls for the third or
     fourth consecutive month, including the City of London (prices down -2.5% year on
     year), Westminster (-2.2%), Kensington & Chelsea (-1.7%) and Hammersmith & Fulham
     (-1.4%).

2.11 Moving onto Rightmove for May’s reporting. The average price of property coming to
     market is at £333,564 an increase of 1.8% (+£5,767) - above the previous all-time high
     recorded a month ago.

2.12 Rightmove’s year-on-year comparison echoes Hometrack's April report as it illustrates
     Wales (+13.0%) as the fastest-growing region followed by Northwest (+11.1%), and
     Yorkshire & the Humber (+10.5%) whereas London lags at +0.2%.

                                                                                            PAGE 3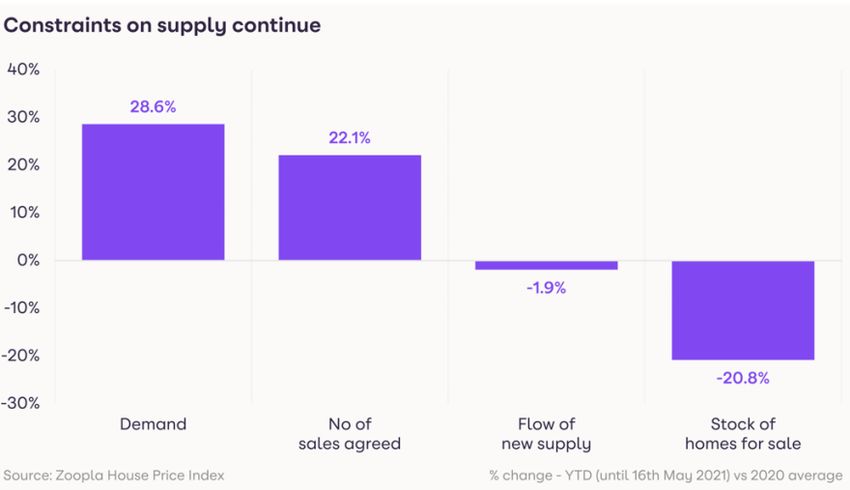
ARK CONSULTANCY | MARKET SYNOPSIS

03         HALIFAX (APRIL)
3.1   House prices in April eclipsed the record high set the month before as the market
      continued to maintain its recent momentum. The average property is now worth
      £258,204, up 1.4% month on month and 8.2% annually, the highest annual growth rate
      in 5 years. In cash terms, almost £20,000 has been added to the value of the average
      home since the market had essentially come to a standstill in April 2020.

3.2   The influence of the stamp duty holiday will fade gradually over the coming months as
      it’s tapered out but low stock levels, low interest rates and continued demand is likely
      to continue to underpin prices in the market.

3.3   We expect recent levels of activity to be sustained over the short-term as buyers
      continue to search for homes with more space and potentially better suited for their
      new working patterns. Savings built up over the months in lockdown have given some
      buyers even more cash to invest in their dream properties, while the new mortgage
      guarantee scheme may have eased deposit constraints for some prospective
      homebuyers who previously thought their first step on the housing ladder was a few
      years away.

3.4   There is growing optimism in the long-term outlook of the UK economy as the
      vaccination programme continues at pace, yet we remain cautious about the medium-
      term prospects of the housing market. As we said in March, the current levels of
      uncertainty and potential for higher unemployment as furlough support ends leads us
      to believe that house price growth will slow to the end of the year.

                                          Halifax House Price Change %
         9.0
         8.0
         7.0
         6.0
         5.0
         4.0
         3.0
         2.0
         1.0
         0.0
       -1.0
                                          Jul-20

                                                                                                                                   Apr-21
               Apr-20

                        May-20

                                 Jun-20

                                                                                                        Jan-21
                                                                                  Nov-20
                                                      Aug-20

                                                               Sep-20

                                                                                           Dec-20

                                                                                                                 Feb-21

                                                                                                                          Mar-21
                                                                         Oct-20

                                                   Monthly              Quarterly                   Annual
                                                   Change               Change                      Change
                                                   %                    %                           %

                                                     Source: Halifax, IHS Markit

3.5   Click here to read more.

PAGE 4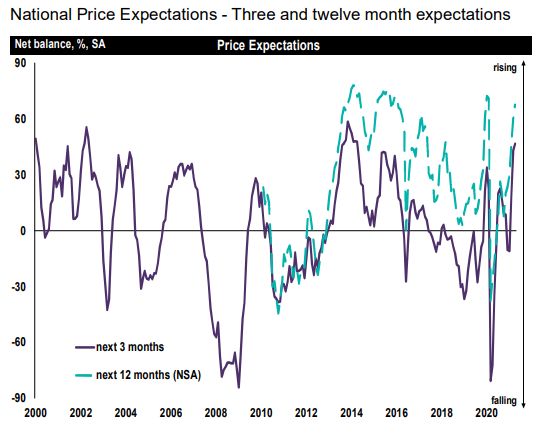
ARK CONSULTANCY | MARKET SYNOPSIS

04        NATIONWIDE (APRIL)

       HEADLINES                                                  APR-21                    MAR-21
       Monthly Index*                                             473.7                     464.0
       Monthly Change*                                             2.1%                     -0.3%
       Annual Change                                               7.1%                      5.7%
       Average Price (not seasonally adjusted)                   £238,831                  £232,134
      * Seasonally adjusted figure (note that monthly % changes are revised when seasonal adjustment factors
      are re-estimated)
                                                  Source: Nationwide

4.1   Annual house price growth accelerated to 7.1% in April, only slightly below the peak of
      7.3% recorded in December and up from 5.7% in March. In month-on-month terms,
      house prices rose by 2.1% in April, after taking account of seasonal effects, the biggest
      month rise since February 2004.

4.2   Our research suggests that while the stamp duty holiday is impacting the timing of
      housing transactions, for most people it is not the key motivating factor prompting
      them to move in the first place.

4.3   Housing market activity is likely to remain fairly buoyant over the next six months as a
      result of the stamp duty extension and additional support for the labour market
      included in the Budget, especially given continued low borrowing costs and with many
      people still motivated to move as a result of changing housing preferences in the wake
      of the pandemic.

4.4   With the stock of homes on the market relatively constrained, there is scope for annual
      house price growth to accelerate further in the coming months, especially given the low
      base for comparison in early summer last year. Indeed, if house prices remain flat in
      month-on-month terms over the next two months, the annual rate of growth will reach
      double digits in June.

4.5   If unemployment rises sharply towards the end of the year as most analysts expect,
      there is scope for activity to slow, perhaps sharply.

4.6   However, shifts in housing preferences may continue to support activity, even if labour
      market conditions weaken. Indeed, at the end of April, 25% of homeowners surveyed
      said they were either in the process of moving or considering a move as a result of the
      pandemic, only modestly below the 28% recorded in September last year. Given that
      only around 5% of the housing stock typically changes hands in a given year, it only
      requires a relatively small proportion of people to follow through on this to have a
      material impact.

                                                                                                     PAGE 5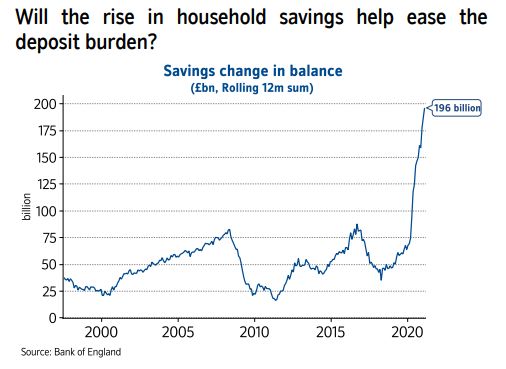
ARK CONSULTANCY | MARKET SYNOPSIS

                                          Source: Nationwide

4.7   “There has been a surge in household deposits since the pandemic struck in early 2020,
      in large part as people were unable to go out and spend on the things they would
      normally purchase. In the 12 months to February 2021, household deposits increased
      by £196 billion, equivalent to around £7,000 per household, and almost three times the
      amount accumulated in the same period the previous year.

4.8   “Given that raising a deposit is the main challenge for most prospective first time
      buyers, where a 10% deposit on the typical first time buyer home is c£19,500, or
      around 50% of gross earnings, this might suggest that the recent rise in savings
      balances will help more first time buyers to enter the housing market.

4.9   “However, the increase in savings has been concentrated amongst older, wealthier
      households. The fact that around a third of first-time buyers in England in 2018/19 said
      that friends or family helped them to raise a deposit through a loan or gift suggests that
      the recent surge in savings will help some, but that the impact won’t be spread evenly.”

4.10 Click here to read more.

PAGE 6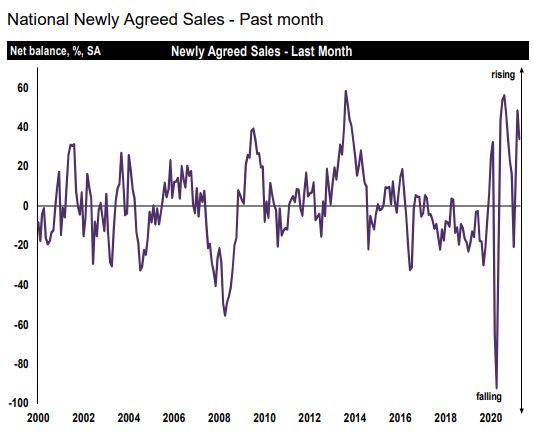
ARK CONSULTANCY | MARKET SYNOPSIS

05        RICS: UK RESIDENTIAL MARKET SURVEY
          (APRIL)
5.1   In terms of new buyer demand, a headline net balance of +44% of contributors cited a
      pick-up in enquiries during April. This is virtually unchanged from a reading of +43%
      previously and therefore remains indicative of a solid uptick in buyer demand. What’s
      more, the new buyer enquiries series is positive, to a greater or lesser degree, across all
      areas of the UK.

5.2   Newly agreed sales also rose over the month, evidenced by a net balance of +34% of
      respondents noting an increase (a slight easing on +48% last time). Looking ahead, near
      term sales expectations remain comfortably positive at the national level, posting a net
      balance of +23%. With regards to the twelve-month view, contributors anticipate a
      cooling in sales growth further ahead, with the headline net balance standing at just
      +12%. When disaggregated, sales expectations for the coming year are significantly
      stronger than the national average in Northern Ireland, Scotland and London.

                                           Source: Nationwide

5.3   The number of fresh listings arriving on the market is insufficient to match the current
      levels of demand. Indeed, the net balance for new instructions fell to -4% in the latest
      results, down from +21% previously. Moreover, stock levels have dropped in recent
      months, with the average number of properties on estate agents’ books now at just 40,
      having briefly stood at 46 back in December.

5.4   The survey’s headline measure of house price growth rose again over the month, with a
      net balance of +75% of respondents noting an increase in prices during April. This is up
      from a reading of +62% back in March and has now become successively more
      elevated in each of the last three reports. Furthermore, all UK regions/countries are
      now seeing a sharp pick-up in house price inflation.

                                                                                         PAGE 7
ARK CONSULTANCY | MARKET SYNOPSIS
5.5 Looking ahead, the near-term price expectations net balance came in at +47%,
marginally higher than the reading of +43% posted last time, and still consistent with
strong house price growth being maintained over the coming three months. Further
ahead, respondents also foresee upwards pressures on prices remaining firm at the
twelve month time horizon, with the latest net balance standing at +68%.
Source: Nationwide
5.6 In the lettings market, tenant demand growth accelerated markedly in the three months
to April (seasonally adjusted quarterly series), registering a net balance reading of +60%
across the UK as a whole. This is up from a balance of +14% back in January, with the
latest pick-up likely aided by the general improvement in the Covid situation across the
UK since then, as well as the recent easing in lockdown restrictions. Nevertheless, a
tight supply backdrop is also evident across the rental market, as new landlord
instructions were more or less stagnant over the latest survey period.
5.7 Click here to read more.
PAGE 8ARK CONSULTANCY | MARKET SYNOPSIS
06 HOMETRACK (APRIL)
6.1 Average house prices rose at 4.1% in the year to April, up from 2.3% in April last year,
but down from 4.7% at the start of the year.
6.2 Prices are being underpinned by demand from buyers continuing to outstrip supply.
Price growth is highest in areas where affordability is greatest. In the year to April,
average prices in Wales rose by 6.3%, followed by Yorkshire & the Humber where
prices rose by 5.4%. London continues to trail when it comes to price growth, at 1.9%,
the slowest regional rate of growth across the UK for the sixth consecutive month.
6.3 On a city level, Liverpool (+6.9%) and Manchester (+6.8%) are registering the highest
price growth of major cities monitored in this report the fifth consecutive months this
has been the case. Across the UK, the demand for family houses continues to put
upwards pressure on this type of home, with average values for houses up +5.2% on
the year, compared to +1.1% growth for flats.
6.4 For some, the need for more space, especially if working from home is to be a more
regular occurrence, has prompted a move. Many older households are also re-
evaluating their housing needs and moving for the first time in many years. First-time
buyers are also becoming more active in the market, with better access to mortgage
finance.
6.5 The stamp duty holiday introduced in July to March, and the subsequent extension to
June and tapered extension to the end of September, has provided an added impetus
for many to purchase a home.
6.6 This demand for homes in the sales market led to a very busy start to the year (as
examined in March house price index report) with £149 billion of homes sold subject to
contract in the first 15 weeks of the year.
PAGE 9ARK CONSULTANCY | MARKET SYNOPSIS
6.7 We expect that activity will remain elevated in H2, albeit not as high as towards the
end of last year. Even so, we expect total sales completions this year will be 1.52
million. This would mark 2021 as the one of the most active sales markets since the
global financial crisis, and as one of the top ten busiest years since 1959.
6.8 Our projections also show that the value of homes sold this year will be £461 billion,
some 46% higher than last year, and 68% higher than in 2019. Since the market opened
up last year, the ‘search for space’ has contributed a rise in the value of homes being
sold. This, as well as added activity, has led to a rise in the total value of sales from
£273 billion in 2019, to £316 billion in 2020 and a projected total of £461 billion in
2021 – boosting revenue pools for agents.
6.9 In turn, the value of mortgage lending is also rising, hitting a record high of £11.3 billion
in March, according to the Bank of England.
6.10 Wales, Yorkshire & the Humber and the North West are the regional markets
registering the highest price growth. The time between a listing a property and securing
a sale subject to contract (SSTC) has fallen by between 10-15 days in the North West,
Wales and Yorkshire & the Humber, and this is accompanied by the highest levels of
price growth.
PAGE 10ARK CONSULTANCY | MARKET SYNOPSIS
6.11 At the other end of the scale, homes are taking just under two months to sell in inner
London, two weeks longer than the 2017-2019 average, making it a relatively cooler
market. Annual price growth is also lagging at +0.3% on the year. Four central London
boroughs are registering price falls for the third or fourth consecutive month, including
the City of London (prices down -2.5% year on year), Westminster (-2.2%), Kensington
& Chelsea (-1.7%) and Hammersmith & Fulham (-1.4%).
6.12 The ‘hottest’ city markets, were homes are being sold more quickly and price growth is
strongest include Wigan, Blackburn and Burnley where time to sell is down by three
weeks or more, and annual price growth is at least 5.8%.
6.13 Five of the 65 cities monitored for this report have registered an increase in time to
sell. Sales are taking longer in Aldershot (+1 day) Southampton (+1 day), Gloucester (+2
days), Edinburgh (+2 days) and Coventry (+8 days) bucking the wider trend of faster
moving markets. However annual price growth remains positive in all these cities.
6.14 While the introduction of the stamp duty holiday has certainly boosted activity, we
believe the once-in-a-generation ‘reassessment of home’ has further to run, a view a
member of the Bank of England’s MPC also shared in a speech last week.
6.15 The easing of lockdowns will cause a natural fall in demand as people are able to see
family and enjoy amenities that have been shut for more than a year, new buyer
demand will still emerge throughout H2 as office-based workplaces confirm if they will
be pursuing more flexible working practices. Households who have the opportunity to
commute less frequently have more options when it comes to choosing where to live,
and this could prompt a move.
6.16 Likewise, older households will continue to review how and where they are living, with
many more set to move for the first time in years. With an increased array of
mortgages to choose from, first-time buyers will also remain active in the market.
PAGE 11ARK CONSULTANCY | MARKET SYNOPSIS
6.17 At the same time, supply constraints will continue underpin pricing. The lack of supply
is expected to hamper potential sales during this year, yet even so, we expect total
transactions this year to rise to 1.5 million, marking one of the busiest years in the UK’s
residential market in more than a decade.
6.18 Click here to read more.
PAGE 12ARK CONSULTANCY | MARKET SYNOPSIS
07 RIGHTMOVE(MAY)
7.1 This month sees a new national record for the price of property coming to market,
hitting an average of a third of a million pounds (£333,564). That is 1.8% (+£5,767)
above the previous all-time high recorded a month ago.
7.2 While the level of new properties coming up for sale is at a similar level to the long-
term average, demand continues to massively exceed supply, especially in northern
regions. In previous market upturns London has generally led the way, but the capital’s
rate of price increase since pre-lockdown March 2020 is now at a virtual standstill
(+0.2%) compared to double digit price growth in areas further north.
7.3 Prospective buyers are now faced with record prices for newly marketed properties in
all regions and countries of Great Britain except London, with three areas seeing
average rises of over 10% in the closest available year-on-year comparison.
7.4 Our year-on-year comparisons compare March 2020 to May 2021, as the property
market was suspended for most of April and May last year. Wales is growing the fastest
at +13.0%, followed by North West (+11.1%), and Yorkshire & the Humber (+10.5%).
The average increase for all regions outside of the South of England is 9.7% (+£19,497).
7.5 In contrast London lags behind at +0.2% (+£1,547), though it must be stressed that
within the capital there are widely varying local markets and market sectors, with some
rising in price and others static or falling.
7.6 This strong market appears to have enough momentum to shrug off the imminent end
of the stamp duty holidays in England and Wales. Buyer demand has soared throughout
Great Britain (+52% in April 2021 versus April 2019), with similarly strong levels in
London (+48%).
7.7 But it is the north that is seeing the greater imbalance between demand and supply and
this is one of the main factors driving prices to new records in all regions except the
capital. This supply shortage is particularly marked for typical family homes with three
bedrooms or more, with available stock for sale on agents’ books in April down by an
average of 50% on the same period in 2019. In contrast properties with two bedrooms
or fewer have availability down by 24%.
PAGE 13ARK CONSULTANCY | MARKET SYNOPSIS
Source: Nationwide
7.8 Click here to read more.
ARK Consultancy Limited
June 2021
PAGE 14ARK CONSULTANCY | MARKET SYNOPSIS
If you need help or advice on any aspect of this
report, please contact:
Chris Seeley – Director
Email: cseeley@arkconsultancy.co.uk
Telephone: 07770532571
PAGE 15You can also read