Monthly Market Synopsis - We are Property People who are passionate about Performance and Progression - Ark Consultancy
←
→
Page content transcription
If your browser does not render page correctly, please read the page content below
ARK CONSULTANCY | MARKET SYNOPSIS

We are Property People who
are passionate about
Performance and Progression.

Monthly Market
Synopsis
COVERING THE PERIOD END TO JANUARY 2021
ARK CONSULTANCY | MARKET SYNOPSIS

01        COMMENTARY
      Welcome to the latest edition of ARK’s market synopsis report
      covering market outcomes to the end of January 2021 and with
      Rightmove picking up reporting for February 2021 .

1.1   There is an interesting difference in outlook starting to appear between the
      commentators this month. Halifax, who have been toward the gloomier end of the
      medium and longer-term outlook continue in a similar vein together with the RICS and
      Nationwide.

1.2   Hometrack and Rightmove are in a brighter place. Obviously, the reports are not yet
      able to factor in the influence of the Chancellors announcements which will potentially
      have a positive impact on demand.

1.3   We have commented before that the underlying element in the market is a lack of
      production, we are still woefully short of completing 300,000 homes per annum to
      meet latent demand.

1.4   Changes in the way people live and work post the pandemic will continue the “race for
      space”; that is good indoor space standards and good private or communal spaces. The
      “drive to the countryside” is likely to see more rural developments outperform city and
      suburban schemes for the foreseeable future.

02        HIGHLIGHTS
2.1   In Halifax’s reporting for January, UK house price slipped by -0.3%, marking the biggest
      monthly fall since April last year. The average house price came in at £251,968 –
      around £13,000 higher than a year ago. Market activity seems to be slowing down with
      the annual rate of house inflation sitting at 5.4% - lowest level since August 2020.

2.2   Furthermore, Halifax says, “agreed sales remain well above pre-pandemic levels but
      new instructions to sell have decreased noticeably, and total stock held by estate
      agents has risen to its highest level since before the EU referendum in 2016.”

2.3   Like Halifax, Nationwide also noted that house prices month-on-month fell by 0.3% -
      the first decline since June 2020. In addition, annual rate of house growth slowed to
      6.4% from a reading of 7.3% in December.

2.4   The slowdown is said to be due to the initial deadline of the stamp duty holiday. But as
      we saw earlier this month, Chancellor Rishi Sunak unveiled in his 2021 budget that he
      will be extending the stamp duty holiday until June, after that the nil rate band will be
      set at £250,000 until the end of September. We are hoping that market activity will
      pick up post this announcement and await later reporting to see the effects.

2.5   Nationwide also mentions “The total number of mortgages approved for house
      purchases in 2020 actually exceeded the number approved in 2019, and house price
      growth ended 2020 at a six-year high, even though the economy was probably around
      10% smaller than at the start of 2020, with the unemployment rate around a
      percentage point higher.”

PAGE 2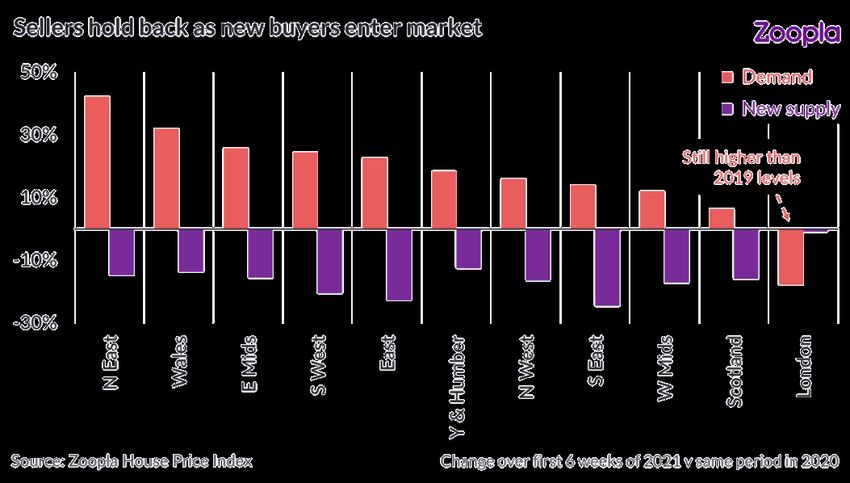
ARK CONSULTANCY | MARKET SYNOPSIS
2.6 Moving to the RICS reporting, things are starting to look a little pessimistic, “A net
balance of -28% of respondents reported a decline in new buyer enquiries over the
month. This latest return brings to an end a run of seven consecutive positive monthly
readings beforehand, and is consistent with a noticeable drop off in demand.”
2.7 RICS also reported a decline in the number of listings being brought onto the market,
with a net balance of -38% of respondents noting a decline.
2.8 Agreed sales also took a downward turn with a national net balance of -18% of
respondents citing a fall (+15% in December). Looking at the regional breakdown, East
Midlands, South West and Yorkshire & the Humber all returned negative net balance
readings.
2.9 With that said, +50% of survey participants noted an increase in house prices although
slightly down on +63% posted in November and December. Looking forward “a net
balance of +30% of respondents anticipate prices will increase over the year to come
(up slightly from a figure of +24% beforehand). All UK regions/countries are expected
to see prices rise to some degree in the next twelve months, with Wales, Northern
Ireland and Scotland all exhibiting especially strong projections.”
2.10 Interestingly, Hometrack reported house prices rose by 0.3% in January. The annual
rate of growth was recorded at 4.3% - the highest growth rate since April 2017.
Manchester and Liverpool register the strongest price growth with an annual growth of
6.3% and 6.8%.
2.11 Demand remains high as the ‘search for space’ continues. However, the number of
properties being listed are not able to keep up with demand and therefore is creating
upward pressure on house prices.
2.12 Hometrack identifies signs of increasing activity among first-time buyers. This relates to
the increased selection of mortgages available for those with only a 5% or 10% deposit.
And as more first-time buyers enter the market it is only more likely to widen the
mismatch between supply and demand as first-time buyers do not have a property to
list for sale.
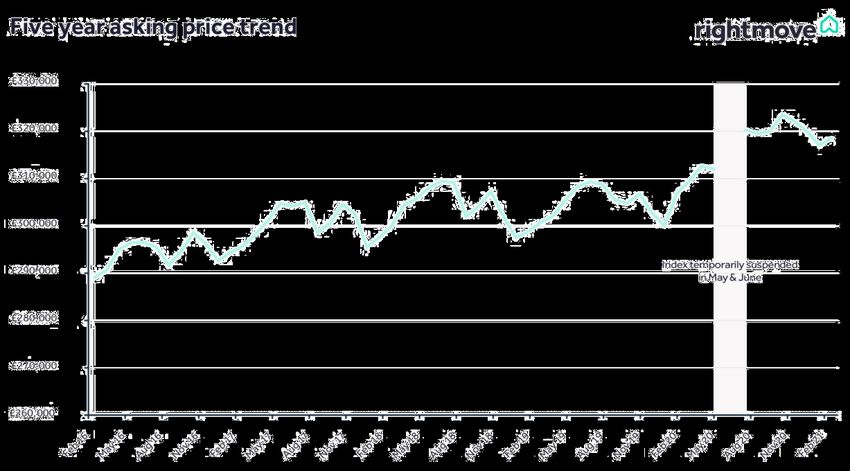
2.13 Finally, within the Rightmove reporting, the average price coming to market rises by
0.5% (+£1,522) in February. Rightmove states "This is being fuelled by both a shortage
of supply with fewer new sellers coming to market and increased demand, with all our
indicators of buyer activity being ahead of the same period last year."
PAGE 3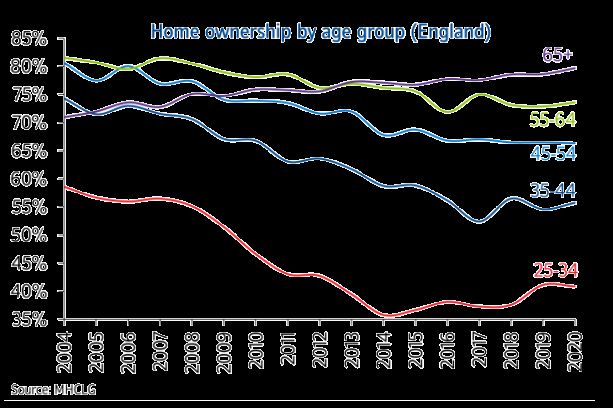
ARK CONSULTANCY | MARKET SYNOPSIS

03                      HALIFAX (JANUARY 2021)
3.1   The average UK house price slipped by -0.3% in January, the biggest monthly fall since
      April last year. Whilst this pushed the typical property value down to its lowest level
      since October, at just under £252,000, prices are around £13,000 higher than a year
      ago.

3.2   There are some early signs that the upturn in the housing market could be running out
      of steam, with the annual rate of house price inflation cooling to its lowest level since
      August. Industry figures for agreed sales remain well above pre-pandemic levels but
      new instructions to sell have decreased noticeably, and total stock held by estate
      agents has risen to its highest level since before the EU referendum in 2016.

3.3   How far and how deep any slowdown proves to be is a challenge to predict given the
      prevailing uncertainty created by the pandemic. With swathes of the economy still
      shuttered, and joblessness continuing to edge higher, on the surface this points to
      slower market activity and downward price pressures in the near-term.

3.4   That said, we saw the power of homeowners to drive the market in the second half of
      last year as many people looked to find new properties with greater space, spurred on
      by increased time spent at home. Such structural demand changes, coupled with any
      further policy interventions by government, could yet sustain underlying market
      activity for some time to come.

                                                                              Halifax House Price Change %
                                             9.0
         % Change seasonally adjusted HPI

                                             8.0
                                             7.0
                                             6.0
                                             5.0
                                             4.0
                                             3.0
                                             2.0
                                             1.0
                                             0.0
                                            -1.0
                                            -2.0
                                                                                                                                                      Nov-20

                                                                                                                                                               Dec-20
                                                                                Apr-20

                                                                                             May-20

                                                                                                                  Jul-20
                                                   Jan-20

                                                                                                                                                                        Jan-21
                                                                     Mar-20

                                                                                                      Jun-20
                                                            Feb-20

                                                                                                                                    Sep-20

                                                                                                                                             Oct-20
                                                                                                                           Aug-20

                                                                                Monthly                        Quarterly              Annual
                                                                                Change                         Change                 Change
                                                                                %                              %                      %

                                                                                         Source: Halifax, IHS Markit

3.5   Click here to read more.

PAGE 4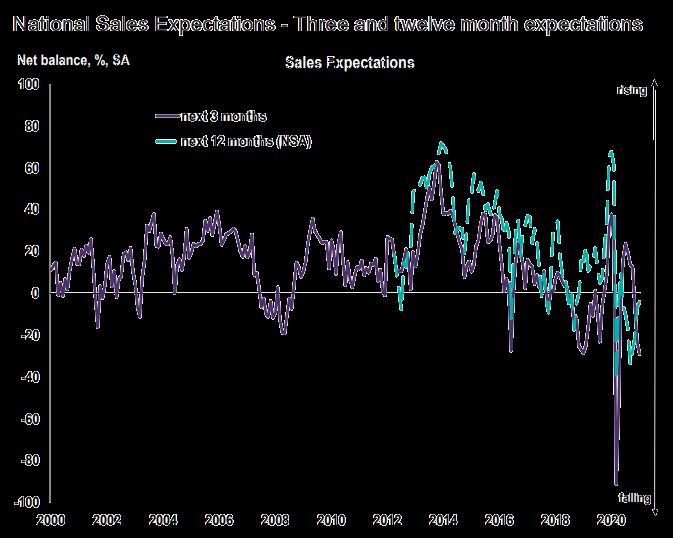
ARK CONSULTANCY | MARKET SYNOPSIS

04        NATIONWIDE (JANUARY 2021)

       HEADLINES                                                  JAN-21                    DEC-20
       Monthly Index*                                              460.7                      462.0
       Monthly Change*                                             -0.3%                      0.9%
       Annual Change                                                6.4%                      7.3%
       Average Price (not seasonally adjusted)                   £229,748                   £230,920
      * Seasonally adjusted figure (note that monthly % changes are revised when seasonal adjustment factors
      are re-estimated)

      Source: Nationwide

4.1   January saw the annual rate of house price growth slow modestly to 6.4%, from 7.3%
      in December. House prices fell by 0.3% month-on-month, after taking account of
      seasonal effects – the first monthly decline since June.

4.2   The slowdown probably reflects a tapering of demand ahead of the end of the stamp
      duty holiday, which prompted many people considering a house move to bring forward
      their purchase. While the stamp duty holiday is not due to expire until the end of
      March, activity would be expected to weaken well before that, given that the purchase
      process typically takes several months.

4.3   The total number of mortgages approved for house purchases in 2020 actually
      exceeded the number approved in 2019, and house price growth ended 2020 at a six-
      year high, even though the economy was probably around 10% smaller than at the start
      of 2020, with the unemployment rate around a percentage point higher.

                                                Source: Nationwide

4.4   Looking ahead, shifts in housing preferences are likely to continue to provide some
      support for the market. However, if the stamp duty holiday ends as scheduled, and
      labour market conditions continue to weaken as most analysts expect, housing market
      activity is likely to slow, perhaps sharply, in the coming months.

                                                                                                     PAGE 5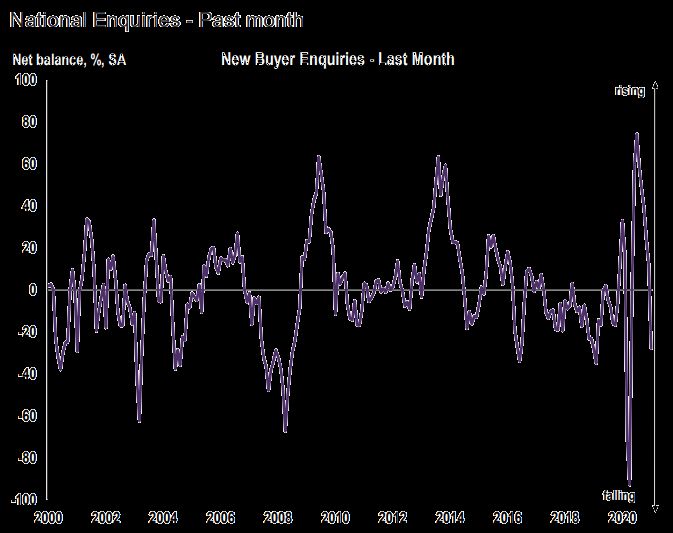
ARK CONSULTANCY | MARKET SYNOPSIS

4.5   The latest English Housing Survey published by the Ministry of Housing, Communities
      & Local Government (MHCLG) indicated a slight increase in the home ownership rate in
      2020, to 64.6% (from 63.8% in 2019). This is the third year in a row that the home
      ownership rate has increased, though it remains well below its 2003 peak of 70.9%.

4.6   Both the number of people owning their home with a mortgage and those owning
      outright increased compared with a year ago. More than half (54%) of the 15.4 million
      households in England own their home outright, with the majority (5.2 million or 63%)
      aged 65 or over.

                                           Source: Nationwide

4.7   There was also a slight uptick in home ownership rates for those aged 35 to 44 and 55
      to 64. The rise in the home ownership rate for those aged 25 to 34 seen in the last
      couple of years held broadly steady at 41% in 2020. “Conversely, the number of
      privately rented households fell to 4.4 million (from 4.6 million in 2019), resulting in a
      slight decline in the proportion of households that rent privately to 18.7% (from
      19.3%).

4.8    “London stands out as having a significantly different mix, with only 50% owning their
      own home and 28% privately renting. Indeed, London accounts for nearly a quarter of
      all privately rented households, though it only accounts for 15% of all households.

4.9   Click here to read more.

PAGE 6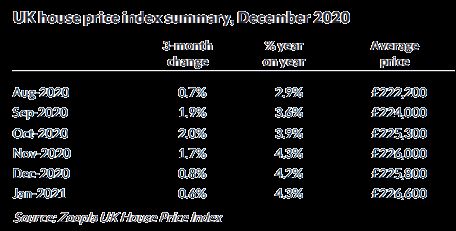
ARK CONSULTANCY | MARKET SYNOPSIS

05        RICS: UK RESIDENTIAL MARKET SURVEY
          (JANUARY 2021)
5.1   A net balance of -28% of respondents reported a decline in new buyer enquiries over
      the month. This latest return brings to an end a run of seven consecutive positive
      monthly readings beforehand, and is consistent with a noticeable drop off in demand.

                             Source: RICS UK Residential Market Survey

5.2   There was also a decline in the number of fresh listings being brought onto the market,
      evidenced by a net balance of -38% of respondents noting a fall. Prior to January, new
      instructions had increased, to a greater or lesser degree, in each report since May 2020.

5.3   Looking ahead, the number of appraisals undertaken over the month was reportedly
      below that of the corresponding period last year (net balance -26%) suggesting that the
      pipeline for new instructions has also softened of late.

5.4   A national net balance of -18% of respondents cited a fall in agreed sales during
      January, down from a positive reading of +15% in December. In terms of the regional
      breakdown, contributors in the East Midlands, South West and Yorkshire & the
      Humber all returned particularly negative net balance readings this time out.

5.5   Near term sales expectations remain subdued at the national level, returning a net
      balance of -29% (down slightly from -23% previously). The twelve-month outlook
      appears more or less flat, with the net balance coming in at -4% compared with -6% in
      December.

                                                                                       PAGE 7
ARK CONSULTANCY | MARKET SYNOPSIS
Source: RICS UK Residential Market Survey
5.6 Despite the softer tone across the range of sales market activity indicators this month,
house prices continue to be driven higher for the time being. A net balance of +50% of
survey participants saw an increase in January, thereby still signalling a significant
degree of upward pressure on prices (albeit this is down slightly on +63% posted in
both November and December).
5.7 The disaggregated results show house prices continue to rise firmly in virtually all parts
of the UK. London remains the sole exception, where a net balance of -9% of
respondents noted a fall in prices over the latest survey period. This marks the first
negative reading for the survey’s measure of price growth across the capital since July
2020.
5.8 Back at the national level, a net balance of +30% of respondents anticipate prices will
increase over the year to come (up slightly from a figure of +24% beforehand). All UK
regions/countries are expected to see prices rise to some degree in the next twelve
months, with Wales, Northern Ireland and Scotland all exhibiting especially strong
projections.
5.9 Click here to read more.
PAGE 8ARK CONSULTANCY | MARKET SYNOPSIS
06 HOMETRACK (JANUARY 2021)
6.1 House prices climbed by 0.3% in January, taking the annual rate of growth to 4.3%,
matching the highest rate of growth since April 2017. Price growth at a country and
regional level ranges from 2.8% in London to 5.5% in the North West of England and
5.6% in Wales. Meanwhile Manchester and Liverpool are the cities registering the
strongest price rises, with annual house price growth of 6.3% and 6.8% respectively.
6.2 Buyer demand has remained strong through the first six weeks of 2021. It is up 12.4%
compared to the same point last year - when demand rebounded after the General
Election result in December 2019.
6.3 Robust levels of demand signals the continuation of a trend that we have highlighted
since the summer last year. While stamp duty has prompted higher levels of activity,
there is still a cohort of buyers and movers who are looking for a new home after a
reassessment of how and where they are living after repeated lockdowns, and the rise
of working from home. The data points towards a ‘search for space’ among some
buyers. As demand remains high, the number of homes being listed for sale is not
keeping pace, putting sustained upward pressure on pricing.
6.4 There are two reasons why new supply is currently constrained. Some sellers are
pressing pause on inviting potential buyers into their homes for viewings during the
current lockdown. We expect the flow of new supply to speed up once lockdowns
ease. The data also signals a second factor emerging; increased demand from first time
buyers who have no property to sell when they move.
6.5 The mismatch between supply and demand is still evident in most regions across the
country. Demand levels in the North East are running more than 40% higher so far this
year than over the same period last year, while new supply has shrunk. The exception is
London, where demand levels have fallen year-on-year. However, there is a caveat
here. Demand levels in London may be down 17% on an annual basis, but this is
compared to a period in 2020 when there was a major surge in activity after the
Election result in December 2019 with activity levels rising off a relatively lower base.
If we compare current London demand figures to previous years, they are still well
ahead of the average.
PAGE 9ARK CONSULTANCY | MARKET SYNOPSIS
6.6 As we move into 2021 however, there are signs of increasing activity among first-time
buyers. Our data shows that buyer demand from first-time buyers across the UK is up
5% in the first six weeks of the year compared to Q4. This chimes with an increased
array of mortgages available for those with only a 5% or 10% deposit. While mortgage
lending levels in this sector are not nearly back to where they were in early 2020, the
number of lenders offering such deals has risen since Q4 last year.
6.7 We have also registered an increase in the number of sales agreed between £100,000
and £250,000, which climbed by 18% in the first seven weeks of the year. Buyers of
lower-value properties tend to be more reliant on the availability of mortgage finance,
especially at higher loan-to-values, and the return of activity in these price bands
suggests a return to the market of purchasers who struggled to get finance in 2020.
6.8 As more first-time buyers enter the market, it is likely to further exacerbate the
imbalance between supply and demand in many parts of the market, as first-time
buyers do not have a home to list for sale.
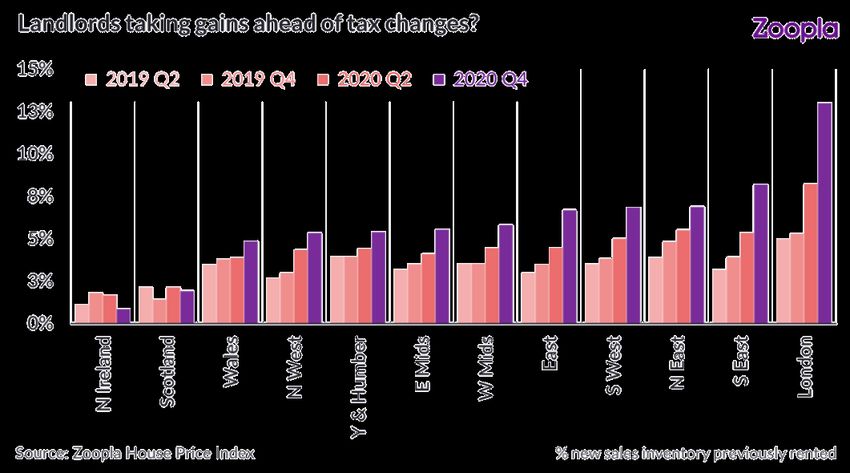
6.9 Many first-time buyers will be entering the sales market from the rental market. And
we are seeing some supply coming from this sector as landlords put homes up for sale.
And we are seeing some supply coming from this sector as landlords put homes up for
sale.
PAGE 10ARK CONSULTANCY | MARKET SYNOPSIS
6.10 Landlords are reassessing their portfolios for several reasons. Firstly, there has been
increasing discussion about a potential rise in capital gains tax for those selling
additional properties. This may be prompting some landlords to crystallise capital gains
before any new rules might be implemented. Secondly, some landlords are reacting to
current conditions in the rental market with negative pressure on rents in some city
centres.
6.11 Finally, the more buoyant sales market may be prompting some landlords to take
action. This is a material trend given the constrained supply of homes for sale in the
market at present. However, in the wider context of the private rented sector, it is still
a small movement. The rented homes being put up for sale in the second half of 2020
account for less than 1% of private rented sector stock.
6.12 The data points towards sustained buyer demand throughout Q1 as pent-up activity
among first-time buyers is released amid a noticeable step up in availability of low-
deposit mortgage finance.
6.13 The ‘search for space’ among existing homeowners is set to continue, especially in light
of the current sustained lockdown. Sales are still being driven by homeowners deciding
that they want to live in a larger home, or a home with more outside space. Others are
being motivated by the opportunity to live in a different location due to the rise in
working from home.
6.14 As the vaccine roll-out continues to gather momentum, and COVID-19 cases start to
recede, we also expect more demand from the sellers who have currently pressed
pause on inviting buyers into their homes. Increased confidence around the UK’s
response to the pandemic, and opening up of the economy, will likely mean a
resumption of activity among these sellers. This in turn will create additional demand as
they start to plan their next move. All of these factors will support activity into the
middle of 2021. We still expect house price growth to ease as we move through H2 in
more challenging economic conditions, ending the year at +1%.
6.15 Click here to read more.
PAGE 11ARK CONSULTANCY | MARKET SYNOPSIS
07 RIGHTMOVE (FEBRUARY 2021)
7.1 After three consecutive monthly falls, the average price of property coming to market
has risen by 0.5% (+£1,522) this month. This is being fuelled by both a shortage of
supply with fewer new sellers coming to market, and increased demand, with all our
indicators of buyer activity being ahead of the same period last year. This new buyer
demand surge is building momentum, and as it is now far too late to realistically
complete a new purchase before the stamp duty holiday ends on the 31st March, it
would appear that many buyers’ desires to move are not dependent on the potential
saving.
7.2 Despite the very minimal chance of benefitting from the stamp duty savings, the
number of purchases agreed is currently up by 7%. The pipeline for future sales is
looking even stronger, with the number of prospective buyers sending enquiries to
estate agents up by 18%, and the number of visits to Rightmove up by 45%. This high
buyer demand is outstripping new supply and helping to edge up prices despite the
challenging economic backdrop.
7.3 The number of new sellers coming to market is 21% down over the last four weeks
when compared with the prior year. Worst affected are the sectors one might expect
to be juggling home-schooling responsibilities alongside daily life, which appear to be
delaying some owners of family homes from coming to market. The ‘second-stepper1’
and ‘top of the ladder2’ sectors with three bedrooms or more see 25% fewer new
listings between them. In contrast, properties with two bedrooms or fewer are only
down by 16%.
Source: Rightmove
7.4 Click here to read more.
ARK Consultancy Limited
February 2021
1
Second-stepper: This figure represents the typical property of a person moving from their first home, covering all
three and four bed properties that come to market (houses and flats) excluding four bed detached houses.
2 Top of the ladder: This figure represents asking prices at the top end of the market, covering all five bed
properties and above (houses and flats), as well as four bed detached houses.
PAGE 12ARK CONSULTANCY | MARKET SYNOPSIS
If you need help or advice on any aspect of this
report, please contact:
Chris Seeley – Director
Email: cseeley@arkconsultancy.co.uk
Telephone: 07770532571
PAGE 13You can also read