Coronavirus: Impact on the labour market - By Andrew Powell, Brigid Francis-Devine 19 August 2021 - UK Parliament
←
→
Page content transcription
If your browser does not render page correctly, please read the page content below
By Andrew Powell,
Brigid Francis-Devine   Coronavirus: Impact on the
19 August 2021          labour market

                        Summary
                        1  Labour Market Statistics
                        2 Job support schemes
                        3 Most affected workers

                        commonslibrary.parliament.uk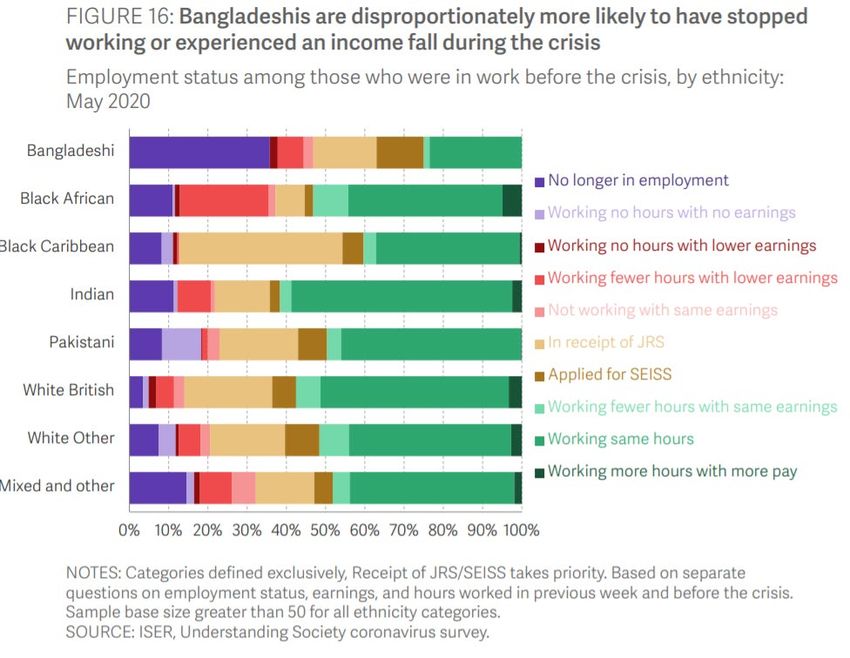
Number CBP8898             Coronavirus: Impact on the labour market

Disclaimer
The Commons Library does not intend the information in our research
publications and briefings to address the specific circumstances of any
particular individual. We have published it to support the work of MPs. You
should not rely upon it as legal or professional advice, or as a substitute for
it. We do not accept any liability whatsoever for any errors, omissions or
misstatements contained herein. You should consult a suitably qualified
professional if you require specific advice or information. Read our briefing
‘Legal help: where to go and how to pay’ for further information about
sources of legal advice and help. This information is provided subject to the
conditions of the Open Parliament Licence.

Feedback
Every effort is made to ensure that the information contained in these publicly
available briefings is correct at the time of publication. Readers should be
aware however that briefings are not necessarily updated to reflect
subsequent changes.

If you have any comments on our briefings please email
papers@parliament.uk. Please note that authors are not always able to
engage in discussions with members of the public who express opinions
about the content of our research, although we will carefully consider and
correct any factual errors.

You can read our feedback and complaints policy and our editorial policy at
commonslibrary.parliament.uk. If you have general questions about the work
of the House of Commons email hcenquiries@parliament.uk.

                           2                                          Commons Library Research Briefing, 19 August 2021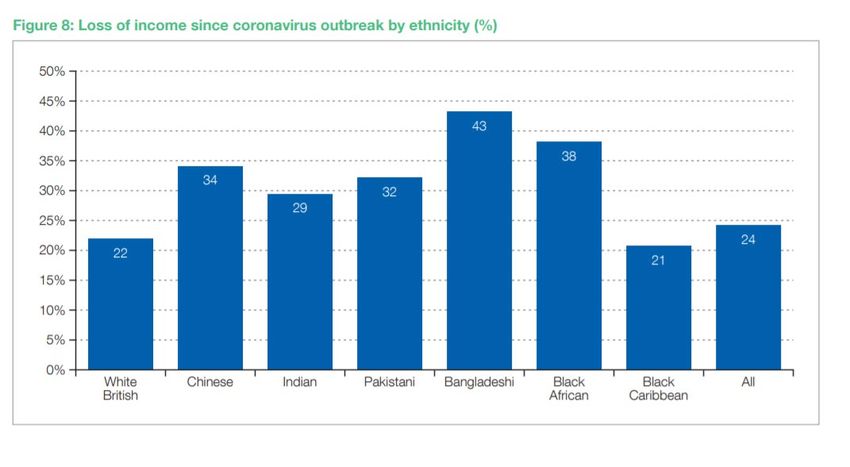
Coronavirus: Impact on the labour market

Contents

Summary                                                                                   4

1      Labour Market Statistics                                                           5

1.1    Payrolled employees                                                                5
1.2    Labour market status                                                              6
1.3    Redundancies                                                                      8
1.4    Vacancies                                                                         9
1.5    Working hours                                                                     9
1.6    Earnings                                                                         10
1.7    People claiming unemployment benefits                                            10

2      Job support schemes                                                               12

Coronavirus Job Retention Scheme (CJRS)                                                  12
Self-employed Income Support Scheme (SEISS)                                              13

3      Most affected workers                                                             15

3.1    Workers from minority ethnic groups                                               15
3.2    Women                                                                             17
3.3    Young and older workers                                                          18
3.4    Low paid workers                                                                 19
3.5    Disabled workers                                                                 20

3                                          Commons Library Research Briefing, 19 August 2021
Coronavirus: Impact on the labour market

Summary

This paper tracks the evolving impact of the coronavirus outbreak on the
labour market.

On 17 August, the labour market statistics for April-June 2021 were published.

These statistics suggest a continued recovery for the UK labour market, with
some of the labour market indicators returning to pre-pandemic levels.
Employment levels have been increasing in recent months, while
unemployment levels have been falling. However, increases in unemployment
continue to be forecast for when the Coronavirus Job Retention scheme
comes to a close later this year.

To date, the pandemic has had more of an impact on the labour market
status of particular age groups.

Young workers and older workers have been most likely to have left
employment, and also most likely to have become economically inactive.
However, the larger rises in unemployment have been for those aged between
25 and 64.

The number of people claiming unemployment related benefits fell by 7,800 in
the month to July 2021 but remains 1.0 million higher than in March 2020.

1.9 million jobs were on furlough through the Government's Coronavirus Job
Retention Scheme (CJRS) as at 31 May 2021. The number of jobs that are
furloughed has been gradually falling since the end of January when 4.9
million jobs were furloughed. Over 11.6 million jobs have been furloughed
since the start of the scheme.

The fourth grant of the Government’s Self-Employment Income Support
Scheme (SEISS) opened for applicants on the 22 April 2021. By 6 June 2021, 2.0
million claims had been made.

Some workers are disproportionally economically impacted by the
coronavirus outbreak. Workers who are from an ethnic minority group,
women, young workers, low paid workers and disabled workers, have been
most negatively economically impacted by the coronavirus outbreak.

4                                          Commons Library Research Briefing, 19 August 2021
Coronavirus: Impact on the labour market

1     Labour Market Statistics

      On 17 August the latest labour market statistics were published by the Office
      for National Statistics (ONS). This section provides an overview of the data
      that was published.

      These statistics suggest a continued recovery for the UK labour market, with
      some of the labour market indicators returning to pre-pandemic levels.
      Employment levels have been increasing in recent months, while
      unemployment levels have been falling. However, increases in unemployment
      continue to be forecast for when the Coronavirus Job Retention scheme
      comes to a close later this year.

1.1   Payrolled employees

      Since the start of the pandemic the ONS has been publishing experimental
      monthly estimates of payrolled employees using HMRC PAYE data. As the
      official employment statistics have a time lag (as detailed in section 1.2, the
      latest data is for March-May 2021), this data provides a timelier indicator of
      the impact of the pandemic on employment. The ONS have reported that this
      data is currently the best source for the overall number of employees. 1

      The number of payrolled employees increased month-on-month in July 2021
      by 182,000, but remains 201,000 below the pre-pandemic levels of February
      2020, a fall of 0.7%. 2

      There was a large fall between March and May 2020 when the number of
      payrolled employees fell by 652,000, and they continued to fall at a slower
      rate until November 2020. In this month, the number of payrolled employees
      was 969,000 below February 2020 levels, Since then employee numbers have
      been steadily increasing, with 767,000 more payrolled employees in July 2021
      than in November 2020.

      The fall since February 2020 for payrolled employees under the age of 25 was
      150,000, or 4%, meaning that 75% of the fall in this period for all payrolled
      employees was for young people.

      The industries that saw the largest percentage falls in the number of
      payrolled employees between February 2020 and July 2021 were the Arts,

      1
          ONS, Measuring the labour market during the pandemic, 12 October 2020
      2
          ONS, Earnings and employment from Pay As You Earn Real Time Information, UK, 17 August 2021

      5                                                  Commons Library Research Briefing, 19 August 2021
Coronavirus: Impact on the labour market
entertainment and recreation sector, with an 12% fall, and the
Accommodation and food service sector, with a 8% fall.
1.2 Labour market status
The latest published employment and unemployment statistics are for April-
June 2021, and by comparing this quarter with the pre-pandemic quarter of
January-March 2020, we get an indication of the impact that the pandemic
has had on the labour market. 3
During this period, young workers and older workers have been most likely to
have left employment, and also most likely to have become economically
inactive. However, the larger rises in unemployment have been for those aged
between 25 and 64.
Employment
There were 32.27 million people in employment in April-June 2021, which
compared to 33.01 million in January-March 2020. Between these two
quarters, employment levels for people aged 16+ fell by 736,000, a fall of
2.2%.
The employment rate (the proportion of 16-64 year olds in work) has fallen
from 76.3% to 75.1%.
There was a fall in employment levels throughout 2020 following the start of
the pandemic, with levels dropping down to 32.11 million in November 2020-
January 2021. Since then, employment levels have begun to recover, and in
the quarter to April-June 2021 employment levels have increased by 95,000.
To date, the pandemic has had more of an impact on employment levels for
particular age groups. 4
Since the start of the pandemic, employment levels have fallen for young
people aged 16-24 by 7%, while they have fallen for older workers aged 65+
by 9%. In comparison, employment levels for those aged 25-64 have also
fallen, but by only 1.2%.
There has been an increase in the number of young people in employment in
recent months. 89,000 more 16-24 year olds were in employment in April-
June 2021 than in the previous quarter, an increase of 3%.
3
ONS, Labour market overview, UK, 17 August 2021
4
ONS, A05 SA: Employment, unemployment and economic inactivity by age group, 17 August 2021
6 Commons Library Research Briefing, 19 August 2021Coronavirus: Impact on the labour market
•
Chart 1
Larger falls in employment for young and older workers
Fall in employment levels, Jan-Mar 2020 to Apr-Jun 2021, thousands
-50
-100 -81
-90
-124 -126
-150 -132
-200 -184
16-17 18-24 25-34 35-49 50-64 65+
Source: ONS, Table A05, Employment, unemployment and economic inactivity by age group (seasonally
adjusted), 15 July 2021
Further analysis of the impact of the pandemic on young and older workers is
provided in section 3.3 of this paper.
The fall in employment has been driven by the private sector. In the year to
March 2021, employment levels in the private sector fell by 2.8%, while they
increased in the public sector by 2.9%.
Before the pandemic the percentage of all workers who worked in the private
sector had been steadily increasing since 2010. The pandemic has reversed
this pattern.
Unemployment
There were 1.60 million people who were unemployed in April-June 2021,
which compared to 1.37 million in January-March 2020. Between these two
quarters, unemployment levels for people aged 16+ have increased by
226,000, an increase of 16%.
The unemployment rate (the proportion of economically active people aged
16+ who are unemployed) has risen from 4.0% to 4.7%.
As with employment, the pandemic has had more of an impact on the
unemployment levels for particular age groups, but this time the impact has
been mainly on those aged 25-64. The increase for this group was 222,000,
which was 98% of the total increase in unemployment. This age group makes
up 84% of the total economically active population.
7 Commons Library Research Briefing, 19 August 2021Coronavirus: Impact on the labour market
Despite the larger falls in employment for young and older workers, there has
only been a small increase in unemployment for these groups. Instead, there
has been a rise in the number who are economically inactive.
A larger rise in unemployment is forecast for when the Coronavirus Job
Retention Scheme (CJRS) ends.
The Treasury’s July 2021 survey of independent forecasts for the
unemployment rate showed an average forecast of 5.4% for Quarter 4 2021
and 4.7% for Quarter 4 2022. 5
In its March 2021 Economic and fiscal outlook, the OBR projected that
unemployment will peak at 6.5% (2.2 million) in Q4 2021, once the CJRS has
closed. 6
After Q4 2021, they project the unemployment rate will decrease slowly,
reaching 5.0% (the rate in Q4 2020), again by Q3 2023.
Economic Inactivity
There were 8.73 million people aged 16-64 who were economically inactive in
April-June 2021, which compared to 8.46 million in January-March 2020.
Between these two quarters, economically inactivity levels for people aged
16-64 have increased by 265,000, an increase of 3.1%.
The economic inactivity rate (the proportion of people aged 16-64 who are
inactive) has risen from 20.4% to 21.1%.
The biggest increases in the levels of economic inactivity are for the 16-17 age
group, which increased by 114,000, and the 50-64 age group which increased
by 144,000.
The was a fall in levels of economic inactivity for the 25-49 age group, and a
corresponding rise in unemployment.
1.3 Redundancies
In April-June 2021, the recorded level of redundancies was 99,000, which was
52,000 less than the previous quarter and 35,000 less than the previous
year. 7
The recorded level of redundancies in September-November 2020 was the
highest in any quarter since records began in 1995, at 402,000. Since then
levels have been falling and are now at pre-pandemic levels.
5
HM Treasury, Forecasts for the UK economy publication, 21 July 2021
6
OBR, Economic and fiscal outlook – March 2021, 3 March 2021, p13
7
ONS, RED02: Redundancies by age, industry and region, 17 August 2021
8 Commons Library Research Briefing, 19 August 2021Coronavirus: Impact on the labour market
The largest number of redundancies in this quarter was in the Manufacturing
sector, with 15,000 redundancies, followed by the Wholesale, retail & repair
of motor vehicles sector with 14,000 redundancies.
1.4 Vacancies
The level of job vacancies is now above their pre-pandemic levels, and were
at their highest level in May-July 2021 since comparable records began in
2001.
In this quarter there were 953,000 job vacancies, 290,000 higher than the
previous quarter, and 578,000 higher than a year previously. This was
168,000 more than in January-March 2020. 8
One of the earliest indicators of the impact that the pandemic was having on
the labour market was a record fall in the number of job vacancies in April-
June 2020. The number of vacancies in that 3-month period was at a record
low of 340,000. This was 445,000 less than in January-March 2020. Since
then the number of vacancies has been steadily recovering, and have risen
quickly in recent months.
Retail was the only industry sector with a lower number of vacancies in May-
July 2021 than in January-March 2021, with a fall of 10,000.
In March-May 2021 there were 1.8 unemployed people per every job vacancy,
which was equal to the number of unemployed people per vacancy in
January-March 2020. The number of unemployed people per vacancy
increased following the pandemic, and rose up to 4.1 unemployed people per
job in April-June 2020.
1.5 Working hours
Having fallen as a result of the January 2021 lockdown, the total number of
weekly hours worked increased in the three months to June 2021. They were
up 51 million hours on the quarter, and by 156 million hours from the year
before. However, 30 million fewer hours were worked than in January-March
2020. 9
A large fall in working hours was another early indicator of the pandemic’s
labour market impact as millions of people were furloughed after the
introduction of the job retention scheme in April 2020. The total number of
8
ONS, Vacancies and jobs in the UK, 17 August 2021
9
ONS, HOUR01 SA: Actual weekly hours worked (seasonally adjusted), 17 August 2021
9 Commons Library Research Briefing, 19 August 2021Coronavirus: Impact on the labour market
hours worked fell to 845 million hours in April-June, its lowest level since
1994.
The average weekly hours worked in March-May 2021 was 31.0 hours, down
from 31.3 hours in January-March 2020.
1.6 Earnings
Earnings growth fell and briefly became negative during the first lockdown, in
part due to many furloughed workers receiving only 80% of their usual
wages. However, since then real pay has been growing quickly. This is in stark
contrast to what happened to earnings after the financial crisis, when real
earnings growth turned negative and took more than a decade to return to
pre-crisis levels. 10
In the three months to June 2021, annual growth in pay in Great Britain is
estimated to be 6.6% including bonuses and 5.3% excluding bonuses, after
adjusting for inflation. 11
The ONS have reported that this growth in pay is partly due to compositional
effects. Lower paid workers are more likely to lose their jobs, so the average
person still in work is higher paid. Furthermore, the latest three-month period
is compared with the three months to June 2020, when earnings were already
affected by the pandemic.
1.7 People claiming unemployment benefits
In August, the ONS published July 2021 figures for the number of people
claiming unemployment related benefits (the unadjusted claimant count).
This is a useful data source for tracking changes in the labour market,
although many of those who have started to claim may not be unemployed
(see box below). 12
In July 2021, 2.29 million people claimed unemployment related benefits,
which was a fall of 7,800 from June and a fall of 348,000 from the year
before.
Since March 2020, when the lockdown began, the claimant count has
increased by 1.0 million. However, as shown in the chart below, most of this
increase occurred between March and May 2020, and since then the claimant
count has remained relatively stable.
10
Resolution Foundation, Earnings Outlook Q1 2021, 22 March 2021
11
ONS, Average weekly earnings in Great Britain, 17 August 2021
12
ONS, CLA01: Claimant Count, 17 August 2021
10 Commons Library Research Briefing, 19 August 2021Coronavirus: Impact on the labour market
Chart 2
The claimant count more than doubled between March
and May 2020
Unadjusted claimant count (millions), 2020-2021
3,000
2,500
2,000
1,500
1,000
500
0
2020 2020 2020 2020 2020 2020 2021 2021 2021 2021
Jan Mar May Jul Sep Nov Jan Mar May Jul
Source: ONS, Claimant count, August 2021
Constituency level claimant count figures are published in the library briefing
People claiming unemployment benefits by constituency.
Why is the claimant count so different from the
unemployment rate?
Usually, trends in the number of people claiming unemployment benefits in the
UK closely follow trends in unemployment. However, following the start of the
pandemic, the claimant count has more than doubled but the rise in
unemployment has been much smaller.
This suggests that people who do not classify themselves as being unemployed
may be claiming unemployment related benefits. This may be because:
• They have a job but are temporarily away from work due to the
pandemic.
• They are in employment but are also able to claim unemployment
benefits. People in employment can claim unemployment related benefits
if their income is below a set threshold, and the job retention scheme and
a reduction in working hours means this group has grown.
• They are temporarily inactive, and so are not actively looking for work.
In their report The truth will out (July 2020) the Resolution Foundation have
estimated that only around half of the Claimant Count rise relates to those
newly out of work. The report provides detailed analysis of why these figures
are different and concludes that neither are accurate representations of
current unemployment levels.
11 Commons Library Research Briefing, 19 August 2021Coronavirus: Impact on the labour market
2 Job support schemes
This section provides the latest headline statistics for the Self-Employment
Income Support Scheme and the Coronavirus Job Retention Scheme (CJRS).
Further analysis of CJRS statistics can be found in the Library briefing,
Coronavirus Job Retention Scheme: statistics.
Further statistics on the support provided for businesses during the
coronavirus pandemic, are provided in the library briefing, Coronavirus
business support schemes: statistics.
Coronavirus Job Retention Scheme (CJRS)
By midnight on 14 July 2021, 11.6 million employee jobs had been furloughed
At time of through the Government's job retention scheme, at a cost of £67.4 billion. 13
publishing, the CJRS
has been extended Coronavirus Job Retention Scheme (CJRS)
to the end of
By midnight on 14 July 2021
September 2021
Number of jobs furloughed 11.6 million
Number of employers furloughing 1.3 million
Total claimed (£) £67.4 billion
Notes
Jobs furloughed' is calculated as the sum of the maximum number of
employees furloughed by any PAYE scheme across all claims by that
scheme
Employers furloughing is calculated by counting the number of CJRS
claims from distinct PAYE schemes on employer reference (where the
PAYE scheme reference is a proxy for a single employer)
Source Gov.uk, HMRC coronavirus (COVID-19) statistics
1.9 million jobs were on furlough as at 30 June 2021. The number of jobs that
are furloughed has been gradually falling since the end of January when 4.9
million jobs were furloughed.
The furlough scheme has been extended until September 2021. The CJRS grant
covered 80% of an employee’s wages until 30 June 2021. From 1 July, the
grant has covered 70% of wages and employers are required to top up an
13
Gov.uk, HMRC coronavirus (COVID-19) statistics, 2 August 2021
12 Commons Library Research Briefing, 19 August 2021Coronavirus: Impact on the labour market
additional 10%. From 1 August the grant has covered 60% of wages and
employers are required to top up 20%.
More information on the Job Retention Scheme can be found in the Library
briefing, FAQs: Coronavirus Job Retention Scheme.
Self-employed Income Support Scheme (SEISS)
Four SEISS grants have been available: 14
• Grant 1 opened on the 13 May 2020, and closed on 13 July 2020. This paid
taxable grants worth 80% of average monthly trading profit for a 3
month period, worth up to £7,500 in total.
• Grant 2 opened on the 17 August 2020. This paid grants worth 70% of
average monthly trading profit for a 3 month period, worth up to £6,570
in total.
• Grant 3 opened on the 30 November 2020. This paid grants worth 80% of
average monthly trading profit for a 3 month period, worth up to £7,500
in total.
• Grant 4 opened on the 22 April 2021. This also paid grants worth 80% of
average monthly trading profit for a 3 month period, worth up to £7,500
in total.
The table below shows the number of claims for each grant and the amount
claimed.
Self Employment Income Support Scheme (SEISS)
Claims made up to 6 June 2021
Total number of claims Total amount claimed
Grant 1 2.6 million £7.6 billion
Grant 2 2.4 million £5.9 billion
Grant 3 2.2 million £6.2 billion
Grant 4 2.0 million £5.5 billion
Total 9.1 million £25.2 billion
Note: Claims window still open for Grant 4
Source Gov.uk, HMRC coronavirus (COVID-19) statistics
More information on the SEISS can be found in the Library briefing,
Coronavirus: Self-Employment Income Support Scheme.
14
Gov.uk, HMRC coronavirus (COVID-19) statistics, 1 July 2021
13 Commons Library Research Briefing, 19 August 2021Coronavirus: Impact on the labour market Constituency level statistics for the SEISS can be found in the look-up attachment of the Library briefing, Coronavirus business support schemes: statistics. 14 Commons Library Research Briefing, 19 August 2021
Coronavirus: Impact on the labour market

3     Most affected workers

      Analysis produced to date suggests that workers who are from an ethnic
      minority group, young and older workers, low paid workers, and disabled
      workers have been most negatively impacted economically by the coronavirus
      outbreak.

3.1   Workers from minority ethnic groups

      Unemployment rates for minority ethnic groups were higher than average
      before the coronavirus pandemic and saw a larger increase than average
      from January-March 2020 to January-March 2021.

      In January-March 2021 the unemployment rate for people from White ethnic
      groups was 4.1%, up from 3.6% in January-March 2020. For people from
      minority ethnic groups, the unemployment rate was 8.9%, up from 6.3% in
      January-March 2020. 15

      The table below shows the change in unemployment rates between January-
      March 2020 and the same period in 2021, by ethnic group.

            Unemployment rates by ethnic group
            January-March 2020 and January-March 2021

                                                                   Jan-Mar       Jan-Mar
                                                                      2020          2021
            Mixed/ multiple ethnic groups                             5.0%         11.3%
            Black/ African/ Caribbean/ Black British                  9.0%         10.2%
            Other ethnic group                                        5.8%          9.4%
            Pakistani                                                 6.1%          8.6%
            Bangladeshi                                               9.5%          7.6%
            Chinese                                                   4.0%          6.9%
            Indian                                                    3.8%          6.5%
            White                                                     3.6%          4.1%
            Total                                                     3.9%          4.7%

      Source: ONS, Labour market status by ethnic group, 18 May 2021

      15
           Office for National Statistics, Labour market status by ethnic group, 18 May 2021

      15                                                      Commons Library Research Briefing, 19 August 2021
Coronavirus: Impact on the labour market
The Resolution Foundation finds that as of May 2020, Bangladeshi adults in
work before the crisis were much more likely to have left employment
altogether, while Black African adults were most likely to be working fewer
hours and earnings less in May 2020, and least likely to have been
furloughed. 16
Note that these figures come from a small sample and should be treated as
estimates.
A survey by the Runnymede Trust found that only 35% of people from an
ethnic minority said they had not been affected financially by the coronavirus
pandemic by June 2020, compared to 54% of people from a White ethnic
group. They find that 43% of people from a Bangladeshi ethnic group and
38% of a Black African group the loss of some income, as shown in the chart
below. 17
16
Resolution Foundation, The Living Standards Audit 2020, 21 July 2020
17
Runnymede Trust, Over-Exposed and Under-Protected, The Devastating Impact of COVID-19 on Black
and Minority Ethnic Communities in Great Britain, August 2020
16 Commons Library Research Briefing, 19 August 2021Coronavirus: Impact on the labour market
The Financial Conduct Authority found that between February 2020 and July
2020, the earnings of workers in a minority ethnic group dropped by 14%,
compared to a fall of 5% for workers from a White ethnic group. 15.9% of
people from a minority ethnic group left work between February and July
2020, compared to 7.8% of people from a White ethnic group. 18
3.2 Women
Library paper Women and the Economy provides more analysis of the impact
of the coronavirus pandemic on women.
At the start of the pandemic, early evidence suggested that women were
more likely than men to have lost their jobs, but since then figures on
employment, furlough and hours worked have shown little difference between
men and women. In fact, the male employment rate has fallen more since
March 2020 than the female employment rate, and though there has been a
fall in the number of women working part-time and who are self-employed, a
rise in full-time employment among women has counteracted much of this
effect. Economic inactivity among women reached a record low in the three
months to February 2021, while men’s economic inactivity reached a joint
record high.
The Resolution Foundation posit some reasons for why women haven’t been
as affected as first thought: firstly, male dominated sectors like
manufacturing were more affected by the crisis than expected; secondly,
while women dominate the hardest hit sectors like retail and hospitality, they
also make up more than 70% of health and education workers. Plus, women
in employment were twice as likely as men to be in the public sector before
18
Financial Conduct Authority, Covid-19 and the UK’s BAME communities – an economic perspective, 26
January 2021
17 Commons Library Research Briefing, 19 August 2021Coronavirus: Impact on the labour market
the crisis (30% of women compared to 14% of men), and men were twice as
likely to be self-employed before the crisis.
The story is slightly different for mothers: according to the Resolution
Foundation, women were re-entering work at less than half the rate of men
(15% compared to 36%), which could mean that the burden of home-
schooling have slowed women’s job searches. 19
According to the IFS, by May 2020 mothers were 1.5 times more likely than
fathers to have lost their job or quit since the start of the lockdown and were
also more likely to have been furloughed. Mothers who were in paid work in
February 2020 are 9 percentage points less likely to be currently working for
pay than fathers. 20
3.3 Young and older workers
The youngest and oldest workers are most likely to have been furloughed and
more likely to have lost jobs since the beginning of the pandemic.
At 30 April 2021, 26% jobs held by workers aged under 18 and 16% of workers
aged 18-24 were on furlough, as well as 14% of workers aged 65+. For all
other age groups, furlough rates were 10-12%.
Young workers
Payroll data shows that 70% of employee job losses between March 2020 and
May 2021 were among under 25s. 21
By January 2021, 19% of 18-24 year olds who were employed before the crisis
had lost their job, 9% were furlough, and another 13% had lost more than a
tenth of their pay outside of furlough. Young people who were in insecure
work were most affected: 36% of 18-24 year olds on a zero-hours, agency or
temporary contracts were no longer working in January 2021. 22
Much of this disproportionate impact on young people is driven by the fact
that under-25s are more likely to work in sectors like hospitality, retail and
leisure. According to the IFS, employees aged under 25 were about two and a
half times as likely to work in a sector that was shut down during the
pandemic as other employees. 23 ONS data shows that the coronavirus
19
Resolution Foundation, Labour market outlook Q2 2021, 14 June 2021
20
Institute for Fiscal Studies, How are mothers and fathers balancing work and family under lockdown?,
27 May 2020.
21
Office for National Statistics, Earnings and employment from Pay As You Earn Real Time Information,
seasonally adjusted, 15 June 2021
22
Resolution Foundation, Double trouble, Exploring the labour market and mental health impact of
Covid-19 on young people, 13 May 2021
23
Institute for Fiscal Studies, Sector shutdowns during the coronavirus crisis: which workers are most
exposed?, 6 April 2020.
18 Commons Library Research Briefing, 19 August 2021Coronavirus: Impact on the labour market
pandemic has caused a shift in the distribution of young people across
sectors. The proportion of young people decreased in accommodation and
food services and arts, entertainment and recreation, and increased in public
administrate, wholesale and retail trade and professional, scientific and
technical activities. 24
The IFS find that coronavirus is also likely to disrupt career progression for
those early in their career. Early career wage growth is driven by workers
moving into higher-paying occupations and because of reductions in vacancy
postings and increases in layoffs, this has become much more difficult. 25 ONS
data shows that young people’s job-to-job moves saw the largest decrease.
The Resolution Foundation suggests that many graduates will delay their
entry into the labour market by staying in education. 26 ONS data shows that
the proportion of young people in full-time education reached its highest level
in July-September 2020 since comparable records began in 1992.
Older workers
The English Longitudinal Study of Ageing Covid-19 substudy found that 14% of
older people had lower incomes in November/December 2020 than they had
before the pandemic. Among those not yet retired, 12% are planning to retire
later than previously planned because of the pandemic. 27
At the end of April 2021, 14% of workers over 65 were furloughed, compared
with 10% of those aged 40-49. 28
According to the IFS, nearly a quarter of employees aged 54 and over were on
furlough in June-July, and among those working, a fifth were working fewer
hours. Among the self-employed in the same age group, a third were not
working. 29
The Centre for Ageing Better’s analysis of ONS data finds that only around
35% of workers aged 50+ are reemployed after a redundancy in the UK in
2019, compared to an overall average of 49%. 30
3.4 Low paid workers
Median weekly wages in the most vulnerable sectors are among the lowest in
the economy. 31 The Low Pay Commission find that minimum wage workers are
24
Office for National Statistics, Coronavirus and changing young people’s labour market outcomes in
the UK, 11 May 2021
25
Institute for Fiscal Studies, COVID-19 and the career prospects of young people, 03 July 2020.
26
Resolution Foundation, An intergenerational audit for the UK 2020, 7 October 2020.
27
Institute for Fiscal Studies, The effect of the pandemic on retirement expectations, 9 June 2021
28
Institute for Fiscal Studies, Changing patterns of work at older ages, 17 June 2021
29
Institute for Fiscal Studies, The coronavirus pandemic and older workers, 20 September 2020.
30
Centre for Ageing Better, State of Ageing in 2020, 2020.
31
ONS, Annual Survey of Hours and Earnings, 2019.
19 Commons Library Research Briefing, 19 August 2021Coronavirus: Impact on the labour market
more likely to work in affected sectors, particularly hospitality and non-
essential retail. In 2019, more than 800,000 workers paid at or below the
minimum wage worked in the most affected sectors, and 18% of these sectors
were paid the minimum wage. 32
The Resolution Foundation estimates that the median weekly pay for a worker
in a shut-down sector is £348, compared to £707 a week for workers they
calculate can work from home. 33
The Resolution Foundation found that by March 2021, 21% of workers in the
bottom pay fifth had experienced a labour market hit since the start of the
pandemic, compared to 7% in the top fifth. As well as being more likely than
other workers to have been furloughed, low paid workers have been less likely
to have received a pay ‘top up’ about the 80% subsidy provided by the
government.
Among those on furlough at any point between April 2020 and January 2021
38% of the lowest paid fifth were still furloughed in March 2021 compared to
17% of the highest paid fifth. This might reflect the fact that sectors like
hospitality and leisure had yet to start reopening in March. 14% of the lowest
paid workers had moved into a new job while switching industries, compared
to 3-6% of other workers. This suggests that some labour market
readjustment is happening and for low paid workers this is particularly
important.
The Resolution Foundation also outlines some risks for low paid workers in the
future. Increases in unemployment after recessions tend to disproportionately
affect low paid workers, and to reduce job quality, with temporary contracts
and insecure work, which is more prevalent among low paid workers too. 34
3.5 Disabled workers
In the pre-pandemic quarter of January-March 2020, disabled people had an
employment rate 28.9 percentage points lower than that of people without
disabilities. This difference is often referred to as the disability employment
gap. 35
The gap widened slightly in the quarters following the pandemic, to 29.2%
points in April-June 2020 and July-September 2020, but it has narrowed in
recent quarters to 28.6% points in January-March 2021.
32
Low Pay Commission 2020 Report, 9 December 2020.
33
Resolution Foundation, Risky business, Economic impacts of the coronavirus crisis on different groups
of workers, 28 April 2020.
34
Resolution Foundation, Low Pay Britain 2021, 7 June 2021
35
ONS, Labour market bulletin, July-September 2019. See also Library paper People with disabilities in
employment, April 2021.
20 Commons Library Research Briefing, 19 August 2021Coronavirus: Impact on the labour market
According to the Learning and Work Institute, during the pandemic, disabled
people:
• Were more likely to become economically inactive. The inactivity rate
for disabled people increased from 41.9% at the end of 2019 to 43.9%
in April-June 2020. This was followed by a decrease to 42.9% in
October-December 2020 (when lockdown restrictions had eased).
• Were more likely to move out of employment. Disabled people were
more than one and a half times more likely to move out of
employment during 2020 than non-disabled people. 9.3% of disabled
people who were employed at the end of 2019 were no longer in work
at the end of 2020, compared to 5.8% of non-disabled people.
• Saw a larger reduction in hours: During the first lockdown, average
actual hours worked by disabled people were 11% lower than average
usual hours, compared to 8% among non-disabled people. While
average actual hours increased towards the end of 2020, the gap
between average actual and usual hours worked by disabled people
was still larger in October-December 2020 than for non-disabled
people. 36
People Management reports that 71% of disabled people in employment in
March 2020 were affected by the pandemic, through a loss of income, being
furloughed, or being made redundant. This increased to 84% among 18-24
year olds. 48% of those surveyed said the coronavirus pandemic had affected
their future earnings. 37
36
Learning and Work Institute, Disability Employment: from pandemic to recovery, 27 May 2021
37
People Management, Disabled workers facing coronavirus ‘jobs crisis’, survey shows, 27 October 2020
21 Commons Library Research Briefing, 19 August 2021The House of Commons Library is a research and
information service based in the UK Parliament.
Our impartial analysis, statistical research and
resources help MPs and their staff scrutinise
legislation, develop policy, and support constituents.
Our published material is available to everyone
on commonslibrary.parliament.uk.
Get our latest research delivered straight to your inbox.
Subscribe at commonslibrary.parliament.uk/subscribe
or scan the code below:
commonslibrary.parliament.uk
@commonslibraryYou can also read