TROPICAL STORM SEASON REPORT 2021
←
→
Page content transcription
If your browser does not render page correctly, please read the page content below

TROPICAL
STORM SEASON
REPORT 2021
Welcome to the Tropical Storm Season Outlook
2021, your comprehensive overview of what to
expect this season in all the major basins in the
Northern Hemisphere. Topics will include a look
back at last year’s infamous season, the drivers
that will dictate this season, a specific
forecast for the global basins, and a high
level look at climate change and the
impact on tropical activity. All of these
will be applied within the framework
of the supply chain world and the
unique dynamics that have and
will continue to occur.

Get in Front of What’s Ahead.
For more information,
visit everstream.ai.

2 / MAY 2021 /
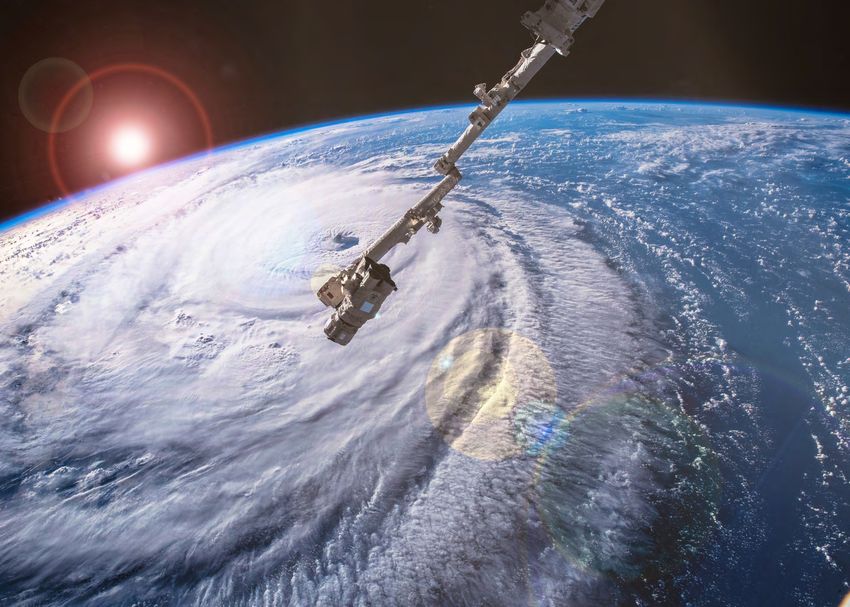
TABLE OF CONTENTS

      1. INTRODUCTION                                                          04

      2. R
          EVIEW OF THE 2020 TROPICAL SEASON                                   06
        Atlantic Basin                                                          06
        West Pacific Basin                                                      08
        East Pacific Basin                                                      10
        Indian Ocean Basin                                                      12

      3. 2020 TROPICAL SEASON FORECAST VERIFICATION                            15

      4. DRIVERS FOR 2021                                                       16

      5. THE 2021 FORECAST                                                      19
        Atlantic – Above normal risk                                            19
        West Pacific – Normal to slightly above normal risk                     21
        East Pacific – Normal to slightly below normal risk                     23
        Indian Ocean – Normal to slightly above normal risk                     25

      6. SUPPLY CHAIN IMPACTS                                                  26

      7. C
          LIMATE CHANGE AND TROPICAL
         CYCLONE ACTIVITY                                                      29

      8. CONCLUSION                                                            32

                                                        / TROPICAL STORM SEASON REPORT / 3
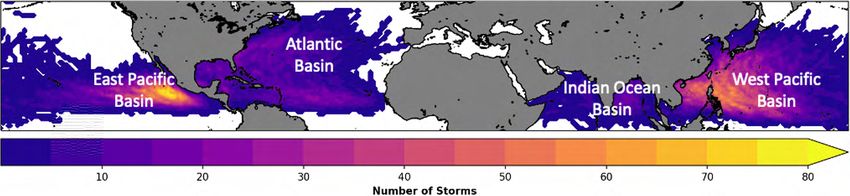
INTRODUCTION
Tropical cyclones (hurricanes, typhoons, and cyclones) are    the Northern Hemisphere — Atlantic, east Pacific, west
one of the most disruptive events impacting the global        Pacific, and Indian Ocean. Fig. 1 provides a visualization of
supply chain. The effects of an intense hurricane/typhoon     these four basins. For reference, this map shows the number
hitting a key hub can reverberate around the world. If        of tropical storms over the past 41 years (1979 – 2020) at
damage is serious and involves infrastructure, the impacts    each ocean grid point. This is an effective way to look at the
can linger for an extended period. Add this to the ongoing    frequency of storms and the areas that are most susceptible
COVID-19 issues and these concurrent events can disrupt       to tropical systems.
transportation and business operations far from where a       First, we will look back and review the extraordinary 2020
specific storm makes landfall. These linked extremes — one    season which had an inordinate amount of variability —
health related and the other environmental — have led to      extremely active in some areas and very inactive in others.
supply chain disarray in many parts of the globe during the   Next, we will discuss the primary drivers or variables that
past year.                                                    will determine the general theme (active or inactive) of the
The upcoming tropical storm season in the Northern            upcoming season. As we did last year, we will provide our
Hemisphere looks to be another highly eventful period.        initial forecast for the season in each basin. We will do this
Initial indications point to another active season in the     by using the ACE metric (accumulated cyclone energy)
Atlantic basin. The most significant year-on-year change      which is the best way to quantify tropical cyclone activity.
looks to be in the west Pacific where indications are for a   Then, we will apply our forecasts to the supply chain and
normal to above normal season compared to last year’s         discuss upcoming risks and vulnerabilities for critical nodes
quiet season. The other two basins, east Pacific and Indian   and shipping lanes.
Ocean, look to feature near normal activity during the        Finally, while this is not a report dedicated to the impacts of
upcoming season.                                              climate change on tropical cyclone activity, we will broadly
This report provides a comprehensive view of what to          cover a few of the cutting-edge items in climate studies that
expect for the upcoming season in all the major basins in     are most pertinent to the global supply chain.

FIG. 1. NUMBER OF TROPICAL CYCLONE TRACKS FROM 1979 – 2020 IN THE EAST PACIFIC, ATLANTIC,
INDIAN OCEAN AND WEST PACIFIC BASINS.

Source: IBTRaCS

4 / MAY 2021 /
/ TROPICAL STORM SEASON REPORT / 5
REVIEW OF 2020
TROPICAL SEASON
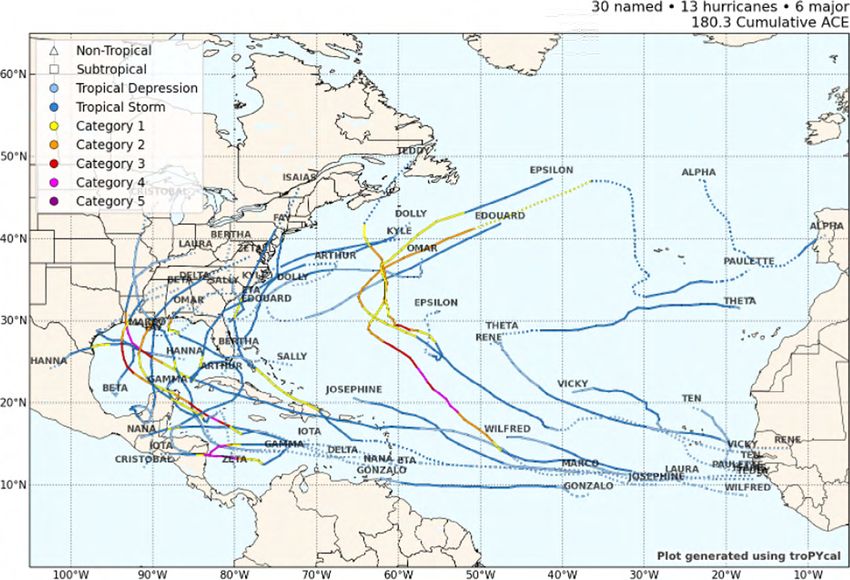
ATLANTIC BASIN from 2005. In terms of ACE, 2020 registered 180.3 (see Fig. 3),
which is well above normal (average is 110). Last season was
The 2020 tropical season was one for the record books in the not only impressive because of the sheer number of storms,
Atlantic basin. With a total of 30 named storms (see Fig. 2), but also for how many of those storms traveled into the Gulf of
reaching well into the Greek alphabet, 2020 set the record for Mexico and eventually the U.S. The 2020 tropical season in the
the most named storms in a season, surpassing the old record Atlantic will be remembered and discussed for years to come.
FIG. 2. TROPICAL CYCLONE TRACKS FROM 2020 IN THE ATLANTIC BASIN.
Source: IBTRaCS.
6 / MAY 2021 /
FIG. 3. HISTORICAL ACE IN THE ATLANTIC BASIN FROM 1979 – 2020.

Source: IBTRaCS.

Outside of the atmospheric numbers, the human and             in at 431, although unfortunately, this number is likely far
economic toll was daunting last year. Total economic          higher since there were scores unaccounted for mainly in
losses were estimated at nearly 52 billion (USD) with eight   Central America following the devastating back-to-back
storms being categorized as billion-dollar storms (storms     storms (Hurricane Eta and Hurricane Iota) in November
that have over 1 billion USD in damage). Fatalities came      of 2020.

                                                                          / TROPICAL STORM SEASON REPORT / 7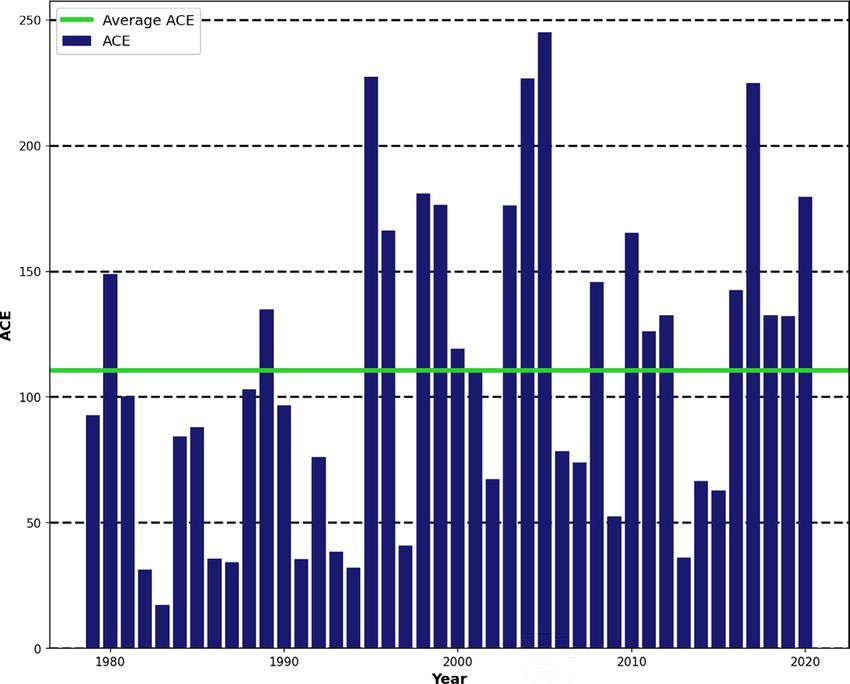
WEST PACIFIC BASIN                                              Not only did Goni reach Category 5 status, but the wind
                                                                speed at landfall in the Philippines was 195 mph/315 kph
Unlike the Atlantic, the west Pacific basin was significantly   making it the most intense landfalling tropical cyclone
less active than normal in 2020. There were a combined 23       ever recorded globally. Even during a relatively inactive
named storms, with only one storm (Super Typhoon Goni)          season, individual storms can have major impacts and
reaching Category 5 strength, which is quite uncommon.          break records.

FIG. 4. TROPICAL CYCLONE TRACKS FROM 2020 IN THE WEST PACIFIC BASIN.

Source: IBTRaCS.

8 / MAY 2021 /
FIG. 5. HISTORICAL ACE IN THE WEST PACIFIC BASIN FROM 1979 – 2020.
Source: IBTRaCS.
For the season as a whole, the west Pacific basin recorded was the fifth lowest in recorded history since 1979.
fewer named storms than the Atlantic, marking just the Additionally, the season started late and featured long
fourth time since 1950 that this has occurred. In terms of stretches of no activity. While many areas had a general
ACE, 2020 registered 149.9, which is well below average lull in activity, two areas that had numerous impactful
(average is 298). In fact, the ACE measurement in 2020 storms were Vietnam and South Korea.
/ TROPICAL STORM SEASON REPORT / 9EAST PACIFIC BASIN (average is 209), which is well below normal. Even more
impressive than the west Pacific ACE statistic, the east
Similar to the west Pacific, the east Pacific basin also Pacific recorded the third lowest ACE value since 1979.
featured significantly below normal activity in 2020. There In general, the 2020 tropical season in the east Pacific was
was a total of 17 named storms and ACE only reached 80.5 highly uneventful.
FIG. 6. TROPICAL CYCLONE TRACKS FROM 2020 IN THE EAST PACIFIC BASIN.
Source: IBTRaCS.
10 / MAY 2021 /FIG. 7. HISTORICAL ACE IN THE EAST PACIFIC BASIN FROM 1979 – 2020.
Source: IBTRaCS.
/ TROPICAL STORM SEASON REPORT / 11INDIAN OCEAN BASIN devastation and disruption when it made landfall in far
eastern India (West Bengal State). It is estimated that
Finally, the Indian Ocean basin was near normal in 2020. Amphan caused the second highest amount of damage
There was a total of five named storms, with a total ACE (nearly 14 billion USD) for the basin only outnumbered
value of 26.6 (average is 27). What made 2020 unique in by Extremely Severe Cyclonic Storm Nargis in 2008
the Indian Ocean basin was Super Cyclonic Storm Amphan (source: Reuters). The fatalities directly from Amphan
(Category 5 equivalent) in May. Amphan caused significant were reported at 128.
FIG. 8. TROPICAL CYCLONE TRACKS FROM 2020 IN THE INDIAN OCEAN BASIN.
Source: IBTRaCS.
12 / MAY 2021 /FIG. 9. HISTORICAL ACE IN THE INDIAN OCEAN BASIN FROM 1979 – 2020.
Source: IBTRaCS.
/ TROPICAL STORM SEASON REPORT / 1314 / MAY 2021 /
2020 TROPICAL SEASON
FORECAST VERIFICATION
A year ago (May of 2020), we issued the forecast as part of our Tropical Report for the four primary basins.
The following paragraph was taken directly out of last year’s report:

  Our experts forecast that during the upcoming               All in all, the forecast verified very well as we captured the
  tropical storm season, companies should expect              upcoming risk (active or inactive) in each of the four basins.
  above normal activity in the Atlantic (Gulf of Mexico,      Now, we will do the same process for the 2021 season and
  Caribbean, and Atlantic). In the Pacific (East Pacific      forecast the risk in the four basins. First, we will analyze the
  and West Pacific), companies should expect below            key drivers or variables as we approach the season.
  normal activity, while in the Indian Ocean, companies
  should expect near normal activity.

                                                                          / TROPICAL STORM SEASON REPORT / 15
DRIVERS FOR 2021 The combination of oceanic and atmospheric conditions than normal sea-surface temperatures (SSTs), is one of across the global tropics is critical in the genesis, intensity, the primary drivers of yielding favorable or unfavorable and frequency of tropical cyclones seasonally and sub- oceanic and atmospheric conditions across much of the seasonally. In other words, these factors help determine global tropics. Changes in this oscillation can resonate whether a season will be active or inactive. Ocean water into the Atlantic and Indian Oceans causing distinct trends temperatures help set the table for storm development or patterns in tropical cyclone activity. In general, El Niño but also fuel the energy of storms including their rate of events (warmer than normal SSTs) tend to produce active intensification. In the atmosphere, areas of long-term and conditions across the tropical Pacific but inactive conditions short-term enhanced/suppressed wind shear aid in the across the tropical Atlantic. La Niña events (cooler than formation, strengthening, and weakening of storms or help normal SSTs) tend to produce inactive seasons across the shape regional active/inactive areas within a basin. tropical Pacific but active seasons for the tropical Atlantic. Across the expansive tropical Pacific, the El Niño/La Niña Last year, the SST profile throughout the May-November oscillation or alternating periods of warmer and cooler time frame featured cooler than normal waters across the FIG. 10. SEA SURFACE TEMPERATURE ANOMALIES ON 08 MAY 2021. Source: OISSTv2, NCEP. 16 / MAY 2021 /
central/eastern Pacific Ocean (a La Niña event), warmer than
normal waters across the tropical Atlantic, and near normal
waters conditions across the Indian Ocean. This year, we
are expecting neutral to slightly cooler than normal waters
across the central/eastern tropical Pacific, warmer than normal
waters across the tropical Atlantic but not to the magnitude
of last year, and near to slightly warmer SSTs across the Indian
Ocean. In other words, the tropical Pacific is expected to be
warmer than a year ago, while the tropical Atlantic is expected
to be slightly cooler than a year ago. We think these are two
important differences this year which increases the risk in the
Pacific compared to last year and limits some of the elevated
risk in the Atlantic.

                                                                   / TROPICAL STORM SEASON REPORT / 17
18 / MAY 2021 /
THE 2021 FORECAST
ATLANTIC – ABOVE                                              to repeat last year’s hyperactivity given the cooler Atlantic
                                                              water temperatures year on year and the near normal water

NORMAL RISK                                                   temperatures across the Pacific Ocean this year. An active,
                                                              but not record breaking or hyper-active season is the most
Risk drivers: Warmer than normal Atlantic SSTs and near       likely outcome based on the current variables.
normal Pacific SSTs                                           We do note, though, that warmer than normal waters in
Of the main ocean basins, the Atlantic has the highest risk   the Gulf of Mexico, Caribbean, and off the East Coast of
with another active season expected. As a result, we are      the U.S. favor stronger storms if atmospheric conditions are
forecasting an above normal ACE value for the upcoming        constructive for development. Also, basin wide SSTs will be
Atlantic season with a forecast range of 125-150. The         important to monitor throughout the season as any warming
above normal ACE expectation is similar to last season at     trends would signal higher activity and stronger storms,
this time when our macro variables signaled the Atlantic to   while any cooling trends would signal lower activity and
have the highest risk. However, we do not expect this year    weaker storms versus current expectations.

FIG. 11. HISTORICAL ACE FROM 1979 – 2020, PLUS THE 2021 FORECAST (125 – 150), IN THE ATLANTIC BASIN.

Source: IBTRaCS.

                                                                         / TROPICAL STORM SEASON REPORT / 19
20 / MAY 2021 /
WEST PACIFIC –                                               The closer to normal SSTs across much of the Pacific Ocean
                                                             signal a season near or even slightly above normal, which is

NORMAL TO SLIGHTLY                                           a big change from last year and like two years ago. Based
                                                             on our research, our current ACE forecast range is 275-325,

ABOVE NORMAL RISK                                            which compares to the long-term average of 300.
                                                             Again, the west Pacific basin normally has the highest
Risk drivers: Near normal SSTs across the basin and near     number of tropical storms and ACE. Thus, a return of even a
normal central/eastern Pacific SSTs                          more typical season raises risks of a much higher number of
We anticipate this year’s west Pacific storm season to be    supply chain disruptions year on year.
much more active than last year’s relatively quiet season.

FIG. 12. HISTORICAL ACE FROM 1979 – 2020, PLUS THE 2021 FORECAST (275 – 325), IN THE WEST PACIFIC BASIN.

Source: IBTRaCS.

                                                                        / TROPICAL STORM SEASON REPORT / 21
22 / MAY 2021 /
EAST PACIFIC –                                                  We are forecasting another quiet season for the east Pacific,
                                                                with a below normal risk of supply chain disruptions. If

NORMAL TO SLIGHTLY                                              realized, this would be the third consecutive season of
                                                                below average ACE. Given the near normal SSTs in the

BELOW NORMAL RISK                                               Pacific Ocean, we expect a higher ACE value and higher
                                                                number of storms this year compared to last year. Our ACE
Risk drivers: Near normal SSTs across the central Pacific and   forecast is 150-200.
slightly cooler than normal SSTs in the eastern Pacific

FIG. 13. HISTORICAL ACE FROM 1979 – 2020, PLUS THE 2021 FORECAST (150 – 200), IN THE EAST PACIFIC BASIN.

Source: IBTRaCS.

                                                                           / TROPICAL STORM SEASON REPORT / 23
24 / MAY 2021 /
INDIAN OCEAN –                                               The Indian Ocean is the other basin where above normal
                                                             activity is expected this season. In other words, we are

NORMAL TO SLIGHTLY                                           forecasting an ACE range of 30-40 which is near to slightly
                                                             above average, but not as high as the record value of two

ABOVE NORMAL RISK                                            years ago. The Indian Ocean tends to have two primary
                                                             windows of activity — May/June and Oct/Nov — throughout
Risk drivers: Near to slightly warmer than normal SSTs and   the season. These are the time frames with the highest
near normal central/eastern Pacific SSTs                     probability of development, and likewise, the windows for
                                                             highest risk of supply chain disruptions.

FIG. 14. HISTORICAL ACE FROM 1979 – 2020, PLUS THE 2021 FORECAST (30 – 40), IN THE INDIAN OCEAN BASIN.

Source: IBTRaCS.

                                                                        / TROPICAL STORM SEASON REPORT / 25
SUPPLY CHAIN IMPACTS Everything else equal, supply chain nodes and networks technology, retail, automotive, agriculture, energy, and within the west Pacific have the highest risk of being chemical sectors should be prepared this season for more impacted by tropical cyclones compared to other basins. activity than last year. In other words, the risk of supply chain This is due to the fact that the west Pacific normally has the disruptions within this region is higher compared to last year highest number of storms and highest ACE when compared and closer to seasonal normals. Major ports within the region to other basins. This was exemplified in last year’s report, include the Port of Kaohsiung in Taiwan, the Ports of Hong where we provided our Everstream Analytics historical Kong, Shenzhen, Guangzhou, and Xiamen in China, the Port analysis of the Top 10 global ports and cargo airports with of Busan in South Korea, and the Port of Tokyo in Japan. the highest risk. Nine of the ten highest risk global ports Additionally, major cargo airports that will likely revert to and airports were located in the west Pacific zone with the more normal risk of disruption include Hong Kong, Shanghai majority of those supply chain hubs in China. Pudong, Incheon, Taiwan, and Tokyo Narita. Finally, higher Based on our forecast for this year, we anticipate a higher storm activity across the region will likely disrupt and/or number of disruptions in the west Pacific this year compared delay cargo shipping at times as vessels steer off track or to last year. As a result, supply chain networks in pharma, slow down to navigate away from the core of the storms. 26 / MAY 2021 /
In the Atlantic Ocean, another active year with above              risk include Chhatrapati Shivaji, Sardar Vallabhbhai Patel,
normal ACE increases the risk of disruptions to supply             Chennai, Netaji Subhas Chandra Bose, and Bandaranaike
chain networks involving the pharma, technology, retail,           International airports. Primary supply chain industries
automotive, agriculture, energy, and chemical sectors.             serviced by these hubs include pharma and automotive.
Miami International Airport, which is already on our Top           With scattered pockets of warmer than normal SSTs
10 list of global cargo airports historically, is at even higher   across various basins, the risk is higher for storms that
risk this year. Meanwhile, risks are elevated for already          track over these “hot pockets” to achieve greater strength.
vulnerable U.S. ports including the Port of New Orleans,           In fact, we have seen this already this year in the west
Port of Houston, Port of Mobile, Port of Savannah, and the         Pacific with the development of Super Typhoon Surigae
Port of Jacksonville. Other regional key hubs include the          which rapidly intensified to 305kmph/190mph back in
Port of Charleston and Charleston International Airport            mid-April. Surigae became the strongest pre-May typhoon
along with the Port of San Juan and Luis Munoz Marin               on record! Fortunately, Surigae steered slightly away from
International Airport in San Juan, Puerto Rico.                    the Philippines rather than making a direct landfall. As we
In the Indian Ocean, the risk is slightly elevated compared        move through the season, it will be critical to monitor the
to normal for key ports including the Port of Mundra, Port of      forecasts of individual storms with our Nextgen platform
Pipavav, Port of Kolkata, Port of Haldia, Port of Chittagong,      and Watchtower Alerts, and their tracks relative to these
and Port of Colombo (Sri Lanka). Cargo airports at elevated        “hot pockets”.

                                                                              / TROPICAL STORM SEASON REPORT / 27
28 / MAY 2021 /
CLIMATE CHANGE AND
TROPICAL CYCLONE ACTIVITY
The question of climate change and how, if at all, it is        section, we will broadly cover a few of these key issues
impacting tropical activity has been a “hot” topic for          including:
many decades. The relationship between thermodynamics
                                                                1) Poleward shift of storms especially in the west Pacific
(heat, energy, water vapor) and tropical activity is highly
complex. Are numbers of global storms increasing due            2) Slowing of storm movement which leads to a higher
to hotter temperatures and warmer ocean waters? It                 probability of flood events
does not appear to be the case — there has been no              3) Recent increase of storms that go through rapid
discernible trend of an increase in storms globally during         intensification (RI)
the past 40 years.                                              In our webinar updates throughout the season, we will dive
However, when one digs into the details there are numerous      into the specifics of these issues. At the crux of these issues
items that are a direct result of the increased warming         is the increase in global ocean temperatures. Fig.15 depicts
of global temperatures and oceans. A few of these have          the increase in global ocean temperatures from 1979 to
significant ramifications on the global supply chain. In this   last year.

FIG. 15. YEARLY GLOBAL SEA SURFACE TEMPERATURE ANOMALIES FROM 1979 – 2020.

Source: NOAA.

                                                                           / TROPICAL STORM SEASON REPORT / 29
1. Poleward Shift flooding is more likely. The most infamous example of this
While the period of record for studying tropical cyclones in the U.S. is Hurricane Harvey in 2017, which devastated
is quite short (reliable data began in 1979), there are portions of the Houston, TX metro area with 30-60 inches
some emerging trends in tropical cyclone activity that are (76-152 cm) of rain in one week. Other recent examples
likely due to climate change. Recent research published in include Hurricanes Sally and Eta last year and Hurricane
the American Meteorological Society’s Journal of Climate Dorian in 2019.
has shown that tropical cyclones are moving farther north
than they were in the past. At a high level, this is due to 3. Rapid Intensification
warmer water at higher latitudes due to the increase of A third and critical linkage between tropical cyclones and
Earth’s temperature. This was particularly evident in the climate change is that tropical cyclones are intensifying more
west Pacific and focused across the Philippines, South rapidly. RI is defined as an increase in the maximum sustained
China and East China Seas. Furthermore, their research winds of a tropical cyclone of at least 35mph/55kmph in a
suggests that this area will continue to experience an 24-hour period. In fact, research suggests it is 25% more
increasing number of tropical cyclones in the future. In likely now than four decades ago that a tropical cyclone will
general, this premise would likely hold in the Atlantic reach major intensity. Rapidly intensifying tropical cyclones,
basin as well, with the possibility for more storms moving like Hurricane Laura in the Gulf of Mexico last year that
farther north in the Atlantic but was not specifically strengthen just before landfall, are among the most impactful
studied in this research. storms to people and infrastructure. RI lessens the time
needed for preparation if it occurs near land. While not
2. Slower Forward Speed every hurricane or typhoon undergoes RI being aware of the
An additional item in their research suggests that increased risk when the environment is favorable for it, can
tropical cyclones are generally slowing down in their be the difference between night and day in preparing for
forward speed near and on land. Generally, inland rainfall these high impact events.
accumulation tends to be highly dependent on the These types of climate-related extremes, or what we call the
forward speed of a tropical cyclone. As such, with slower tails of the distribution, are the events that have the greatest
moving storms near and onshore, extreme rainfall and impact on the global supply chain.
30 / MAY 2021 // TROPICAL STORM SEASON REPORT / 31
CONCLUSION
Tropical activity is one of the most disruptive
events in the global supply chain. A strong
storm in a vulnerable area can cause issues that
reverberate around the world for an extended
period of time. Add to this the ongoing COVID-19
issues and these linked extremes can lead to
compounded issues that impact the logistics
professional, the consumer, and the bottom line of
companies caught in the supply chain “cyclone”.
With another active season expected in most of
the basins in the Northern Hemisphere, the stage
is set for a season of high impact events and
heightened supply chain issues.
While we cannot change a storm’s path or limit the
flooding that occurs in an area, we can mitigate
the risk with predictive analytics. Let us help you
and your company Get In Front of What’s Ahead.

32 / MAY 2021 /
/ TROPICAL STORM SEASON REPORT / 33
THINK BIGGER | SEE FURTHER | ACT SOONER
WITH PREDICTIVE SUPPLY CHAIN RISK ANALYTICS
Actionable insights to enable greater resilience and agility

About Everstream Analytics
Everstream Analytics is a supply chain risk analytics company that delivers actionable insights to
increase the resilience and agility of our clients’ supply chains, protecting revenue and reputation.
Our solution integrates with our clients’ Procurement, Logistics and Business Continuity platforms
to deliver global, end-to-end visibility to supply chain risk to enable our clients to Think Bigger.
We employ a unique combination of human expertise, artificial intelligence and proprietary data
to deliver predictive insights to enable our clients to See Further. We combine data science,
proprietary intelligence and multilingual specialists to monitor global risk and events in real-time
to enable our clients to Act Sooner. We embed risk analytics into decision making during planning
and execution across all functions and phases of our clients’ supply chains to help them Get in
Front of What’s Ahead and turn risk into a competitive advantage.

GET IN TOUCH

Website                             Email                                  Phone
www.everstream.ai                   info@everstream.ai                     +1 (800) 261 7947

Get in Front of What’s Ahead. For more information, visit Everstream.ai.
You can also read