Monro, Inc.
  Investor
Presentation

February 2019
←
→
Page content transcription
If your browser does not render page correctly, please read the page content below

Monro, Inc. Investor Presentation February 2019
Safe Harbor Statement and Non-GAAP Measures

  Certain statements in this presentation, other than statements of historical fact, including estimates, projections, statements
  related to our business plans and operating results are forward-looking statements within the meaning of the Private
  Securities Litigation Reform Act of 1995. Monro has identified some of these forward-looking statements with words such as
  “anticipates,” “believes,” “expects,” “estimates,” “is likely,” “predicts,” “projects,” “forecasts,” “may,” “will,” “should,” and
  “intends” and the negative of these words or other comparable terminology. These forward-looking statements are based on
  Monro’s current expectations, estimates, projections and assumptions as of the date such statements are made, and are
  subject to risks and uncertainties that may cause results to differ materially from those expressed or implied in the forward-
  looking statements. Additional information regarding these risks and uncertainties are described in the Company’s filings with
  the Securities and Exchange Commission, including in the “Risk Factors” and “Management’s Discussion and Analysis of
  Financial Condition and Results of Operations” sections of our most recently filed periodic reports on Forms 10-K and Form
  10-Q, which are available on Monro’s website at http://www.Monro.com/Corporate/SEC-filings. Monro assumes no obligation
  to update or revise these forward-looking statements for any reason, even if new information becomes available in the future.

  This presentation contains references to Adjusted Earnings Per Share (EPS), which is a “non-GAAP financial measure” as
  this term is defined in Item 10(e) of Regulation S-K under the Securities Act of 1933 and the Securities Exchange Act of 1934
  and Regulation G under the Securities Exchange Act of 1934. In accordance with these rules, Monro has reconciled this non-
  GAAP financial measure to its most directly comparable U.S. GAAP measure. Management views this non-GAAP financial
  measure as a way to assess comparability between periods.

  This non-GAAP financial measure is not intended to represent, and should not be considered more meaningful than, or as an
  alternative to, its most directly comparable GAAP measure. This non-GAAP financial measure may be different from similarly
  titled non-GAAP financial measures used by other companies.

                                                                                                                                      2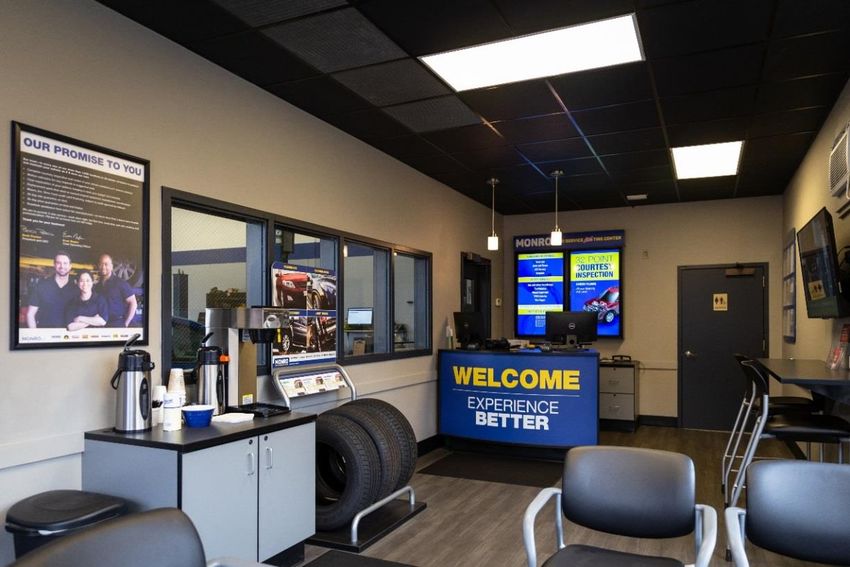
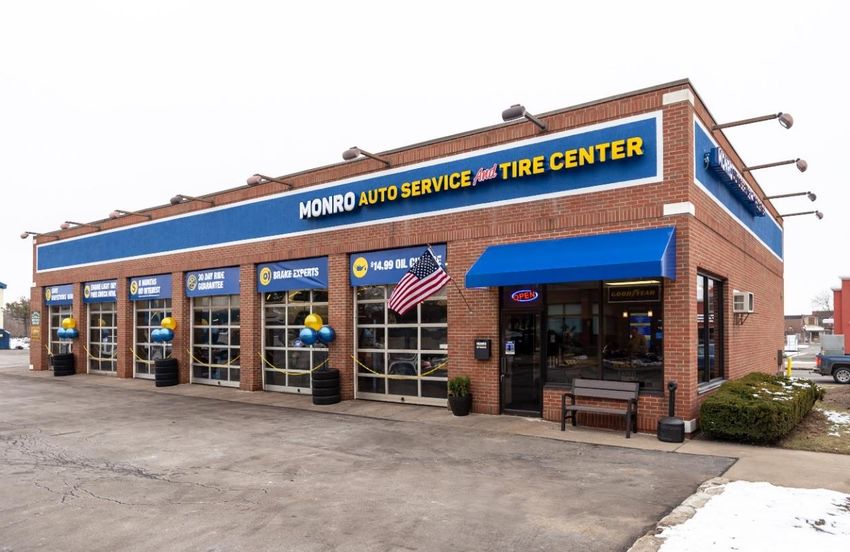
Company Overview
A Leading Chain of Independently Owned and Operated Tire and Auto Service Locations
Dominant in the Northeastern U.S. and expanding
in Southern and Western adjacent markets
Fiscal 2018 sales of $1,127.8 million
1,197 company operated stores in 28 states and
99 franchised locations as of January 31, 2019
29 acquisitions in the past 6 fiscal years, adding
386 locations, $520 million in revenue and entry
into 8 new states
8 wholesale locations and 3 retread facilities
Store locations as of 2/11/19
3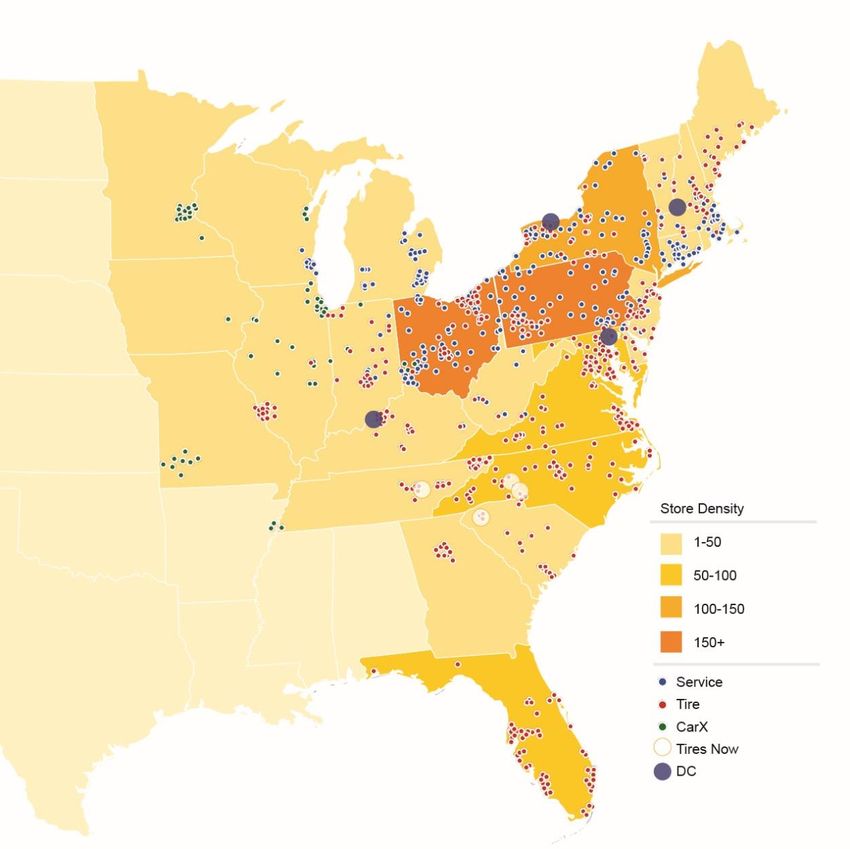
A Strong Brand Portfolio
Multiple Store Brand Strategy Driving Increased Store Density
10 well-known regional brands underneath Monro’s
corporate umbrella
Brand Portfolio
Operating two store formats in key markets
− Service stores – 560 stores Service Tire
• 80% maintenance services, 20% tires
• $600,000 a year in sales per store
− Tire stores - 637 stores (excluding wholesale)
• 55% tires, 45% service
• $1.2 million a year in sales per store
8 wholesale locations and 3 retread facilities
4
A Unique Operating Model
Monro Has a Diversified Supply Chain, Sourcing High Quality, Low Cost Parts Direct and a Strong Portfolio of Tire Brands
PARTS
The following types of parts are sourced
from various cities in China:
Brake Rotors and Pads
Filters
Steering and Suspension
Wipers
Belts
Secondary parts distribution:
TIRES
Store locations as of 2/11/19
5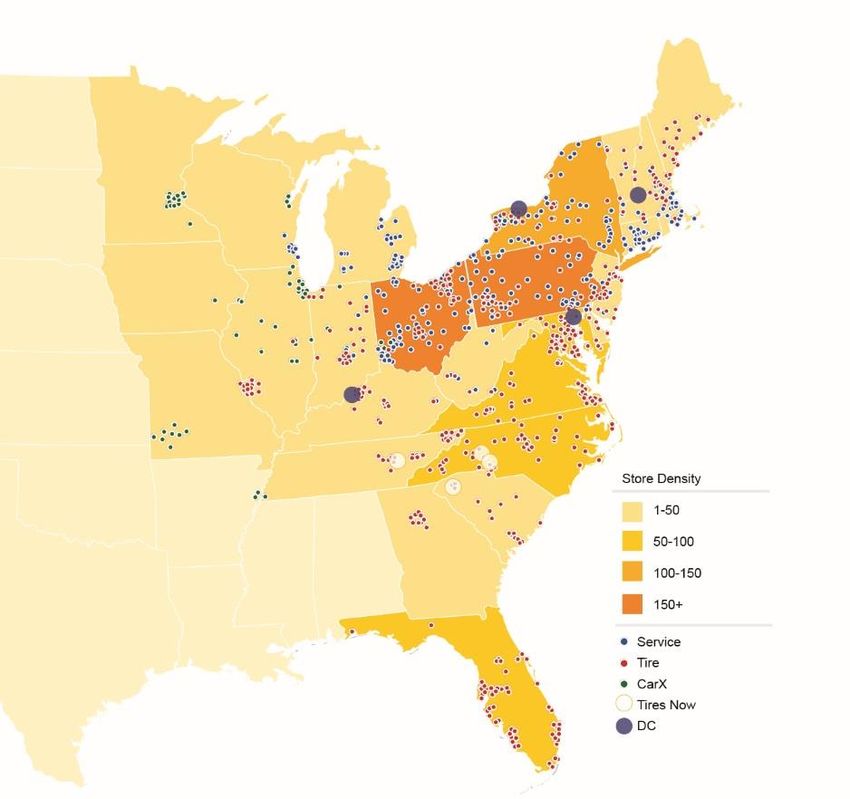
A Favorable Industry Backdrop
Favorable Industry Backdrop for Automotive Services with the
Vehicles in Operation Expected to Grow Significantly Over the Next Few Years
U.S. Annual Light Vehicle Sales U.S. Light Vehicles in Operation (VIO)
18 300
290
16 280
270
14 260
250
12 240
230
10 220
210
8 200
03 05 07 08 09 10 11 12 13 14 15 16 17 2012 2013 2014 2015 2016 2017 2018* 2019* 2020* 2021* 2022*
Source: FRED Economic data, Light weight Vehicle Sales: Autos and Light Trucks, Dec 2017 Source: Lang, IHS Markit, 2018. 2018 – 2022 are estimated figures
Total Miles Traveled in U.S. Key Highlights
3,300,000
3,200,000 Growing total vehicle population from U.S. auto sales
270+ million vehicles on the road
3,100,000
Increasing age of vehicles (average of ~12 years)
3,000,000
Total annual miles driven up ~1.3% y/y
2,900,000 Decreasing number of service outlets and bays
2,800,000 Increasing complexity of vehicles
Favorable demographics
2,700,000
03 05 07 08 09 10 11 12 13 14 15 16 17
Source: FRED Economic data, Moving 12-Month Total Vehicle Miles Traveled 6
A Favorable Industry Backdrop
Monro is Well-Positioned to Capitalize on Positive Industry Trends,
with Our Sweet Spot Experiencing the Fastest Growth in Vehicles in Operation
Vehicles in Operation – 0 to 5 Years Vehicles in Operation – 6 to 12 Years
120 120
110 +6.56% CAGR -.03% CAGR 110 -3.97% CAGR +3.90% CAGR
100 100
90 90
80 80
70 70
60 60
50 50
2012 2013 2014 2015 2016 2017 2018 2019 2020 2021 2022 2012 2013 2014 2015 2016 2017 2018 2019 2020 2021 2022
Vehicles in Operation – 13+ Years Key Highlights
+4.27% CAGR +1.47% CAGR
120 Strong growth in new vehicles (0-5 years) between 2012
110 and 2017 is creating a significant tailwind for the 6-12 year
100 old vehicle cohort for the next few years
90
6-12 year cohort expected to grow the fastest at +3.9%
80
CAGR for the period 2017 - 2022
70
60 Monro’s targeted market segment is the 6-12 year cohort
50
2012 2013 2014 2015 2016 2017 2018 2019 2020 2021 2022
Source for all data: Lang, IHS Markit, 2018 7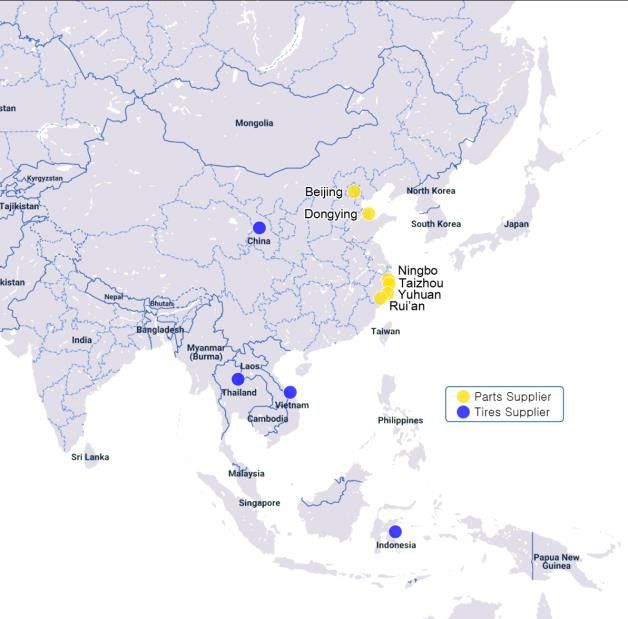
A Favorable Industry Backdrop
Monro Operates in the $230 Billion Do-It-For-Me* Segment of $287 Billion U.S. Automotive Aftermarket Industry
Automotive Aftermarket DIFM vs. DIY Sales
2008 % (outlets) 2016 % (outlets) CAGR
300,000
250,000 Dealers 20,770 15.6% 16,680 12.7% (2.7%)
200,000 General Repair
76,564 57.4% 80,071 61.1% 0.6%
Garages
150,000
Tire Dealers 18,596 14.0% 19,822 15.1% 0.8%
100,000
Specialty Repair 9,674 7.3% 7,040 5.4% (3.9%)
50,000
Oil Change/Lube 7,649 5.7% 7,437 5.7% (0.4%)
0
2012 2013 2014 2015 2016 2017 Total 133,253 100% 131,050 100%
DIFM DIY
Source: Autocare Association Factbook Source: Autocare Association Factbook
DIFM vs. DIY Trends Key Highlights
DIFM continues to gain share from DIY Fewer outlets/bays to work on more vehicles in
segment operation in the U.S.
Vehicle complexity continues to drive shift to
DIFM from DIY Industry still highly fragmented, with significant
opportunities for further consolidation
Future technology advances expected to
accelerate shift to DIFM
* Includes Replacement Tire Segment 8
Third Quarter Fiscal 2019 Highlights
Achieved Fourth Consecutive Quarter of Positive Comparable Store Sales Growth
Y/Y Comps Trends Quarterly Comps Trends
10.0%
4.0%
8.0%
3.0%
6.0%
2.0%
4.0%
1.0%
2.0% 0.0%
1 2 3
0.0% 3QFY18 4QFY18 1QFY19 2QFY19 3QFY19
1 2 2 3 -1.0%
Jan-18 Feb-18 Mar-18 Apr-18 May-18 Jun-18 Jul-18 Aug-18 Sep-18 Oct-18 Nov-18 Dec-18
-2.0% -2.0%
-4.0% -3.0%
-6.0% -4.0%
-8.0%
3QFY19 3QFY19
Key Highlights Key Highlights3
Comparable store sales increased by 2.2%, or Brakes: 12%
3.3% when adjusted for one less selling day in the Tires: 3%
quarter, compared to a decline of 3.1% in the prior
year period Alignments: 1%
Sales from new stores added $19.8M, including Maintenance: Flat
sales from recent acquisitions of $14.3M Front End/Shocks: -4%
1Results have been adjusted for the extra selling week
2Results have been adjusted for the Memorial Day holiday calendar shift
3Results have been adjusted for one less selling day in 3QFY19 due to the Christmas holiday calendar shift 9
A Scalable Platform: Recent Acquisitions
Acquisitions Completed and Announced to Date in Fiscal 2019 Represent $87M in Annualized Sales
Announced Acquisitions
Announced a definitive agreement to acquire 12 retail locations in Louisiana
Enters a new state, expanding the Company’s presence in the southern markets
$15M in annualized sales, breakeven to EPS in FY19
Sales mix of 35% service and 65% tires
Completed Acquisitions
Completed acquisition of five retail locations in Ohio, filling in an existing market
$5M in annualized revenue, breakeven to EPS in FY19
Sales mix of 70% service and 30% tires
Completed acquisition of 13 retail locations in Florida, filling in an existing market
$12M in annualized revenue, breakeven to EPS in FY19
Sales mix of 65% service and 35% tires
Greenfield Openings1
Added three greenfield locations during the third quarter
1Greenfield stores include new construction as well as the acquisition of one to four store operations 10Driving Long-Term Sustainable Growth
Improve Customer Experience Optimize Product &
• Online reputation management Service Offering
• Consistent in-store experience • Redefined selling approach
• Consistent store appearance • Optimized tire assortment
Scalable Platform to
Enhance Customer-Centric Drive Sustainable Accelerate Productivity
Growth & Team Engagement
Engagement
• Customer retention • Optimized store staffing model
• Customer acquisition • Clearly defined career path and
• Omnichannel enhanced training program
• Aligned compensation
Investments in Technology and Data-Driven Analytics to Support Strategic Initiatives
11Improve Customer Experience
Online Reputation Improve SEO and local listing management
Management Effectively build and manage online presence
Deliver a best-in-class experience to all customers
Consistent In-Store Provide clear product choices and quality service to Delivering a
Experience customers Five-Star
Experience
Consistent Store Modernize store layout
Appearance Establish clear standards for retail banners
12Enhance Customer-Centric Engagement
Focus marketing spend to higher ROI channels
Focus on direct marketing via new analytic-based
Customer Retention CRM platform
Enhance private label credit card offering
Use analytics to optimize digital efforts
Leverage market segmentation and demographic
Customer Acquisition information to facilitate direct marketing to target
customers
Upgraded website with mobile-capable architecture
Launch e-commerce capability for online tire
Omnichannel purchases and installations in-store
Leverage preferred tire installer agreements to
drive traffic
13Omnichannel: Expanded Amazon.com Collaboration
Expanded Collaboration With Amazon.com Supports Monro’s Online Tire Retailers Installation Strategy
Expanded Amazon.com Collaboration
Monro’s tire installation services available to customers who purchase tires
online from Amazon.com and select the Ship-to-Store option
Initially launched in the greater Baltimore area, now available at nearly 400
locations operating under a number of Monro brands in Georgia, Florida,
Illinois, Indiana, Ohio, Maryland, Michigan, New York, Tennessee and Virginia
Collaboration will be expanded to provide tire installation services to
Amazon.com customers at all of Monro’s retail locations across 28 states
Increased Traffic Driven by Integration with Online Tire Retailers
50% of these customers are new to Monro1
Can add newly acquired customers to CRM database, building long-term one-
to-one relationships
1Reflects historical data based on existing relationships with online tire retailers 14Optimize Product & Service Offering
Past Present Future
Simplified invoices and inspection forms
Redefined Selling Clearly defined ‘Good, Better, Best’ product options
Approach Educate customers on new tire installation, brake
and oil change service options
Improve tire sales strategy to offer the right tires at
Optimized Tire Assortment the right price
Leverage data to optimize inventory assortment
15Accelerate Productivity & Team Engagement
Achieve the right balance of labor and technical
Optimized Store abilities across our stores
Staffing Model Implement data-driven store scheduling software
Attract, train and retain talented technicians and
Clearly Defined Career Path managers
and Enhanced Launched Monro University, a comprehensive
learning management system, to pilot stores in
Training Program January 2019
Aligned store compensation model with
performance
Aligned Compensation Incentives grow as sales, profits and customer
experience improve
16Monro.Forward Progress Update
Monro.Forward Initiatives Well Underway and Advancing as Planned
Successfully implemented Monro playbook and store re-image initiative pilot at 31
locations in Rochester, NY during 3QFY19, leading to improved conversion and
Improve Customer customer satisfaction
Experience Modernized store layout to be rolled out across the Company’s remaining markets
and store formats over the next 3 to 5 years
17Monro.Forward Progress Update (Cont.)
Monro.Forward Initiatives Well Underway and Advancing as Planned
Continuing to execute customer satisfaction and online reputation management
Improve Customer program across Monro’s store base
Experience Focus on the in-store experience is having significant impact on Company online
reviews and has increased “Star Ratings” to 4.7 Year-to-Date and 4.5 All-time
120,000 4.7 4.7 4.7
4.7
4.5
100,000 4.4 4.5
4.3
4.2
4.1
Number of Reviews
80,000
4.0
60,000
3.7
40,000
20,000
-
Q3 FY18 Q4 FY18 Q1 FY19 Q2 FY19 Q3 FY19 YTD FY19 *
Negative Neutral Positive End of Quarter All Time Star Rating Quarterly Rating
*Through 1/25/19
18Monro.Forward Progress Update (Cont.)
Monro.Forward Initiatives Well Underway and Advancing as Planned
Retail website driving increase in online appointments and mobile calls
Enhance Customer- Expanding direct marketing through CRM platform following strong pilot campaigns
Centric Engagement Data-driven “new customer” marketing initiatives on track for 4QFY19 launch
Collaboration with Amazon.com at nearly 400 stores supports omnichannel strategy
Continued momentum of Good-Better-Best product and service packages
Optimize Product & Optimized tire sales and pricing strategy driving strength in tires
Service Offering Introduction of new tire brands to optimize tire assortment in 4QFY19
Optimized store staffing model after rightsizing overstaffed and understaffed stores
Accelerate Productivity Data-driven store scheduling and staffing software to be implemented in FY20
& Team Engagement Recently launched Monro University training program pilot
19Scalable Platform to Drive Sustainable Growth
A Scalable Business Model with Multiple Avenues for Growth
Same Store Sales Growth
Through Monro.Forward, drive higher
customer retention and acquisition rates
Acquisitions
Create value through profitable Continue to increase store density in our 28 states
acquisitions Expand geographically into attractive markets
On average, acquisitions represent the opportunity for 10%
annual sales growth
Greenfield Expansion
Acquisition growth drives scale and operating margin expansion,
Continue new store openings in existing
strengthening competitive advantages
markets
~20 to 40 stores per year
20A Proven M&A Strategy
Monro’s Acquisition Strategy Has Delivered Significant Growth Over the Years
A Proven Track Record
45 acquisitions in the last 16 fiscal years, encompassing 681 locations and $900 million of revenue
29 acquisitions in the past 6 fiscal years, adding 386 locations and $520 million in revenue
− Entered 8 new states, expanding our presence in the Southern and Western markets
Average
Historical Acquisition Activity Acquisition
Size
FY13 FY14 FY15 FY16 FY17 FY18 FY19 to date
78 stores,
35 stores and 4 wholesale
Number of
139 stores 20 stores 80 stores 134 franchise locations and 28 stores 55 stores 15 Stores
locations
locations 2 retread
facilities
Annualized
~$190 million ~$35 million ~$90 million ~$35 million ~$150 million $20 million $87 million ~$20 million
Sales growth
21Strong Third Quarter Fiscal 2019 Results
Improving In-Store Execution Drove Strong Top-Line Performance
3QFY19 3QFY18 Δ FY19 YTD FY18 YTD Δ
Sales (millions) $310.1 $285.7 8.5% $913.0 $842.2 8.4%
Same Store Sales1 3.3% -3.1% 640 bps 2.8% -0.7% 350 bps
Gross Margin 38.0% 37.4% 60 bps 38.9% 38.9% 0 bps
Operating Margin 9.9% 10.3% (40 bps) 10.8% 11.5% (70 bps)
GAAP EPS $.61 $.35 74.3% $1.87 $1.39 34.5%
One-time costs2 $.02 $.15 $.06 $.18
Christmas Holiday Shift $.04 $0.04
One-time income tax benefit ($.06) ($.06)
Adjusted EPS $.61 $.50 22% $1.91 $1.57 22%
1Adjusted for one less selling day in 3QFY19 due to the Christmas holiday calendar shift
2Diluted earnings per share included $.01 per share of one-time costs related to Monro.Forward investments and $.01 per share of corporate and field management realignment costs in the third quarter of fiscal 2019, compared to $.15 per share of one-time costs in the third quarter of
fiscal 2018, including $.01 per share in management transition costs, $.04 per share in litigation settlement costs and $.10 per share related to the net impact of newly enacted tax legislation. In the first nine months of fiscal 2019, there were $.06 per share of one-time costs, compared to
$.18 per share of one-time costs in the first nine months of fiscal 2018.
22Fiscal 2019 Outlook
Guide to Upper End of Fiscal 2019 Comparable Store Sales and Reiterate EPS Guidance
Operating Margin
Assumes operating margin of ~11% at midpoint of FY19 sales guidance
FY19 FY18 Δ Expect stable tire and oil costs year-over-year
Expect to generate earnings increase on a comparable store sales increase
Sales (millions) $1,185 to $1,215 $1,128 5.1% to 7.7% above ~1%
Tax Savings
Same Store Sales 110 bps to Estimate ~$.40 tax benefit from newly enacted tax legislation
+1% to +3% -0.1%
(on a 52-week basis) 310 bps
Tax rate expected to be reduced from ~37% to ~22% in FY19
Reinvestment of Tax Savings
GAAP EPS $2.30 to $2.40 $1.92 20% to 25%
Reinvestment of ~35%, or ~$.14, to support Monro.Forward strategy
($.09 of recurring expenses and $.05 of one-time items in FY19):
Stores and Weeks – Improve Customer Experience – (~$.05)
Guidance includes recently announced and completed acquisitions – Enhance Customer Engagement – (~$.01)
and excludes any additional potential acquisitions
– Accelerate Productivity & Team Engagement – (~$.08)
Guidance includes eight ground-up greenfield store openings in FY19
Additional Guidance Assumptions (at the midpoint)
FY19 represents a 52 week year compared to 53 weeks for FY18
Interest expense of ~$28 million
Depreciation and amortization of ~$56 million
EBITDA of ~$187 million
33.6 million weighted average number of diluted shares outstanding
23Fiscal 2019 Outlook – Capital Investment
Incremental Capital Spending Focused Primarily on Store Refresh Pilot
Capital Investment Area
Store Refresh Initiative
(Capital Spending by Area, $ in Million)
Renovation Plus Refresh Light
$39.1 $43.0
100%
3.8 4.5
90% IT Infrastructure
1.7
5.8
80% Monro.Forward Store Re-
Image Refresh
70%
Other
60%
50%
New Stores
29.3 Renovation
25.8
40%
Renovation Light
30%
20%
10% 6.9 Appropriate level of investment driven by store
4.3
0% age, size and market demographics
FY18 Actual FY19 Estimate
31 store pilot completed in Q3 FY19
24Three-Year Organic Growth Financial Targets
Accelerating Same Store Sales Growth Drives Operating Leverage and Double Digit Earnings Growth
5.0% SSS Improvement
4.0% +
4.0%
Same Store Sales Growth Accelerate from 2% to above 4%
3.0%
2.0%
2.0%
1.0%
Operating Margin Return to 12%+ Operating Margin 0.0%
Expansion FY19E FY21E
13.0% Operating Margin
Expansion
12.5%
Deliver Consistent 10% - 15% Earnings 12.0%+
Earnings Per Share Growth Growth 12.0%
11.5%
11.1%
11.0%
10.5%
FY19E FY21E
Note: Financial targets exclude any future potential acquisitions 25Disciplined Capital Allocation
Executing on Growth Strategy While Maintaining a Disciplined Approach to Capital Allocation
Investing in the Business
Capex of $30.8M in the first nine months of fiscal 2019
Continue to expect ~$75M of incremental Capex over the next 5 years to invest in store re-image and technology
Executing on M&A Opportunities
Spent $46.1M on acquisitions in the first nine months of fiscal 2019
Signed definitive agreement to acquire 12 stores, bringing annualized sales from fiscal 2019 acquisitions to $87M
Returning Cash to Shareholders
Paid $20.1M in dividends in the first nine months of fiscal 2019
Currently $.20 per share quarterly, an increase of 11% from 3QFY18
Utilizing Strong Balance Sheet
Generated $128.6M of operating cash flow in the first nine months of fiscal 2019
Debt-to-EBITDA ratio as of December 2018 of 2.1x provides significant flexibility to fund M&A strategy
26Investment Highlights
Leading chain of Company-operated undercar care facilities in the U.S. with a wide breadth of product and service offerings
Strong market position in Northeast, Great Lakes and Mid-Atlantic with a presence in 28 states
17 years of consecutive annual sales growth
Low cost operator with strong operating margins
Well-positioned to capitalize on a favorable industry backdrop
Monro.Forward strategy creating a scalable platform to drive sustainable growth, with a focus on operational excellence to
increase overall customer lifetime value
Significant growth opportunity to execute disciplined acquisition strategy in a highly fragmented industry
Strong balance sheet and cash flow
Delivering consistent shareholder returns with thirteen dividend increases, every year since a cash dividend was initiated
27Appendix
28Monro.Forward Strategic Initiatives
Q4 FY18 FY19 Q2 FY19 Q3 FY19 Q4 FY19 FY20 Q2 FY20 Q3 FY20 Q4 FY20 FY21
Foundational technology & tools
Scale store refresh & operational
Pilot store excellence
Improve Customer refresh &
operational Technology based in-store experience
Experience excellence Scheduled maintenance
in-store selling
Data-driven CRM Data-driven “new customer”
marketing
Enhance Customer-
Centric Engagement New websites Monro omnichannel &
e-commerce
Optimize Product & New in-store sales
packages Tire category management
Service Offering
Monro University pilot
Accelerate New store comp plans Store staffing & scheduling system
(includes career path,
Productivity LMS)
& Team Engagement
= Completed Initiatives
29You can also read