An Economic Snapshot of Queens - Office of the State ...
←
→
Page content transcription
If your browser does not render page correctly, please read the page content below

An Economic Snapshot of Queens
Queens is the largest in size of the five boroughs
Major Findings that make up New York City and the second most
populous. Since the end of the recession in 2009,
The population of Queens increased by it has added 110,500 private sector jobs, 10 times
25 percent since 1980 to reach a record of more than were lost during the recession and
nearly 2.4 million in 2017, driven by more than twice as many as the second-largest
immigration. expansion in the 1990s. Health care, leisure and
The foreign-born population has more than hospitality, business services and retail were
doubled since 1980, reaching 1.1 million. responsible for more than two-thirds of the jobs
added since 2009.
Immigrants represented 47 percent of the
borough’s population. They also represented New York City’s two airports are located in the
more than half of the work force and made up borough and are an important part of the local
69 percent of the self-employed entrepreneurs. economy, as well as a gateway to the world. Both
airports are undergoing major upgrades, which
The number of businesses increased by will create thousands of new jobs.
22 percent since the end of the recession in
2009, faster than the citywide rate (17 percent). Queens is the most diverse county in the nation
and has the second-highest share of immigrants.
Business sales increased by 54 percent since Immigrants have played a large part in the
2009 to reach a record of $12.9 billion in 2016. borough’s success, and the importance of
maximizing their participation in the 2020 U.S.
Private sector employment was on pace to
Census cannot be overstated.
reach a record of 567,800 jobs in 2017, an
increase of 24 percent since 2009. Economic growth is evident across the borough,
particularly in Long Island City, Far Rockaway,
The average salary for private sector jobs was
Flushing and Jamaica. The opening of the Cornell
$48,400 in 2016, the highest among the four
Tech campus on Roosevelt Island is encouraging
boroughs outside of Manhattan. commercial development in western Queens.
The borough accounted for 58 percent of all Sunnyside Yard and western Queens exemplify
transportation jobs in the City and 96 percent of the potential for future economic development in
air transportation jobs. the borough.
The unemployment rate fell from 8.6 percent in With its many cultural and culinary offerings,
2010 to 4 percent in 2017, lower than the Queens has become a tourist destination. The
citywide rate and the lowest on record. borough has residents from more than 120
countries and offers a restaurant for every taste.
Median household income was $62,200 in
2016, higher than the citywide median. Queens still faces challenges, such as school
overcrowding and the need for more affordable
Nearly half of the households (44 percent) housing, but the future looks bright. The borough
owned their own homes in 2016, higher than set new employment records for six consecutive
the citywide share of 32 percent. years and the unemployment rate has reached a
record low. Economic development projects in the
Since 2000, the number of residents aged 55
pipeline and those under consideration will create
and over has increased by 31 percent.
more opportunities for growth.
Report 1‐2019 | May 2018 1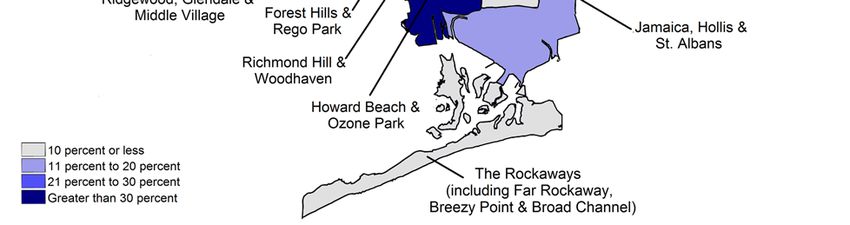
Introduction                                              Demographic Trends
Queens was established in 1683 as one of the 12           The population declined by 5 percent during the
original counties in New York State. Today, it is         1970s (half of the citywide decline), but has been
the second most populous county in the State,             rising since then.1 Since 1980, the population has
and nearly half of its residents are immigrants. It       increased by 25 percent, reaching a record of
is the largest borough by land area, and has the          nearly 2.4 million in 2017. More than one-quarter
most parkland of any borough.                             (27 percent) of the City’s population lives in
                                                          Queens, a share that has been stable since 1980.
Flushing Meadows Corona Park houses Citi Field
(home to the New York Mets) and the USTA Billie           Queens is the most racially and ethnically diverse
Jean King National Tennis Center (site of the             county in the nation.2 No racial or ethnic group
U.S. Open). The park also contains soccer fields,         held more than a 30 percent share of the
the Queens Botanical Garden, the Queens Zoo,              population, and four groups held double-digit
and the Unisphere, the symbol of Queens.                  shares. In 2016 (data for 2017 are not yet
                                                          available), Hispanics or Latinos accounted for
The Rockaway Peninsula offers miles of beaches            28 percent of the population, Whites for
and a recently restored 5.5-mile boardwalk that           25 percent, Asians for 25 percent, and Black or
had been destroyed by Superstorm Sandy. The               African Americans for 17 percent.
Gateway National Recreation Area includes the
Jamaica Bay Wildlife Refuge and Jacob Riis                Queens had the second-highest median age of
Park.                                                     the five boroughs, increasing from 35.4 in 2000 to
                                                          38.3 in 2016. Since 2000, residents aged 55 and
John F. Kennedy International Airport and                 over were the fastest-growing age group (rising
LaGuardia Airport are two of the busiest airports         by 31 percent). By 2016, Queens had more
in the world. The Aqueduct Racetrack and the              residents in this group than any other borough,
Resorts World Casino (the only casino in New              and their share of the population (27 percent) was
York City) are located in South Ozone Park.               the second-largest after Staten Island.
The borough is served by eight major highways             The number of children under the age of 18
as well as subway, commuter railroad and bus              declined between 2000 and 2010, but increased
lines, and four ferry stops. Still, mass transit is not   by 3 percent by 2016 (faster than the citywide
readily accessible from some neighborhoods, and           rate). Children under the age of 10 increased
congestion and delays are common.                         three times faster (9 percent). Elementary
                                                          schools in Queens are already the most
Kaufman Astoria Studios and Silvercup Studios,
                                                          overcrowded in the City, operating at 116 percent
two of the largest film and television studios in the
                                                          of capacity during the 2016-2017 school year.
nation, are located in western Queens. Famous
cultural institutions include MOMA PS1 (an                Educational attainment has been rising in recent
affiliate of the Museum of Modern Art), the New           years. Since 2010, the share of residents with a
York Hall of Science, the Queens Museum and               bachelor’s degree or higher has risen by two
the Museum of the Moving Image.                           percentage points to nearly one-third of the
                                                          population (31 percent), although it remains
Eleven colleges and universities are located in           below the citywide share (37 percent).
the borough, including St. John’s University and
five colleges of the City University of New York          Five of the 10 neighborhoods in the City with the
(LaGuardia Community College, the CUNY                    longest commute times to work were located in
School of Law, Queens College, Queensborough              Queens, with residents in the southeast section
Community College and York College). The                  facing the longest commutes. The Mayor has
Queens Library serves 2.3 million people from 62          proposed a light-rail line from Astoria to Sunset
locations across the borough.                             Park to increase transportation options.

2                                                                                              Report 1‐2019
The Immigrant Population Strong Business Growth
Growth in the foreign-born population was Queens had an estimated 52,100 businesses in
responsible for the increase in the total population 2017, an increase of 22 percent since the end of
in the borough between 1980 and 2016. The the recession in 2009 (faster than the citywide
foreign-born population more than doubled during growth rate of 17 percent).4 More than two-thirds
this period, reaching 1.1 million. In 2016, Queens of the businesses had fewer than five employees
had the fourth-largest number of immigrants of and 84 percent had fewer than 10 employees.
any county in the nation, following Los Angeles The borough also had 43 businesses with more
(CA), Miami-Dade (FL) and Harris County (TX). than 1,000 employees, which were concentrated
Immigrants constituted half (47 percent) of the in health care and transportation.
population in 2016, much higher than the citywide The retail sector was responsible for the largest
share (37 percent) and the second-highest of any
share of businesses (15 percent or 7,600 firms).
county in the nation (following Miami-Dade).3
Leisure and hospitality, business services,
Immigrants represented more than half of the
personal services and retail increased the most,
work force and made up 69 percent of the self-
with each adding more than 1,000 businesses.
employed entrepreneurs.
The Flushing area had the most businesses of
The immigrant community represents more than
120 different countries, and no single country of any Queens neighborhood (9,000, or 17 percent
origin is dominant, unlike most other large of the boroughwide total). It also added the most
counties in the nation. The largest share comes businesses between 2009 and 2017 (2,000) and
from China, which accounted for 14 percent of had the fastest growth (29 percent).5
the immigrant population. Immigrants from Since the end of the recession in 2009, taxable
Bangladesh, Colombia, the Dominican Republic, business sales grew by 54 percent (faster than
Ecuador, Guyana, India, Jamaica and Mexico
the citywide growth rate of 44 percent), reaching
each made up between 4 percent and 7 percent
a record of $12.9 billion in 2016 (see Figure 1).6
of the foreign-born population.
The areas with the fastest growth in sales were
Six of the 10 Census-defined neighborhoods in Howard Beach & Ozone Park, Jackson Heights &
New York City with the highest shares of North Corona, Astoria & Long Island City, and
immigrants were located in Queens. In these Flushing.
neighborhoods, immigrants represented more
than half of the local population. Successive FIGURE 1
waves of immigrants have shaped many Taxable Business Sales in Queens
neighborhoods, including Astoria (Greek), 14
Elmhurst and Corona (Hispanic), Flushing 12
(Asian), Forest Hills (Russian), Middle Village
10
(Italian) and Woodhaven-Richmond Hill (Indian).
Billions of Dollars
8
Queens is home to nearly half of New York City’s
6
Asian-American population. Among the five
boroughs, it has the largest populations of 4
Bangladeshi, Chinese, Filipino, Indian and 2
Korean Americans. It also has the largest
0
Colombian, Ecuadorian, Peruvian and
2009
2010
2011
2012
2013
2014
2015
2016
Salvadoran populations in the City, in each case
representing more than half of the citywide total. Sources: NYC Department of Finance; OSC analysis
May 2018 3Record Employment FIGURE 3
The current job expansion in New York City has Private Sector Employment in Queens
been the largest in the post-World War II era. 600
During the expansion, the boroughs outside of
550
Manhattan have been responsible for nearly half
Thousands of Jobs
of the private sector job gains in the City, a larger 500
share than in any other expansion since the 450
current data series began in 1975.
400
Since 2009, Queens has added an estimated
350
110,500 jobs, more than twice as many as in the
second-strongest expansion (see Figure 2). The 300
2000
2001
2002
2003
2004
2005
2006
2007
2008
2009
2010
2011
2012
2013
2014
2015
2016
2017*
number of jobs added during the current
expansion was 10 times more than were lost * 2017 is an estimate based on job gains through September 30, 2017.
Sources: NYS Department of Labor; OSC analysis
during the recession. Health care and leisure and
hospitality were responsible for almost half Health care is the largest employer, with 105,200
(45 percent) of the gains. jobs in 2017 (nearly one-fifth of all private sector
jobs), and had an average salary of $46,200. The
FIGURE 2 sector added 29,100 jobs since 2009 (an
Job Gains in Queens by Expansion Period increase of 38 percent), more than any other
120
sector (see Figure 4).
100
Thousands of Jobs
Transportation is the second-largest employment
80 sector. The sector was responsible for 67,100
60 jobs in 2017, paying an average of $63,400.
Since 2009, the sector has added 13,100 jobs, an
40
increase of 24 percent. The borough accounted
20 for 58 percent of all transportation jobs in the City
0
and 96 percent of all air transportation jobs.
1977-81 1982-87 1992-2000 2003-08 2009-17*
Retail trade is the third-largest employer with
* 2017 is an estimate based on job gains through September 30, 2017.
Sources: NYS Department of Labor; OSC analysis 63,700 jobs, and had an average salary of
$31,500. The sector grew by 19 percent between
Private sector employment was on pace during 2009 and 2017, adding 10,100 jobs. The Queens
the first three-quarters of 2017 to reach a record Center Mall in Elmhurst has nearly 1 million
of 567,800 (see Figure 3). This would represent square feet of leasable space and more than 150
an increase of 24 percent since 2009, slightly stores.
faster than the citywide growth rate during this
period (23 percent). Queens was responsible for The leisure and hospitality sector was responsible
15 percent of the jobs in New York City in 2017 for 58,200 jobs with an average salary of
and more than one-third (37 percent) of those $28,200. This sector was the second-largest
outside of Manhattan. contributor to growth, adding 20,300 jobs
between 2009 and 2017 (an increase of
The average salary of private sector jobs was 54 percent). Four-fifths of these jobs were added
$48,400 in 2016, the highest among the four in restaurants and bars, driven in part by tourism.
boroughs outside of Manhattan.7 Salaries have Visitors spent more than $8.4 billion in Queens in
been increasing since 2013, although they 2016 (second only to Manhattan), according to
remained below the prerecession peak in 2007 the Borough President and Tourism Economics.
after adjusting for inflation.
4 Report 1‐2019Since 2009, 62 new hotels have been built in the
borough, and hotel employment has increased by Spotlight on the Aviation Industry
28 percent. Most of the new hotels have been
built near JFK Airport, and in Flushing and Long Two of the region’s three major airports (John
Island City. F. Kennedy and LaGuardia) are located in
Queens. These two airports employed 49,000
The business services sector added 17,700 jobs people, contributed $64.4 billion in economic
since 2009 to reach 54,200 jobs in 2017 (an activity to the New York–New Jersey
increase of 48 percent). Large job gains were metropolitan region in 2017, and generated a
reported in accounting, janitorial, security and combined 436,000 jobs and $23 billion in
employment services.
wages, according to the Port Authority of New
The construction sector lost 14 percent of its jobs York and New Jersey. JFK is also one of the
(6,400) between 2008 and 2011 because of the world’s leading air cargo centers, with nearly
recession, but it bounced back with rapid growth 4 million square feet of cargo warehousing
over the next six years (growing by 32 percent or and office space.
12,900 jobs). A 49 percent increase in
construction permits during this period helped fuel LaGuardia is undergoing a much-needed
job growth.8 By 2017, construction was $8 billion renovation, with private financing
responsible for a record 52,700 jobs (the most of covering 75 percent of the cost. In 2016, work
any borough) with an average salary of $75,600. began on a $4 billion modernization of
Terminal B, and in 2017, work began on a
FIGURE 4 $4 billion Delta Airlines renovation of
Job Gains or Losses by Sector in Queens, Terminals C and D.
2009-2017*
A $10 billion modernization and renovation of
Health Care JFK is in the early planning stages. In July
Leisure and Hospitality 2017, the Port Authority issued a request for
proposals for preliminary design and
Business Services
engineering plans. Shortly thereafter, JetBlue
Transportation Airways announced plans to expand its
Retail Trade operations by building a new terminal by 2020.
Construction New York State has also committed funds to
Personal Services expand the Van Wyck Expressway from three
Social Assistance
lanes to four and to improve the Kew Gardens
Interchange to enhance access to JFK.
Educational Services
Financial Activities The Port Authority approved an additional
$55 million in 2017 for planning a LaGuardia
Other Sectors
AirTrain to connect the airport to the subway
Information and the LIRR at Willets Point. Expanding the
Manufacturing capacity of the JFK AirTrain from the Long
Island Rail Road station in Jamaica is also
-10 0 10 20 30
under consideration.
Thousands of Jobs
* 2017 is an estimate based on trends through September 30, 2017.
Note: "Other Sectors" includes utilities, warehousing and wholesale trade.
Sources: NYS Department of Labor; OSC analysis
May 2018 5Neighborhood Job Growth 2017. The Jamaica area was hard-hit by the
Private sector employment grew by 23 percent in recession and has been slow to recover.
New York City between 2009 and 2017, but five In an effort to take advantage of the close
of the 14 Census-defined neighborhoods in proximity of the Cornell Tech campus on
Queens were on pace for even faster growth.9 Roosevelt Island, the Borough President
Growth was fastest in the Howard Beach & commissioned the Queens Tech Strategic Plan to
Ozone Park area, rising by 43 percent (4,300 support tech innovation, industry growth and
jobs) over eight years. Leisure and hospitality revitalization of the waterfront in western Queens.
accounted for more than half of the jobs added. The initiative, which includes the Coalition for
As shown in Figure 5, growth was also strong in Queens, focuses on Long Island City, Hunters
the areas of Flushing (39 percent), Jackson Point and parts of Astoria and Sunnyside. Since
Heights (38 percent) and Richmond Hill 2009, employment in this area has grown by one-
(34 percent). Health care and transportation were third, driven by business services (the number of
driving factors. computer design jobs has increased by two-
thirds) and transportation.
By 2017, employment exceeded the prerecession
level in every neighborhood in Queens. Growth The unemployment rate in the borough fell from
was weak in the Rockaways between 2009 and the recessionary peak of 8.6 percent in 2010 to
2015, reflecting the impact of Superstorm Sandy 4 percent in 2017, lower than the citywide rate
and the closure of a hospital. Since then, job and the lowest level since the data series was
growth has accelerated, reaching a record level in created in 1990.10 Nonetheless, the rate remains
high in certain neighborhoods, such as the
Jamaica and Rockaway areas.11
FIGURE 5
Job Growth in Queens by Census-Defined Neighborhood
2009-2017*
* 2017 is an estimate based on employment trends through the first three-quarters of the calendar year.
Sources: NYS Department of Labor; OSC analysis
6 Report 1‐2019Household Income Housing
Median household income fell by 5 percent Queens has the most single-family homes in the
between 2008 and 2010 because of the City (half of the citywide total), according to the
recession, but then increased by 17 percent to New York City Department of Finance. The
reach $62,200 by 2016 (the latest available data). average median value for single-family homes fell
Growth was fastest in Ridgewood, Glendale & by 19 percent between 2006 and 2011 as the
Middle Village (40 percent), Astoria & Long Island recession pushed down values.13 Values began
City (30 percent), Howard Beach & Ozone Park to recover in 2013, reaching $656,000 in 2017, a
(29 percent) and Forest Hills & Rego Park new record, which was 18 percent higher than the
(28 percent). prerecession peak (see Figure 7).
Single-family home values ranged from less than
FIGURE 6 $425,000 in Arverne, Rockaway Beach and
Household Incomes and Poverty Rates Broad Channel to more than $1 million in
Household Growth Poverty Jamaica Estates and Holliswood.
Income Since 2010 Rate
Sunnyside and Astoria had the largest increases
Bronx $37,500 15% 28.4% in value since 2006 (more than 50 percent).
Brooklyn $55,200 31% 20.0% Values in Jamaica, South Ozone Park, Rosedale
and Howard Beach, which were hit hard by the
Manhattan $77,600 22% 15.5%
foreclosure crisis, remain below their
Queens $62,200 17% 13.6% prerecession peaks.14
Staten Island $77,200 9% 14.5%
According to the U.S. Census Bureau, 44 percent
New York City $58,900 21% 18.4% of households own their own homes (including
Sources: U.S. Census Bureau, 2016 ACS; OSC analysis cooperatives and condominiums), higher than the
Household income in Queens is higher than the citywide share (32 percent) and second only to
citywide median (see Figure 6), although it Staten Island. Ownership rates were highest
remains slightly lower than the prerecession level (about 70 percent) in Queens Village, Cambria
Heights & Rosedale; Bayside, Douglaston & Little
(adjusted for inflation). The median ranged from a
Neck; and Howard Beach & Ozone Park.
low of $42,200 in Elmhurst & South Corona to a
high of $80,500 in Queens Village, Cambria There are 21 public housing developments
Heights & Rosedale. operated by the New York City Housing Authority
in Queens. These developments include 15,716
Queens had the lowest household poverty rate apartment units and provide homes to 34,150
among the five boroughs (13.6 percent in 2016), residents. Queensbridge Houses is the largest
which was much lower than the citywide rate public housing development in the City.
(18.4 percent).12 The poverty rate, however, was Developments are also located in Flushing,
not uniform across the borough, ranging from a Jamaica, the Rockaways and Woodside. Many of
low of 7.8 percent in Bayside, Douglaston & Little these developments are in disrepair and require
Neck to a high of 22.3 percent in Elmhurst & significant capital improvements.
South Corona.
More than half of the households in Queens rent
Median household income for senior households their homes. Median rent (including utilities) was
(where the primary householder is age 65 or $1,452 in 2016, up from $1,065 in 2006 (see
older) was $39,400 in 2016, higher than the Figure 7). Bayside and Astoria were on
citywide median for this population ($34,600). StreetEasy’s list of the “hottest neighborhoods” in
Consequently, senior households had a poverty New York City in 2017, while Flushing, Elmhurst
rate of 17.2 percent, lower than the citywide and Woodside made the “neighborhoods to
poverty rate for this population (21.6 percent). watch” list for 2018.
May 2018 7FIGURE 7
Housing Costs in Queens
Median Single-Family Home Values Median Rent
700 1,500
Thousands of Dollars
600
1,200
500
Dollars
400 900
300 600
200
300
100
0 0
2006
2007
2008
2009
2010
2011
2012
2013
2014
2015
2016
2017
2006
2007
2008
2009
2010
2011
2012
2013
2014
2015
2016
Sources: Zillow Research; OSC analysis Sources: U.S. Census Bureau; OSC analysis
The share of households that devoted 30 percent An estimated 40 percent of senior households
or more of their incomes to rent (the level at devoted at least half of their incomes to rent, a
which rent is considered a burden) was level that is considered a severe rent burden.
56 percent in 2016, slightly higher than the Phase 1 of the redevelopment plan for Willets
citywide rate, and five percentage points higher Point includes 1,100 units of affordable housing,
than before the recession.15 including 220 units for low-income seniors.
1
U.S. Census data prior to 2000 are from IPUMS NHGIS, University of Minnesota, www.nhgis.org. Census data for 2017 are from the
Population Estimates Program. Data for 2005 through 2016 are from the American Community Survey (ACS) 1-year estimates.
2
Based on available ACS data for 2016.
3
Ibid.
4
Private sector business and employment data (both published and unpublished) are from the New York State Department of Labor’s
Quarterly Census of Employment and Wages (QCEW) program. This report uses trends through the first three-quarters of 2017 as a proxy
for the full year because fourth-quarter data were not available.
5
College Point Corporate Park in the Flushing area is home to more than 200 companies and 6,000 employees, with a range of industries
represented, including office operations, light and heavy manufacturing, construction equipment suppliers, printing, distribution and retail.
6
The New York City Department of Finance reports annual taxable sales data for the year ending February 28. The Office of the State
Comptroller attributes the data to the calendar year that includes the most months.
7
Average salaries are from the New York State Department of Labor’s QCEW program. 2016 is the most recent year for which annual data
are available.
8
Construction permits as reported by the New York City Department of Buildings.
9
This report uses trends through the first three-quarters of 2017 as a proxy for the full year because fourth-quarter data were not available.
10
Borough and citywide unemployment rates are from the New York State Department of Labor.
11
Neighborhood unemployment rates are from the ACS 2016 1-year and 2012-2016 5-year estimates.
12
The share of children living in poverty in Queens (17.4 percent) is about 10 percentage points lower than the share citywide.
13
According to data from Zillow Research. Neighborhood definitions used by Zillow Research cover smaller geographic areas than the
Census-defined neighborhoods used in other sections of this report.
14
Foreclosure data are from RealtyTrac, a real estate firm specializing in foreclosed and defaulted properties.
15
Does not reflect the impact of subsidies such as federal Section 8 vouchers.
Prepared by the Office of the State Deputy Comptroller for the City of New York
Office of the New York State Comptroller
110 State Street, Albany, NY 12236
(518) 474-4015 www.osc.state.ny.usYou can also read